


 |
| Gold V.1.3.1 signal Telegram Channel (English) |
USDJPY Approaches Key 162 Breakout Amid Fed and BOJ Divergence, July 1, 2026
2026-07-01 @ 11:01
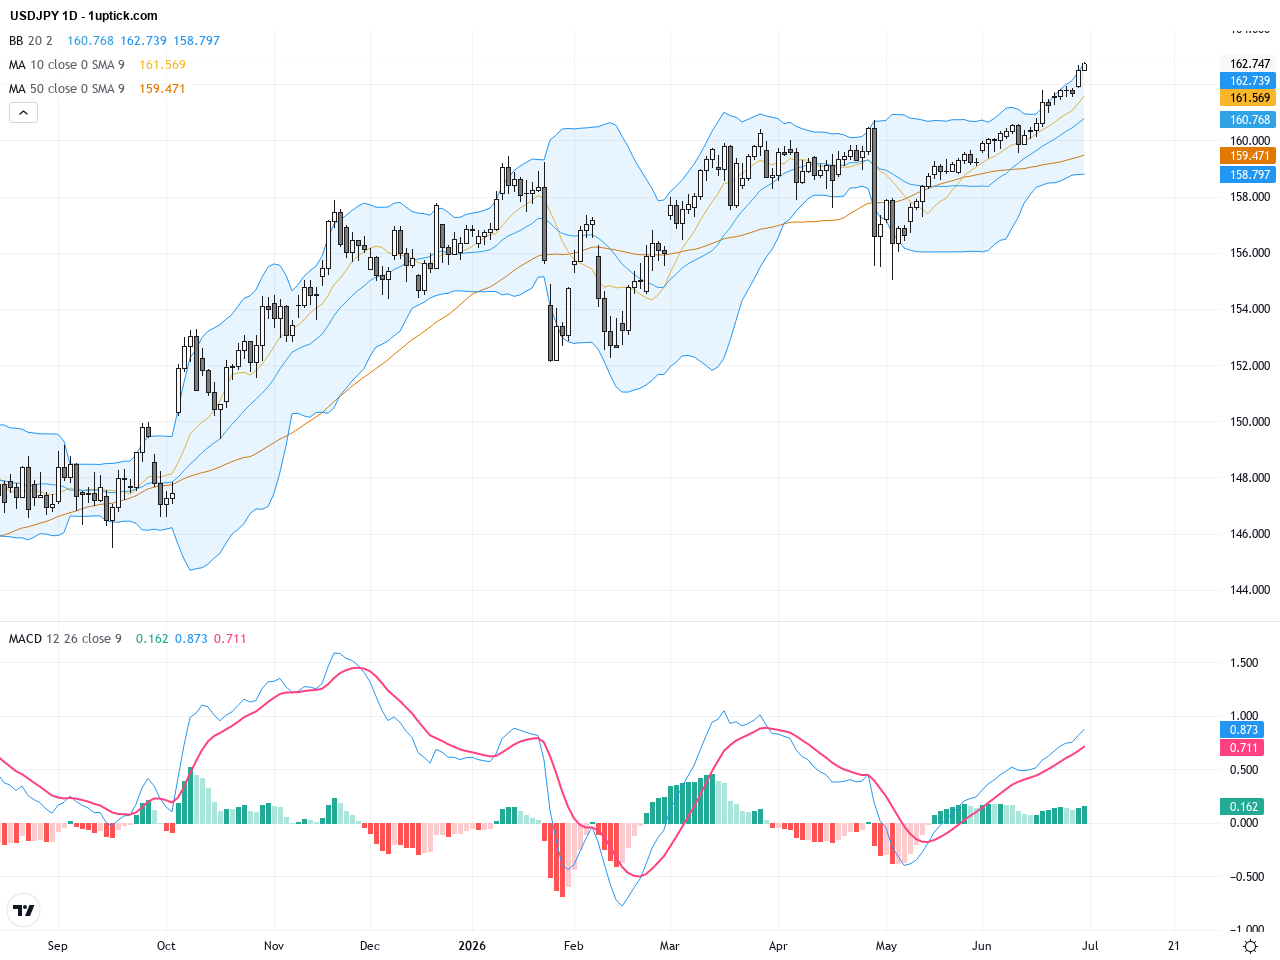
Over the past 24 to 48 hours, the USD/JPY pair has steadily climbed, breaking through and holding near the 162 level, slightly up from yesterday’s close at 162.747. The recent volatility is largely driven by the divergence in monetary policy between the U.S. and Japan. Sticky U.S. inflation has kept market bets on further Federal Reserve rate hikes alive, while the Bank of Japan maintains a dovish stance, causing the yen to weaken sharply to its lowest level since 1986.
On the news front, the stark contrast between the Fed and BOJ policies has propelled USDJPY beyond key resistance at 161.95, with growing expectations that U.S. rates will continue rising. The widening interest rate gap supports the yen carry trade, further pressuring the yen. Despite Japan’s significant efforts—spending about $72 billion to defend the yen—the currency continues to slide, raising expectations of potential government intervention. However, Japan’s Ministry of Finance has so far refrained from active FX market interference, leaving the USD/JPY pair supported and strong.
For everyday investors, this environment underscores a clear theme: the USDJPY is likely to keep climbing, reflecting fundamental economic and policy divergences between the two countries. Keeping a close eye on U.S. inflation data and BOJ policy decisions will be critical for anticipating next moves in this currency pair.
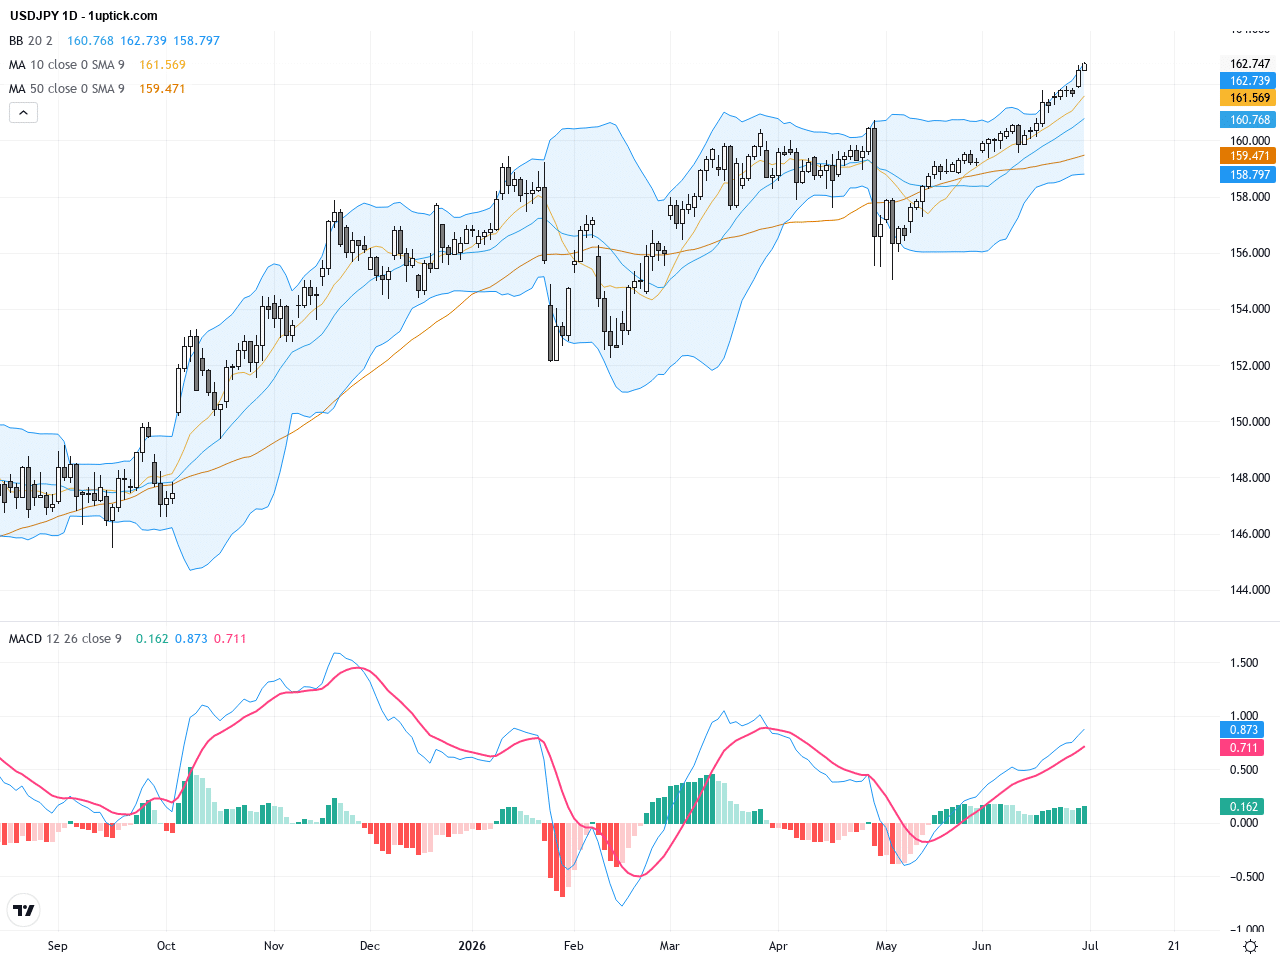
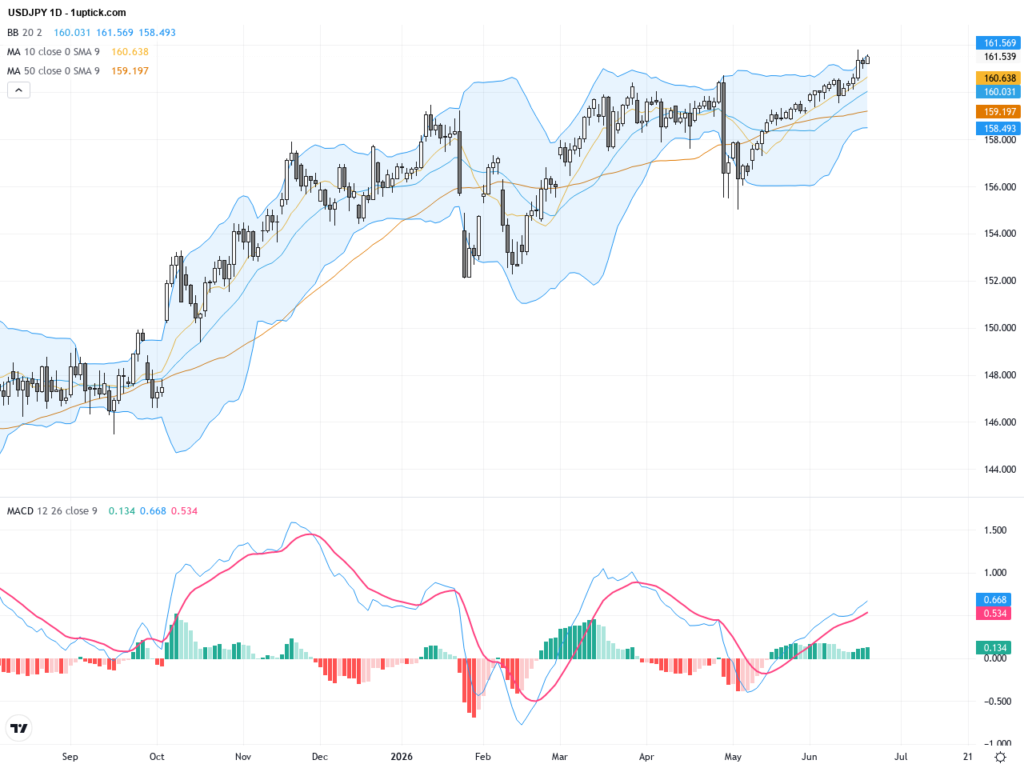
The daily chart reveals a strong uptrend in USDJPY, with the price climbing from around 159 to current levels, breaking above key moving averages (50-day at approximately 159.39 and 200-day at 156.39). The Bollinger Bands have widened, indicating increasing volatility, and the MACD remains above its signal line, showing sustained bullish momentum. This long-term bullish structure suggests continued strength in the pair.
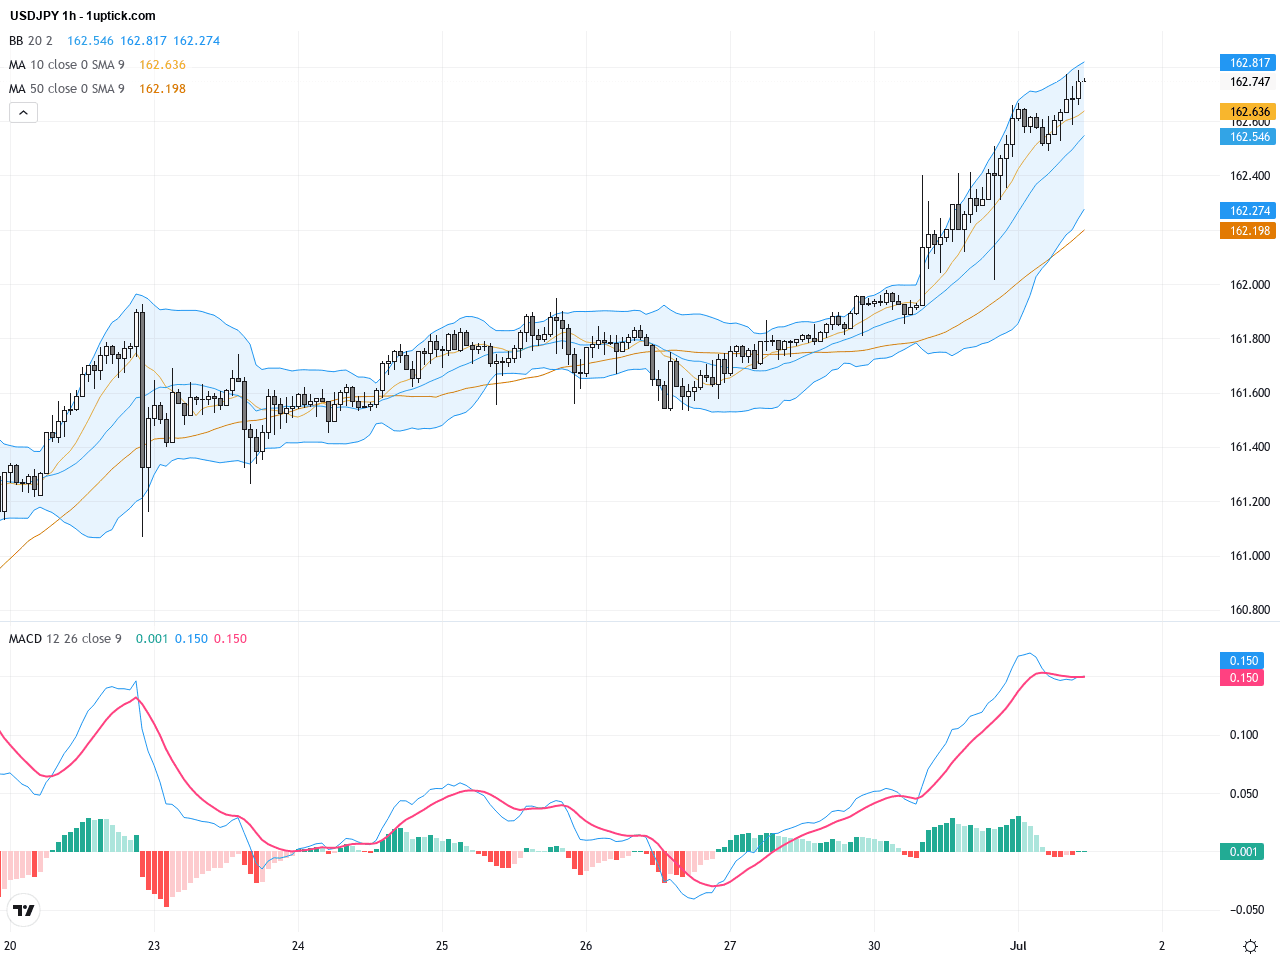
Examining the past 3-5 days on the hourly chart, USDJPY shows increasing volatility with short-term moving averages aligned bullishly. The price often trades near the upper Bollinger Band, indicating a dominant short-term uptrend. A bullish flag pattern is forming, and a breakout above the neckline would likely accelerate the upside. The recent bullish engulfing candlestick further supports short-term buying pressure and momentum.
Technical Trend: Trend Direction: Decisively Bullish
Technically, USDJPY remains robustly bullish with MACD and RSI indicators confirming momentum. The emerging bullish flag and recent bullish engulfing candlestick pattern signal a potential continuation to the upside. Rising volume supporting price advances reinforces the strength of this move. Traders should watch whether USDJPY consolidates above 162 and tests the resistance at 164, with the dovish stance of BOJ further underpinning upside potential.Today, Japan’s second-quarter Tankan Manufacturing Index released at 01:50 GMT+1 came in at 22, above the forecast of 16, while the Non-Manufacturing Index was 37 versus the predicted 35. This suggests solid business conditions in Japan. While this data may offer short-term support to the yen, it is unlikely to counterbalance the stronger U.S. rate hike expectations, so the overall bullish USDJPY trend remains intact.
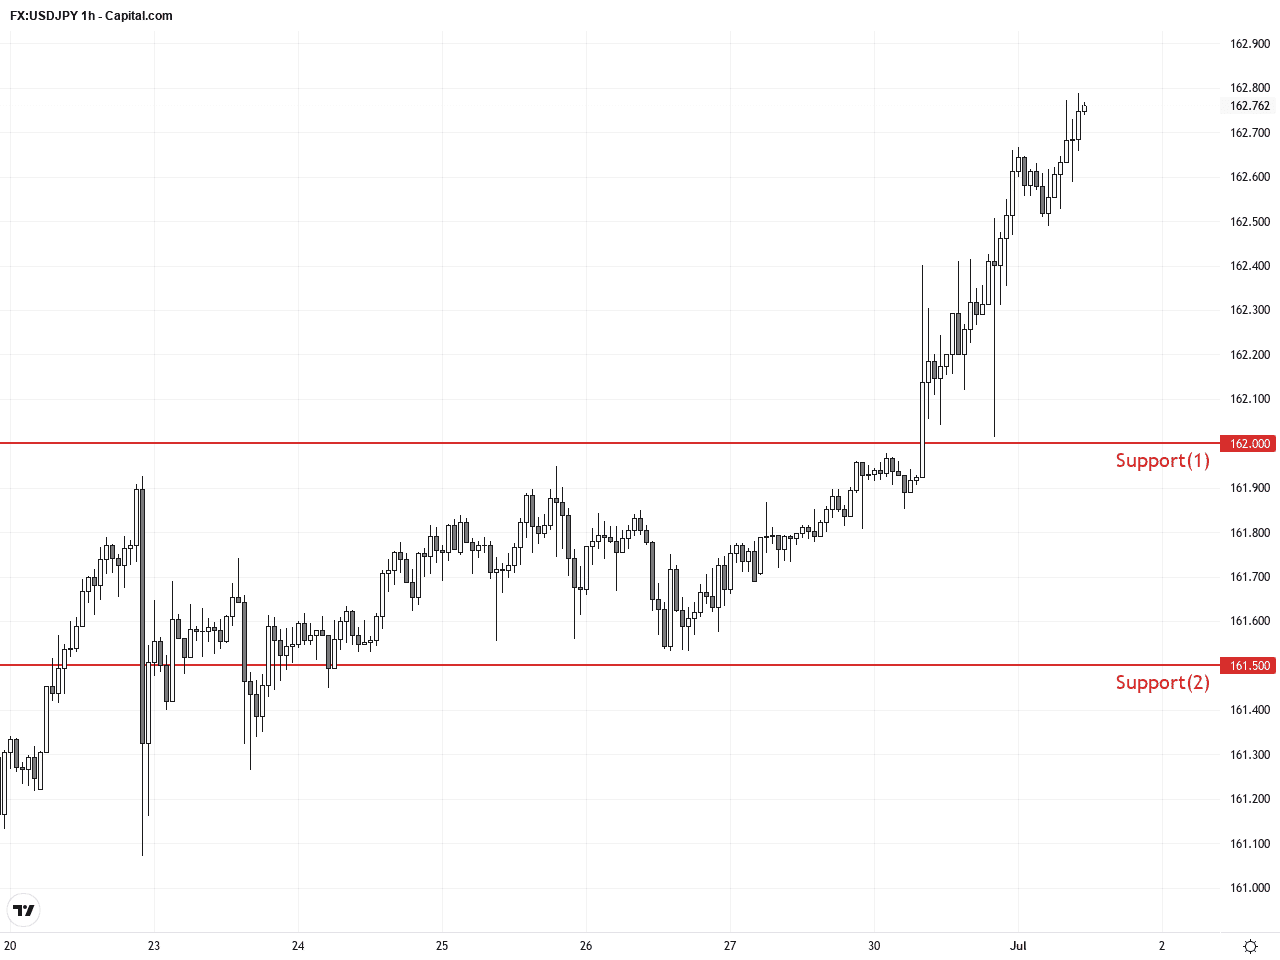
Resistance & Support
The above financial market data, quotes, charts, statistics, exchange rates, news, research, analysis, buy or sell ratings, financial education, and other information are for reference only. Before making any trades based on this information, you should consult independent professional advice to verify pricing data or obtain more detailed market information. 1uptick.com should not be regarded as soliciting any subscriber or visitor to execute any trade. You are solely responsible for all of your own trading decisions.