


 |
| Gold V.1.3.1 signal Telegram Channel (English) |

WTI Crude Oil: Navigating Price Volatility Amid Middle East Tensions and Key Support Levels, July 2, 2026
2026-07-02 @ 06:03
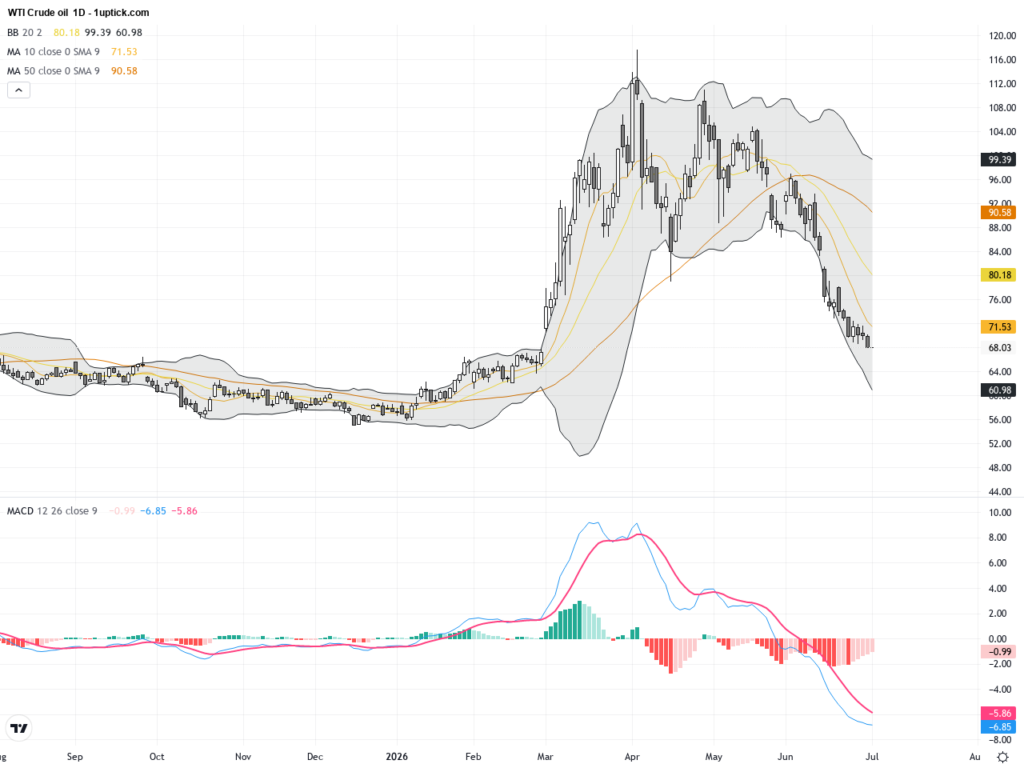
Over the past 24 to 48 hours, WTI Crude oil prices have shown a clear downward trend, following yesterday’s closing price at $68.58. The market sentiment remains subdued due to several influencing factors. Overall, commodity prices in June saw declines driven by a rallying US dollar index and sustained elevated interest rates, with energy and precious metals experiencing the sharpest drops.
Recently, easing Middle East tensions, especially progress in US-Iran talks regarding the Strait of Hormuz, have removed part of the geopolitical war premium, putting pressure on WTI prices. Although Iran maintains control over the Strait, a peace agreement between the US and Iran would stabilize oil supply outlook, reducing price volatility further. Additionally, with the Independence Day weekend approaching, US pump prices continue to fall, signaling cautious consumer sentiment and demand pressures.
For the average investor, this indicates that oil prices remain sensitive to international political and economic factors in the short term, calling for a reassessment of investment strategies. Unlike past episodes of sudden spikes due to geopolitical crises, the current downward trend is more so a reflection of a strong dollar and higher interest rates dampening overall demand.

The WTI Crude daily chart indicates a clear downtrend since mid-June when prices hovered near the $81 resistance zone. Since then, prices have steadily declined and consolidated around $68-$70. The 200-day moving average is acting as resistance, and Bollinger Bands have narrowed, implying reduced volatility. The MACD stays bearish with the fast line below the slow line and spreading apart, signaling downward momentum. Overall, the longer-term outlook remains bearish with key support near $67.5.
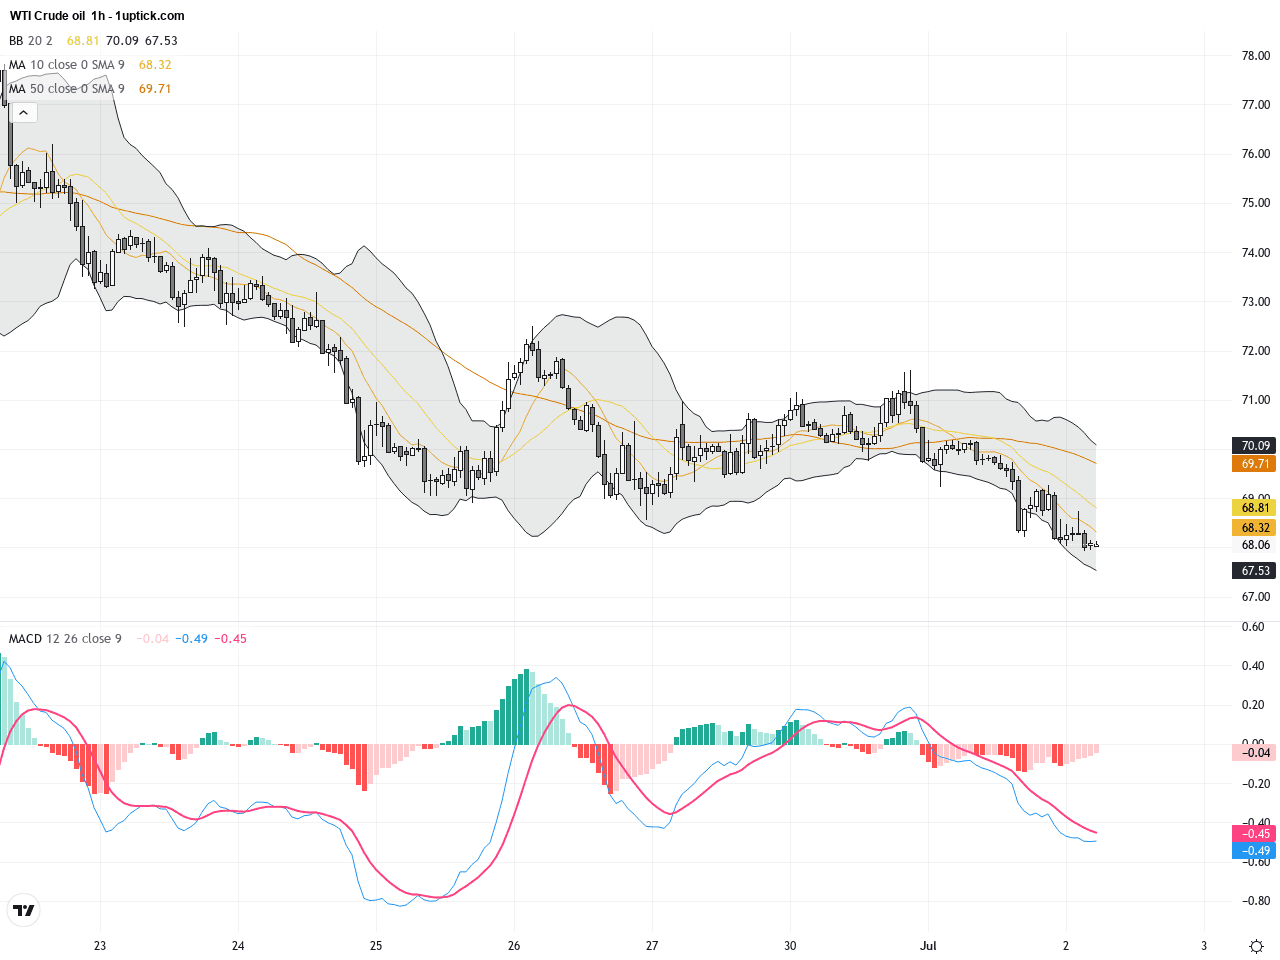
On the 5-day hourly chart, WTI Crude has been trading within a range of $69 to $67.5 after breaking below $70. Short-term moving averages (50 and 100 periods) are aligned bearishly, with multiple tests of the $67.5 support holding firm. Bollinger Bands near the lower band show potential for a short-term bounce, and MACD indicates slight bullish divergence. However, the trend remains weak, suggesting cautious trading and potential opportunities for measured buy-the-dip strategies.
Technical Trend: The current market trend for WTI Crude Oil is cautiously bearish with signs of volatile sideways consolidation.
Technically, WTI Crude is forming a descending flag pattern following the mid-June downtrend. The recent long lower shadow candlestick indicates sellers are losing strength, hinting at a possible short-term rebound. However, the persistent bearish MACD momentum cautions traders that the downside risk remains if prices fail to break and hold above $70. Close monitoring of these technical signals can help identify high-probability trade setups.There are no significant or direct economic events scheduled today that will impact WTI Crude Oil. Market focus should remain on geopolitical developments and upcoming supply-demand reports.
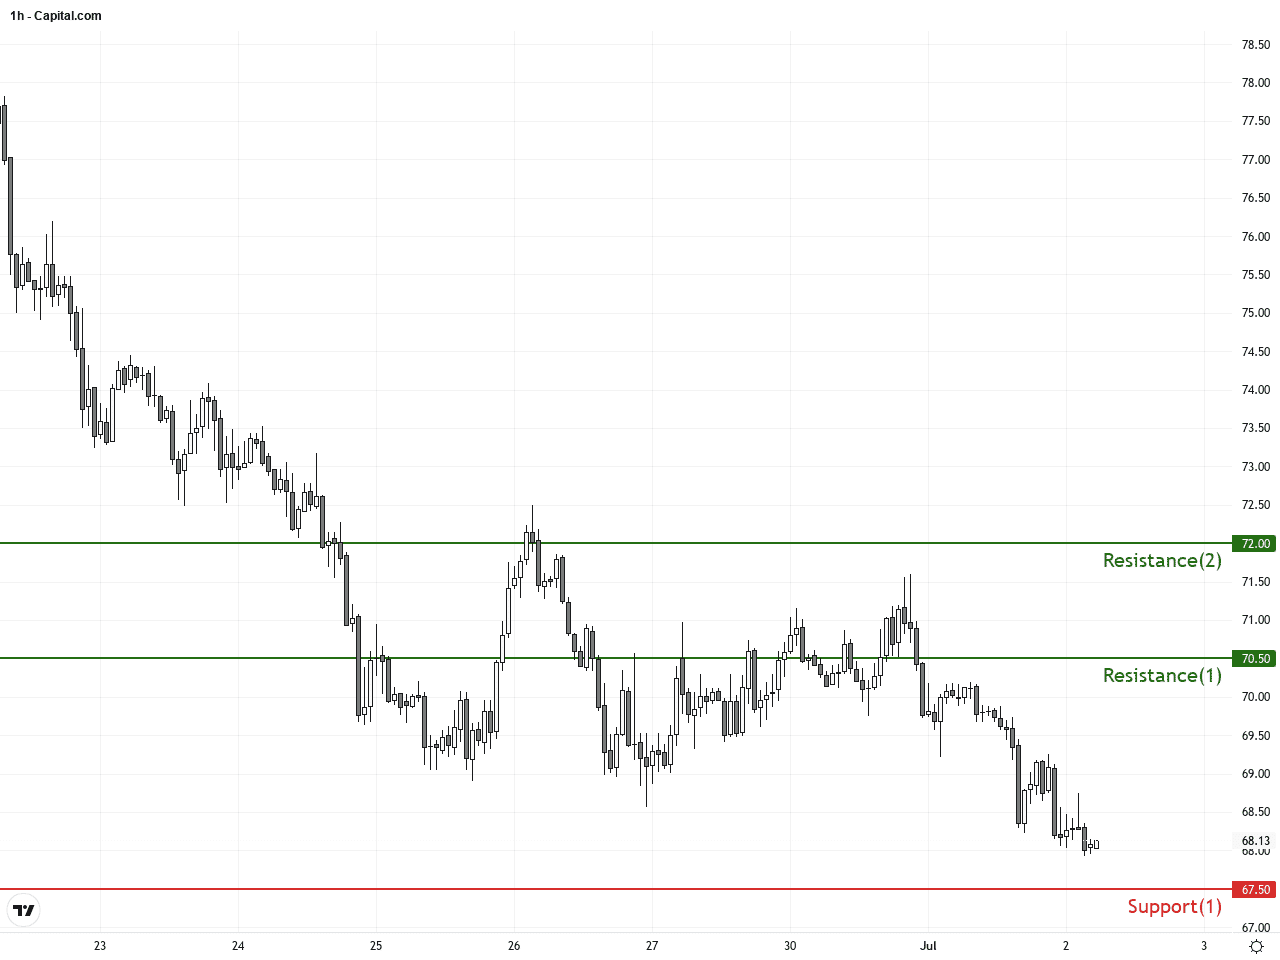
Resistance & Support
Run Live WTI Crude Oil Analysis
The above financial market data, quotes, charts, statistics, exchange rates, news, research, analysis, buy or sell ratings, financial education, and other information are for reference only. Before making any trades based on this information, you should consult independent professional advice to verify pricing data or obtain more detailed market information. 1uptick.com should not be regarded as soliciting any subscriber or visitor to execute any trade. You are solely responsible for all of your own trading decisions.