


 |
| Gold V.1.3.1 signal Telegram Channel (English) |

XAUUSD: Gold Tests Critical Support Amid Volatile Trading Outlook, July 2, 2026
2026-07-02 @ 05:04
Over the past 24 to 48 hours, gold (XAUUSD) has experienced notable declines. From yesterday’s closing price of 4031.705 USD, gold has slipped below the 4000 USD threshold to around 3990 USD, reflecting multiple pressures weighing on the precious metal.
According to recent market news, gold fell 24% during the 2025 Iran war, challenging its reputation as a safe haven asset. In 2026, rising Fed rate hike bets and a stronger US dollar have kept gold and silver prices under pressure. Although the tentative US-Iran ceasefire provided a brief rebound, the overall momentum remains bearish. Deutsche Bank has significantly cut gold price forecasts, warning that if the Fed hikes rates multiple times, gold could fall toward $3800.
For average investors, these developments indicate gold may no longer serve as a reliable safe haven. The combination of a strong dollar and potential interest rate increases signals capital shifting away from gold. Investors should reconsider their portfolio diversification strategies carefully amid this ongoing volatility.

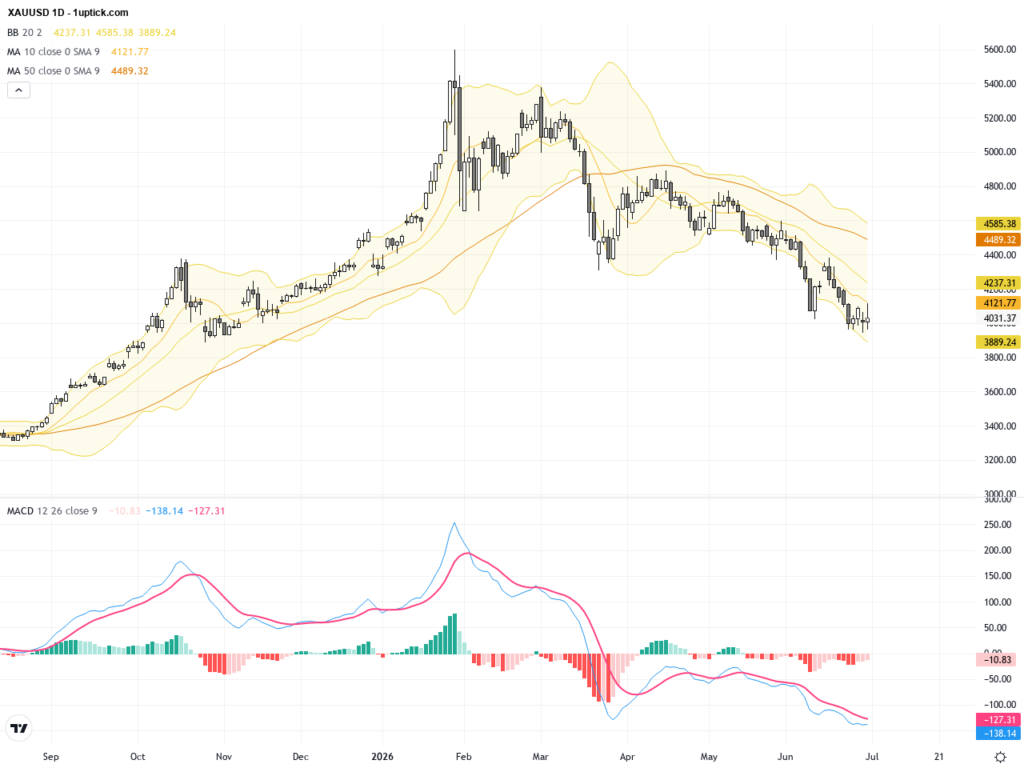
The daily chart shows XAUUSD peaking near 4325 in mid-June before entering a clear downtrend over the last two weeks. The price remains below key moving averages with Bollinger Bands contracting, indicating limited short-term volatility. MACD shows sustained bearish momentum with slight convergence, suggesting that while selling pressure continues, it may be easing.
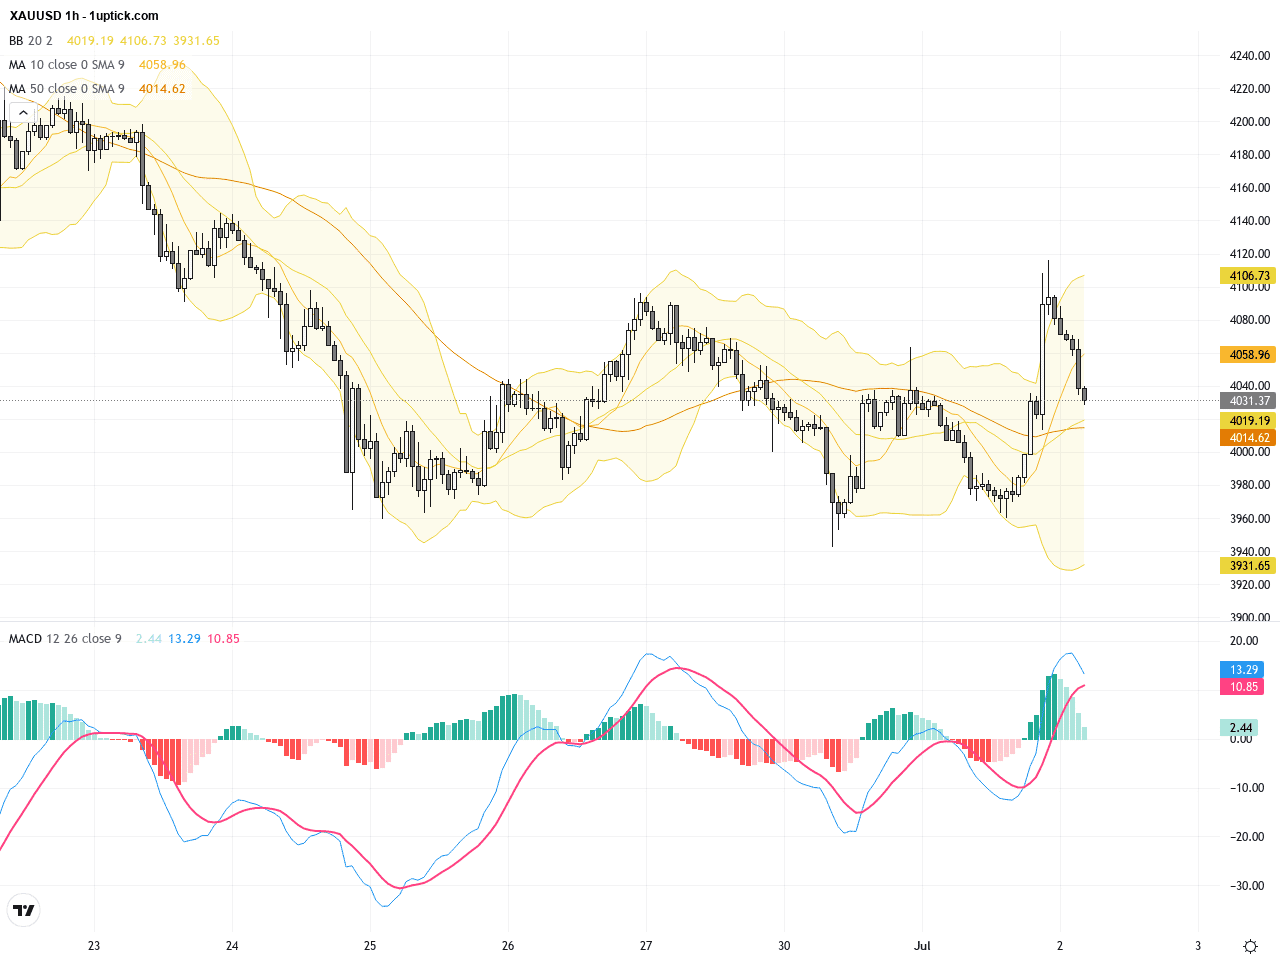
On the 3–5 day hourly chart, gold is consolidating in a tight range between 4020 and 4080, with moving averages showing no clear trend and narrow Bollinger Bands hinting at reduced volatility. MACD hovers around the zero line, suggesting balanced bullish and bearish forces, with the near-term direction likely dependent on catalyst news.
Technical Trend: The current trend of XAUUSD can be described as cautiously bearish with range-bound fluctuation, lacking a clear directional bias but slightly tilted towards downside risk.
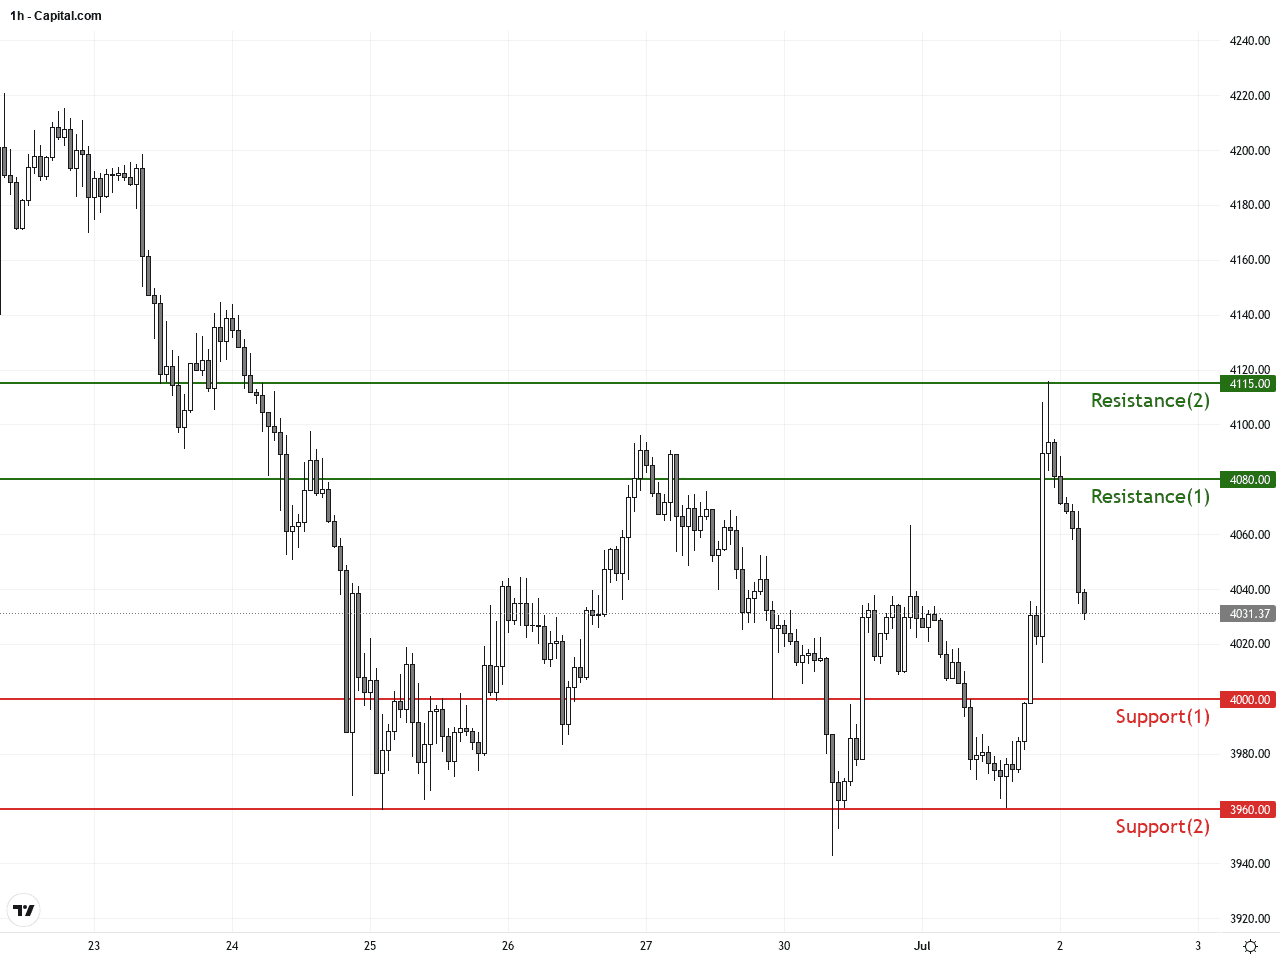
Technically, gold is testing the critical psychological support near $4000. A break below this level could expose the next support around $3960. Recent candlesticks show multiple small-bodied doji, signaling indecision in the market. MACD is showing early signs of a possible momentum shift, which hints at a potential short-term consolidation or minor rebound. Traders should watch for volume-backed breakouts to capture high-probability trend moves.Today’s economic calendar features Japan’s Q2 Tankan manufacturing and non-manufacturing indices surpassing expectations, which is unlikely to significantly impact XAUUSD as the USD/JPY correlation is indirect in this context. No major US economic data scheduled today directly affecting gold prices. Hence, gold’s movement will primarily be shaped by technical factors and geopolitical news.
Resistance & Support
The above financial market data, quotes, charts, statistics, exchange rates, news, research, analysis, buy or sell ratings, financial education, and other information are for reference only. Before making any trades based on this information, you should consult independent professional advice to verify pricing data or obtain more detailed market information. 1uptick.com should not be regarded as soliciting any subscriber or visitor to execute any trade. You are solely responsible for all of your own trading decisions.