



 |
| Gold V.1.3.1 signal Telegram Channel (English) |
USDJPY Eyes Volatile Moves Amid Suspected BoJ Intervention and Technical Resistance, July 6, 2026
2026-07-06 @ 11:01
Over the past 24 to 48 hours, the USDJPY market has seen significant volatility, with prices retreating from yesterday’s close at around 161.771. The pair peaked near 162.22 but then sharply corrected lower, reflecting heightened market reactions.
This volatility was primarily driven by rising market concerns over a possible Bank of Japan (BoJ) intervention in the foreign exchange market. Reports highlighted that the USDJPY sharply reversed after hitting its projected 5th-wave target zone, with speculation that BoJ intervened to support the weakening yen. This action pressured USDJPY, creating noticeable fluctuations for investors. Furthermore, recent weak US employment data have dampened the overall dollar strength, contributing indirectly to the dollar’s softness versus the yen.
For the average investor, this scenario is like a popular stock facing heavy sell-offs at its peak, causing a swift price correction. The Japanese authorities’ intervention aimed at preventing further yen depreciation against the dollar signals a shift from expectations of dollar strength to a more cautious stance. This serves as a reminder for investors that during major macroeconomic and policy changes, even major currency pairs can reverse course abruptly, highlighting the need for alertness and strategy adjustments.
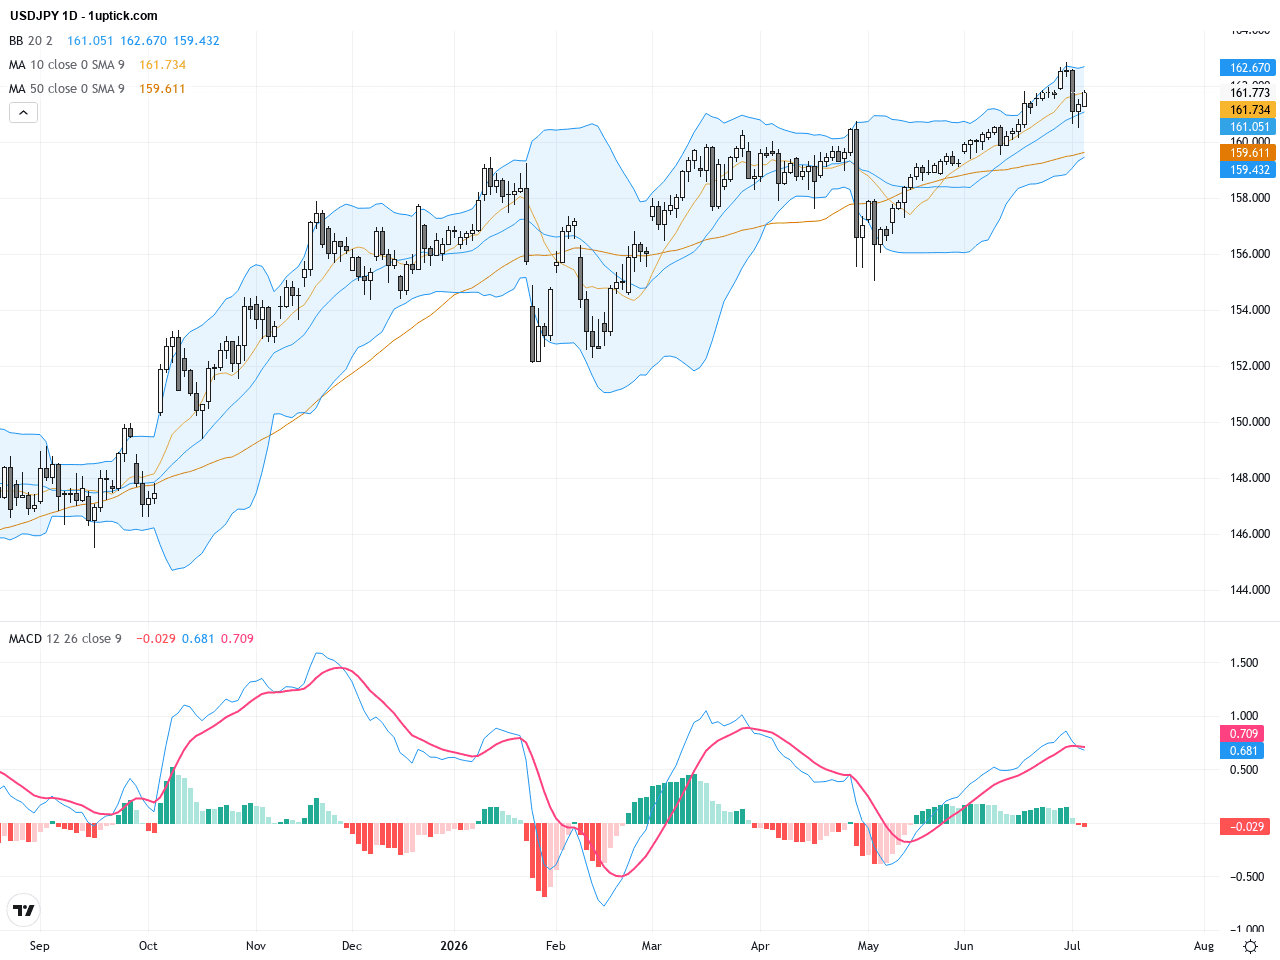
The daily chart depicts a strong upward trend culminating near the 162.83 yearly high, after which USDJPY sharply corrected. The 50 and 200-day moving averages remain bullishly aligned, supporting the longer-term uptrend. However, price has pulled back from the upper Bollinger Band, signaling short-term resistance. Meanwhile, the MACD shows signs of bearish divergence as momentum stalls, suggesting caution for bulls.
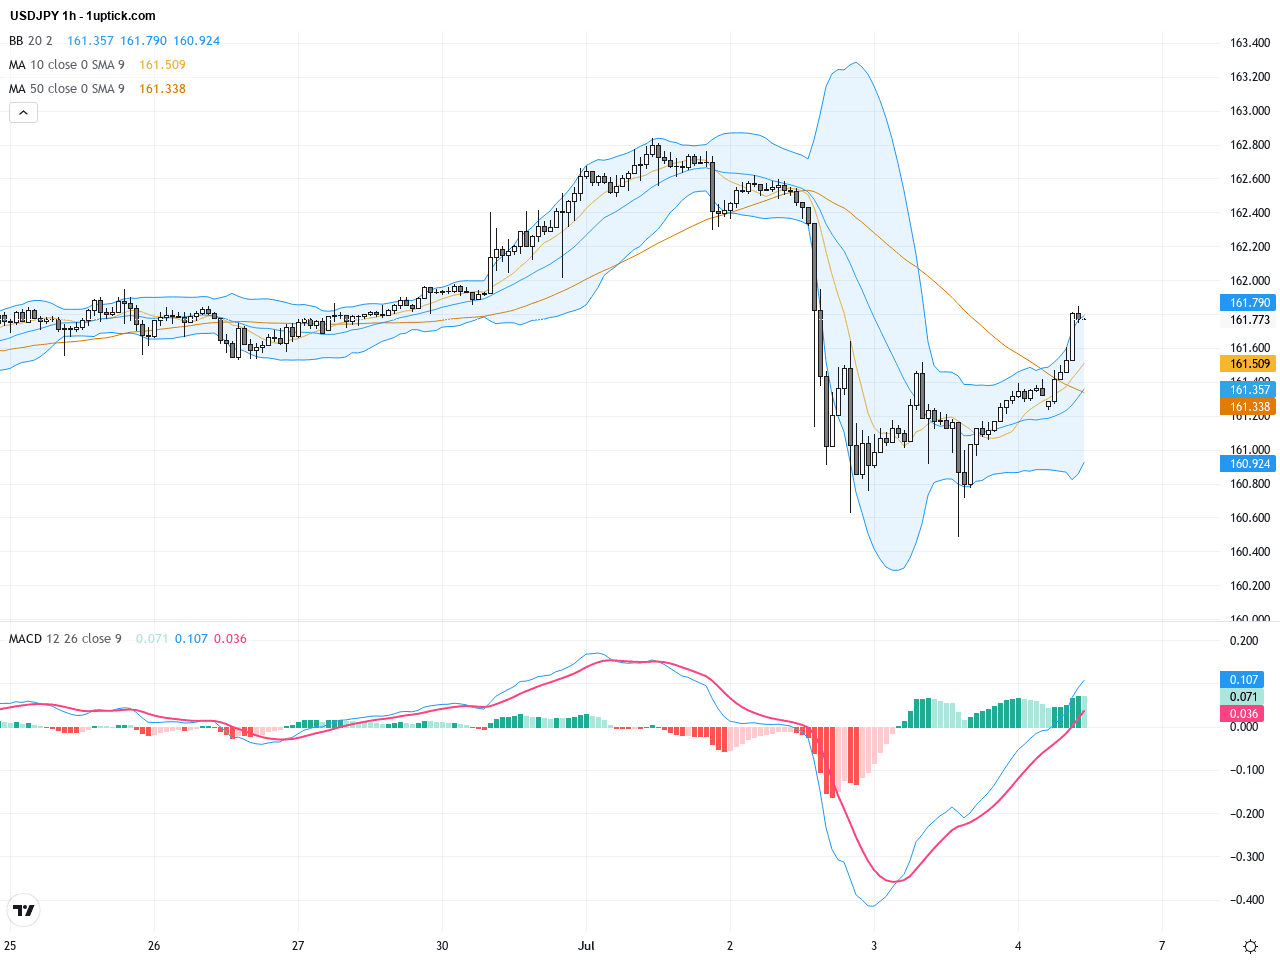
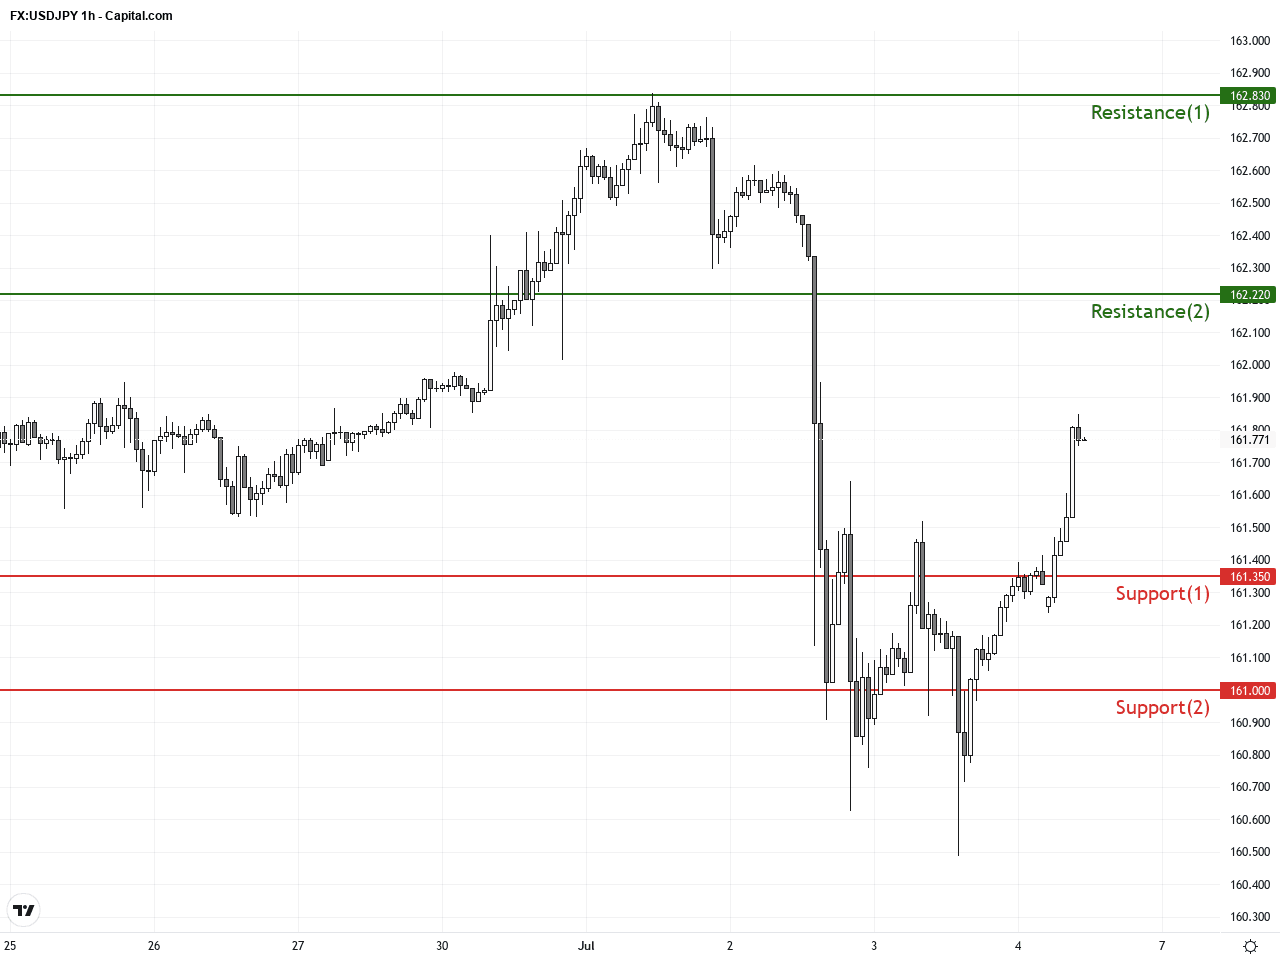
Hourly chart analysis over the last 3–5 days reveals increased volatility and a notable break below short-term moving average support. The Bollinger Bands show a squeeze followed by a downward breakout, and the MACD has formed a bearish crossover near the zero line. A potential Head & Shoulders pattern is forming near 161.9, indicating a probable downside extension in the coming hours.
Technical Trend: The current trend is cautiously bearish in the short term, with an underlying bullish structure longer term.
Technical signals point to a critical juncture: the daily time frame favors bulls but with fading momentum, while the hourly chart suggests short-term bearish pressure building. Traders should monitor the support zone between 161.3 and 161.5 closely; breaching this may trigger accelerated downside moves, especially amid risk of BoJ intervention.No significant or direct economic events relevant to USDJPY are scheduled today in the GMT+1 timezone. As such, recent price action is largely driven by policy speculation and geopolitical factors rather than fresh economic data.
Resistance & Support
The above financial market data, quotes, charts, statistics, exchange rates, news, research, analysis, buy or sell ratings, financial education, and other information are for reference only. Before making any trades based on this information, you should consult independent professional advice to verify pricing data or obtain more detailed market information. 1uptick.com should not be regarded as soliciting any subscriber or visitor to execute any trade. You are solely responsible for all of your own trading decisions.