









 |
| Gold V.1.3.1 signal Telegram Channel (English) |
WTI Crude Oil: Triangular Consolidation Signals a Strong Trading Outlook, July 7, 2026
2026-07-07 @ 06:03
Over the past 24 to 48 hours, WTI crude oil prices have remained relatively stable with slight fluctuations. The closing price on July 6, 2026, was $68.55 per barrel, showing a slight decrease from the previous trading day, reflecting a market in hesitation amid multiple dynamic developments.
Recent market news highlighted that despite Saudi Arabia’s cut of August crude prices for Asia and OPEC+’s ongoing increase in production targets, oil prices have remained largely unchanged around pre-conflict levels. The recovery of exports via the Strait of Hormuz also contributed to increased supply pressure, weighing on prices. Meanwhile, energy stocks saw some uplift as the tech sector rallied, yet overall crude prices stayed cautious. This tug-of-war between supply and demand explains the recent steadiness but lack of a clear directional move in WTI prices.
For the average investor, this scenario is akin to a ship navigating turbulent seas — with OPEC+ boosting output and geopolitical factors in play, the vessel moves steadily but encounters ongoing waves. Investors should closely monitor supply changes and geopolitical developments to anticipate potential shifts in oil price trends.
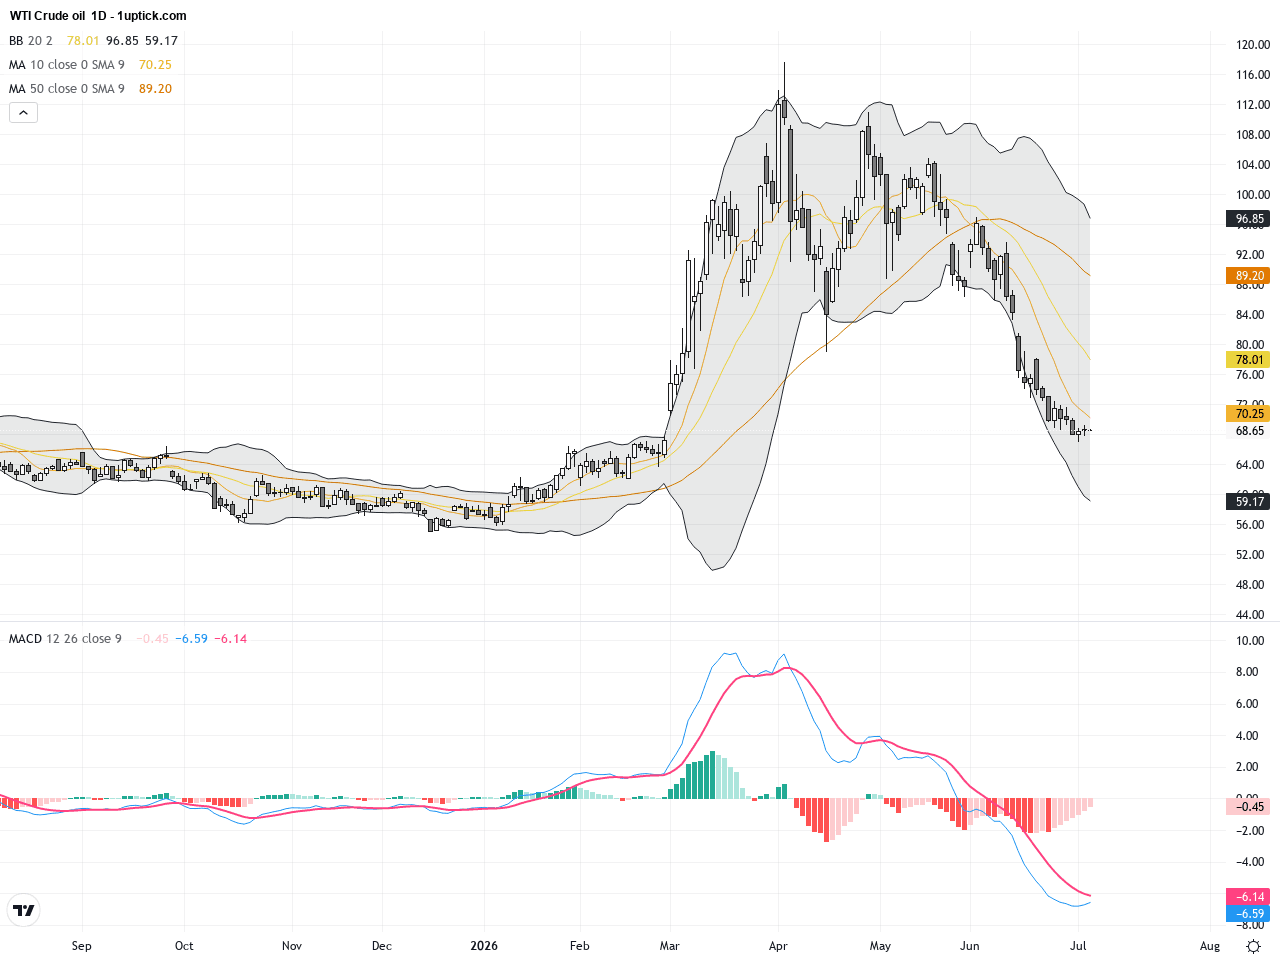
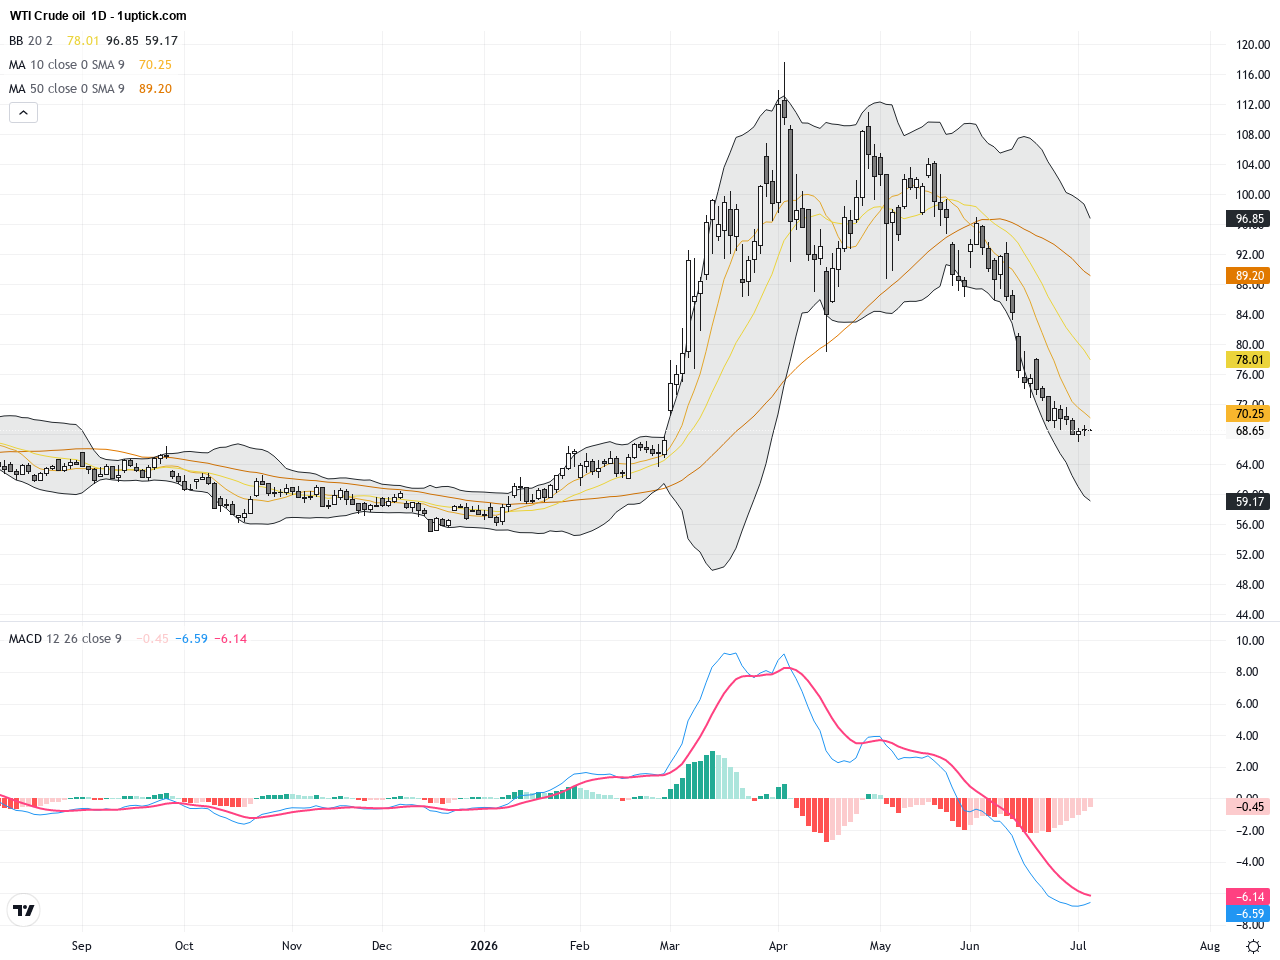
The daily chart of WTI Crude Oil reveals a classic triangular consolidation pattern forming since late June, following a decline from the mid-June highs near $80 to the current range around $68.5. This pattern indicates a compression of price volatility and a balance between buyers and sellers. Key technical indicators such as the 50-day and 200-day moving averages are converging, and the MACD shows sideways movement, reflecting a lack of a definitive trend. The narrowing Bollinger Bands further corroborate reduced volatility, implying an imminent breakout is likely.
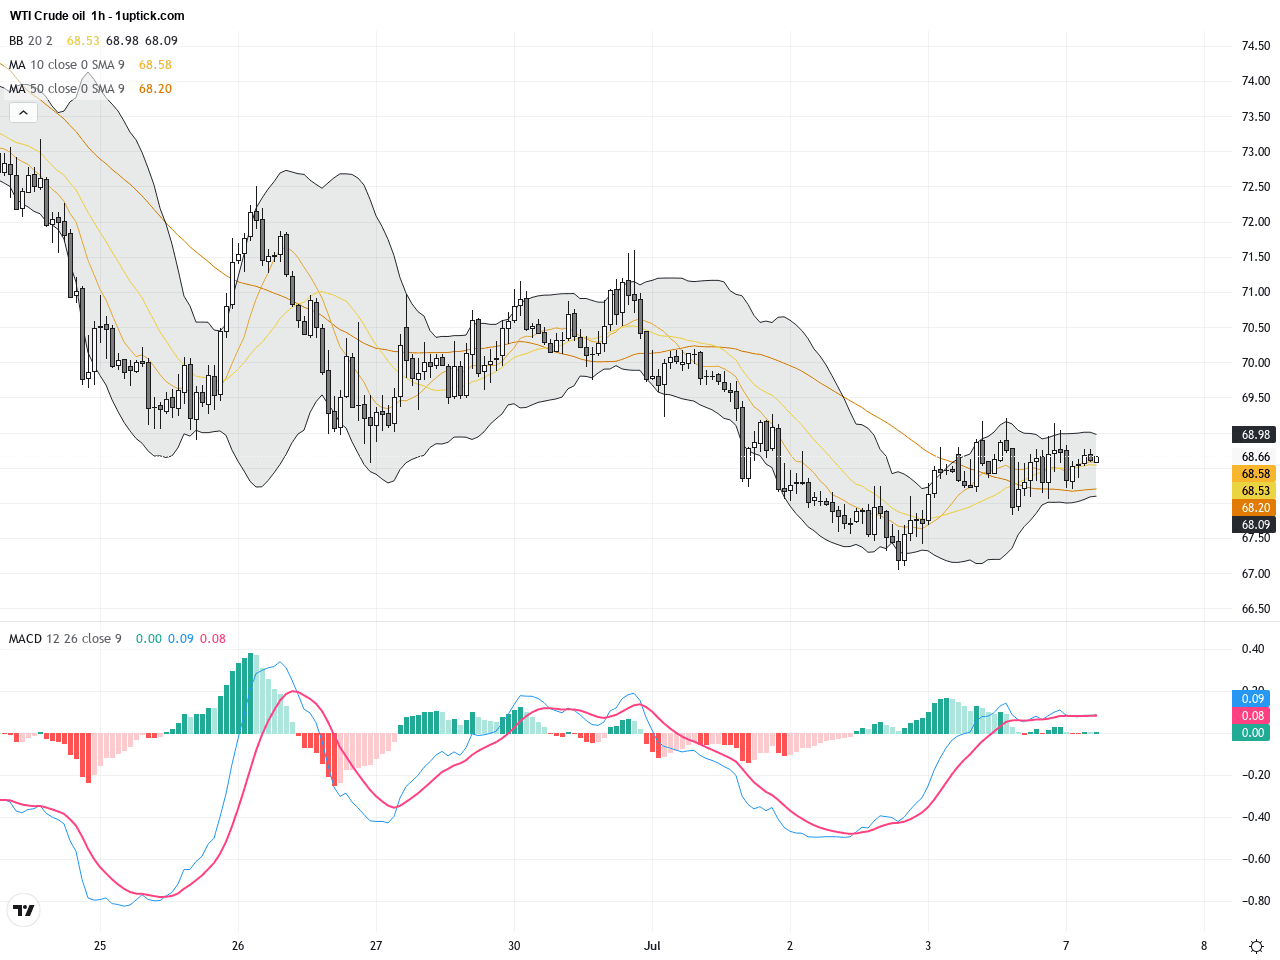
The hourly chart over the last five days displays WTI prices repeatedly testing the middle Bollinger Band as support, consolidating around this key level. The MACD hovers above zero but declines in momentum, while the RSI remains between 45 and 55, signaling uncertain short-term momentum. A recent engulfing candlestick pattern suggests a possible short-term reversal, but confirmation through volume is needed. Overall, the intraday picture remains in a tight trading range awaiting a catalyst.
Technical Trend: WTI Crude Oil is currently in a cautious consolidation phase, with reduced volatility and a pattern signaling an imminent breakout.
Technically, WTI Crude Oil is forming a triangular consolidation with a recent engulfing candle alerting traders to an inflection point. Momentum indicators like the MACD and RSI oscillate within neutral zones, signifying the necessity for a volume-supported breakout to confirm direction. A break above the upper boundary of the triangle signals bullish momentum return, while a drop below support points to further correction risks. Market news focusing on Saudi pricing and OPEC+ output decisions remain critical catalysts.There are no significant or directly relevant economic events scheduled today impacting WTI Crude Oil. Market participants will continue to monitor geopolitical developments and OPEC+ supply policies. Key U.S. energy reports may influence prices later in the week, but no immediate data-driven volatility is anticipated today.
Resistance & Support
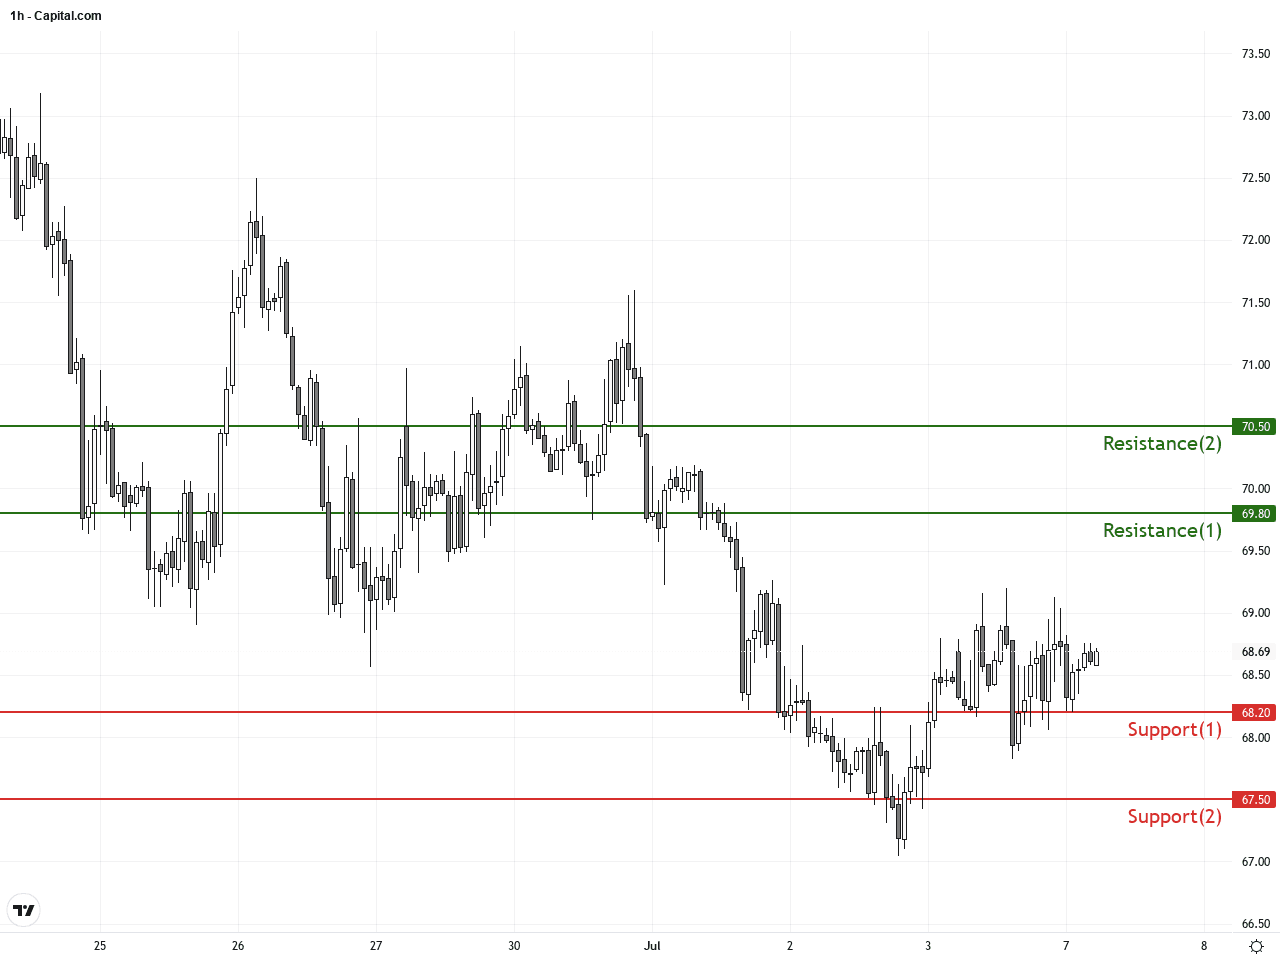
Run Live WTI Crude Oil Analysis
The above financial market data, quotes, charts, statistics, exchange rates, news, research, analysis, buy or sell ratings, financial education, and other information are for reference only. Before making any trades based on this information, you should consult independent professional advice to verify pricing data or obtain more detailed market information. 1uptick.com should not be regarded as soliciting any subscriber or visitor to execute any trade. You are solely responsible for all of your own trading decisions.