

 |
| Gold V.1.3.1 signal Telegram Channel (English) |
EURUSD: Key Technical Patterns Signal Critical Support Break Could Propel Price Higher, July 10, 2026
2026-07-10 @ 09:01
Over the past 24 to 48 hours, the EUR/USD pair experienced mild fluctuations, trading around the 1.144 level, with yesterday’s closing price at 1.144. Despite escalating geopolitical tensions in the Middle East, the US Dollar Index (DXY) unexpectedly weakened, providing some upside support for the EUR/USD, which reached an intraday high near 1.1444 and a low around 1.1431.
Recent Federal Open Market Committee (FOMC) minutes revealed increasing policy divergence and a fading expectation for further rate hikes, weighing on the US dollar and helping push EUR/USD higher. Additionally, US June payroll data showed a sharp slowdown in job additions while unemployment slightly declined, highlighting subtle discrepancies in the labor market and adding uncertainty around Fed policy, which put additional pressure on the dollar.
For the average investor, this means that rising geopolitical risks combined with mixed US economic signals have dampened the dollar’s safe-haven appeal, allowing the euro to gain ground. In simple terms, it’s like a key player on a sports team underperforming, affecting the team’s overall strength — currently, the dollar faces similar challenges, while the euro is seizing the opportunity to strengthen.
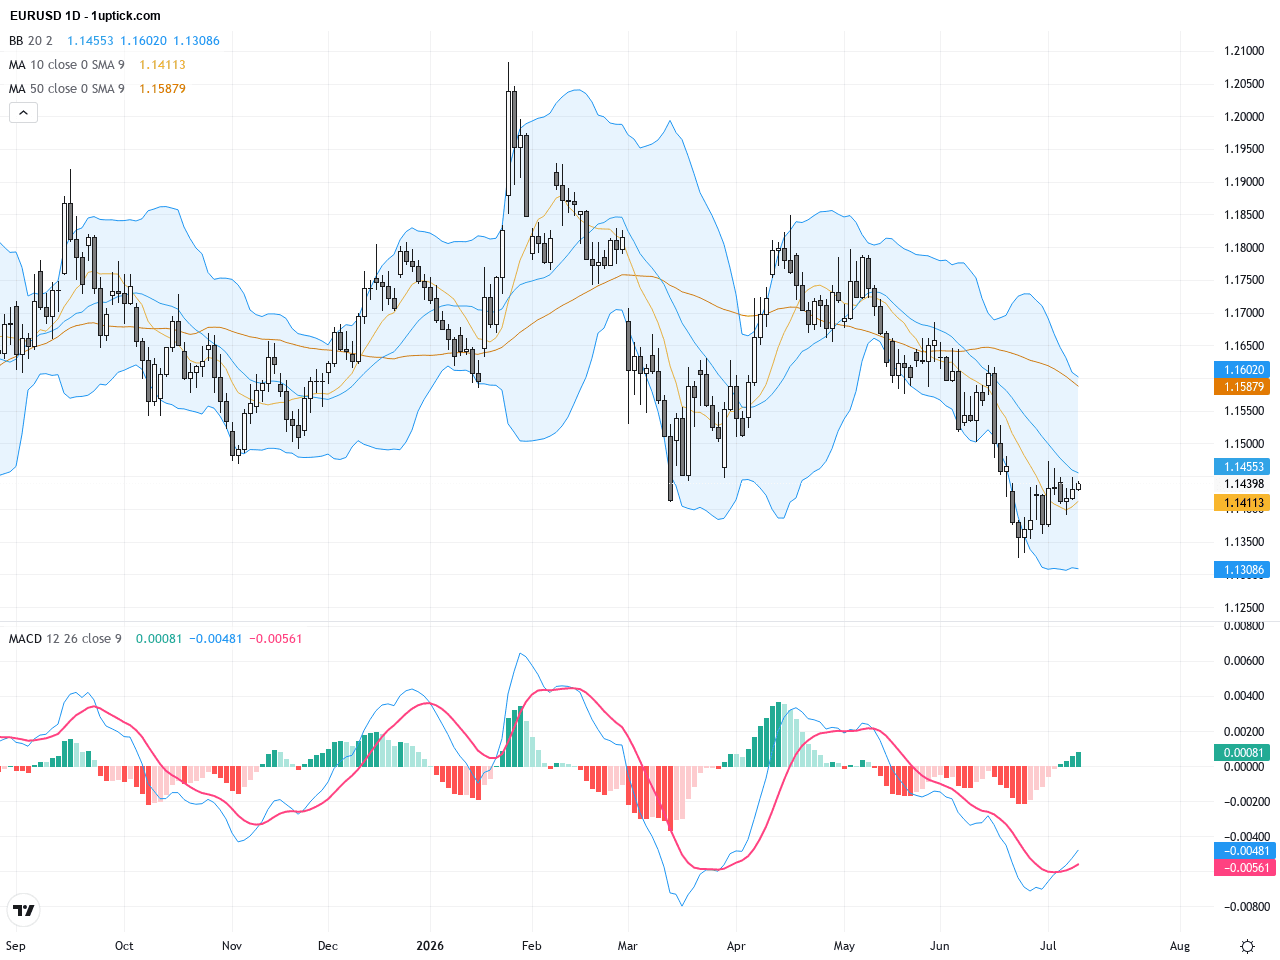
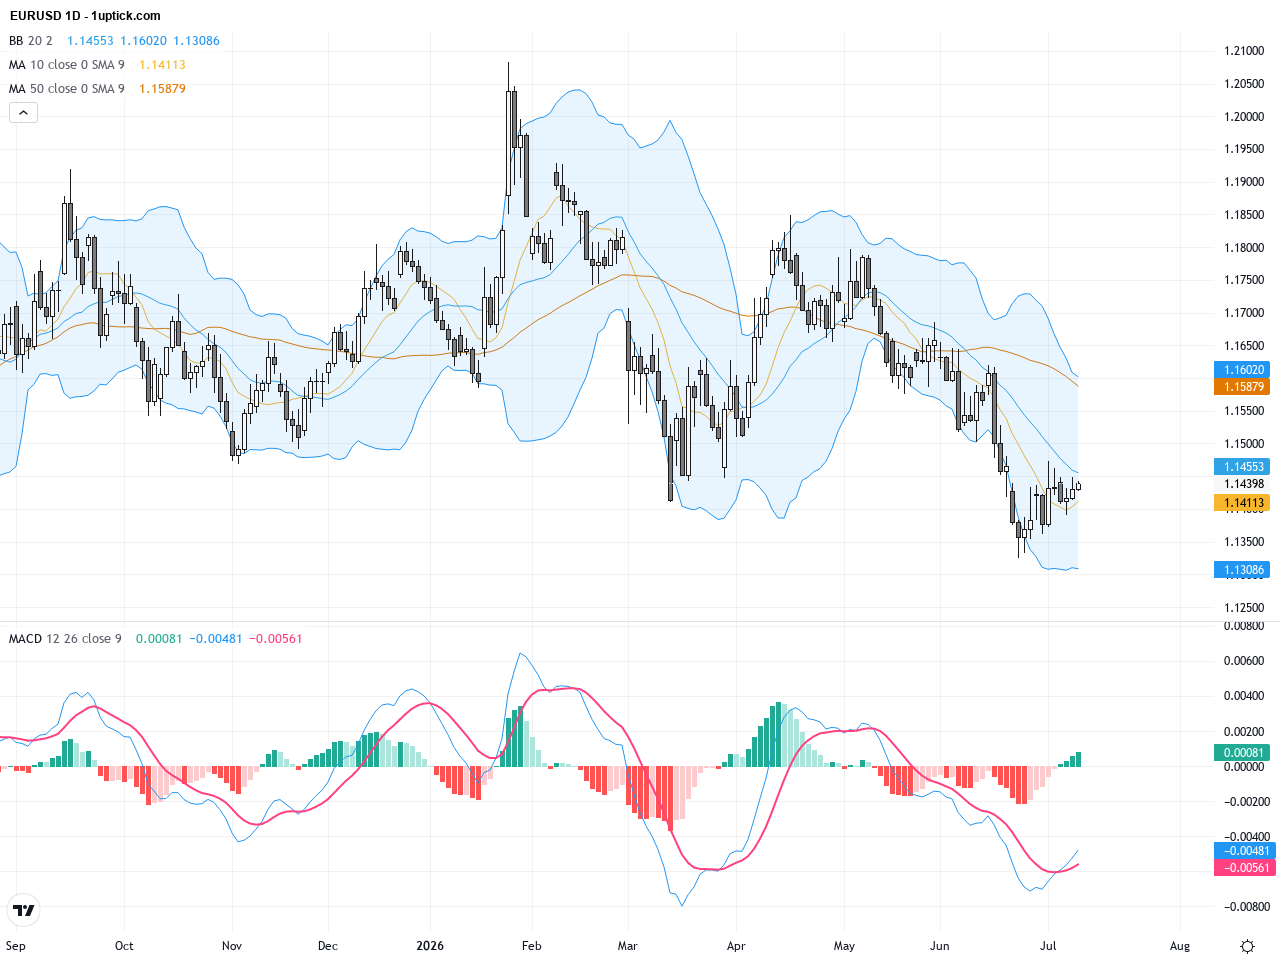
The daily chart shows EURUSD in a moderate uptrend since mid-June, yet facing resistance near the 200-day moving average (~1.165) and 50-day average (~1.158). Bollinger Bands are contracting, with price oscillating between 1.138 and 1.155, indicating indecision. The MACD is improving slightly but has yet to form a clear bullish crossover, suggesting traders should monitor for momentum shifts closely.
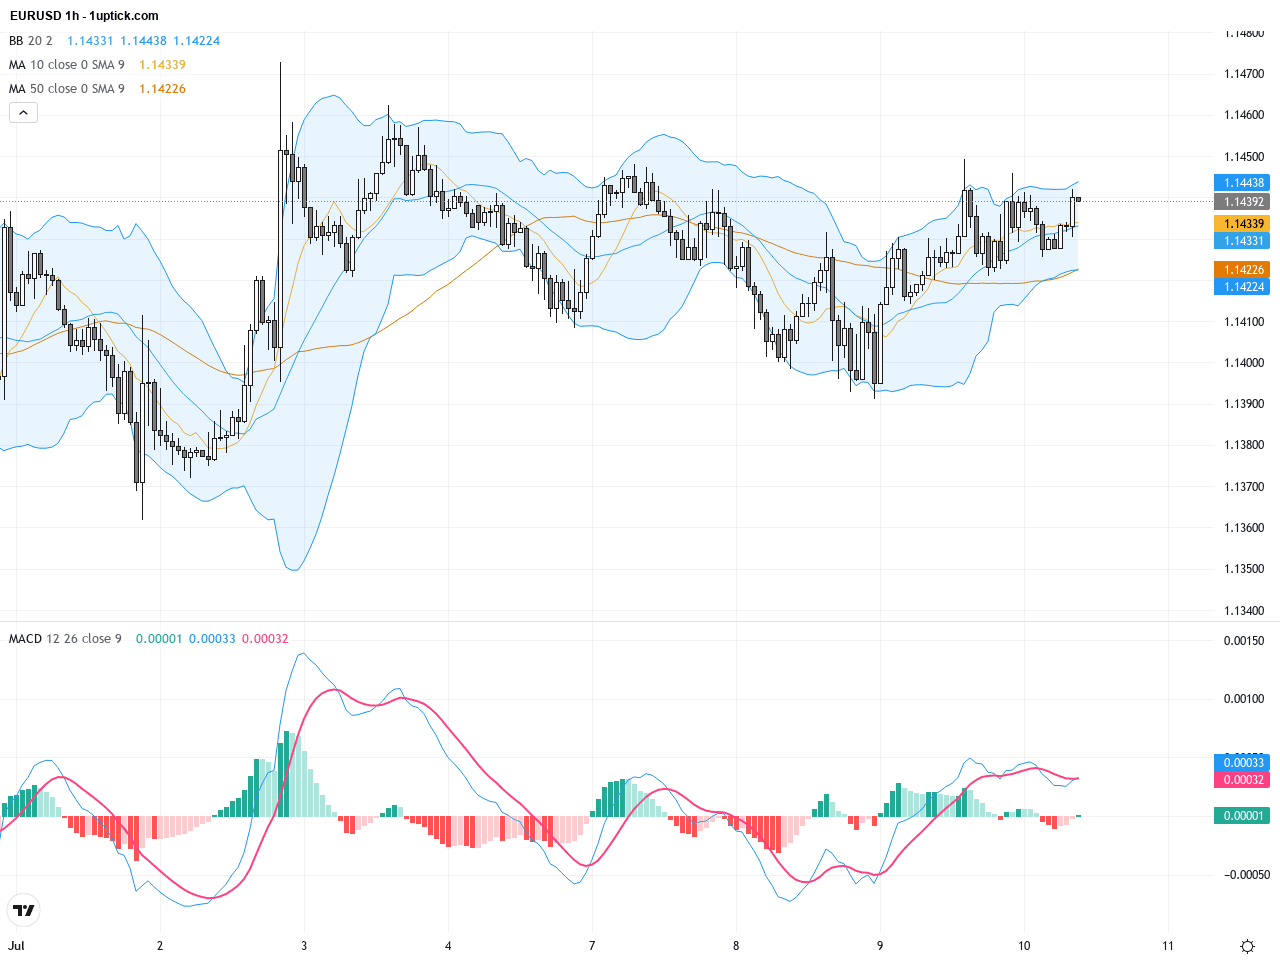
On the hourly chart, EURUSD has displayed heightened volatility over the past 3-5 days, consolidating within the 1.140 to 1.146 range. Price is rebounding near short-term moving averages, Bollinger Bands are widening, signaling increased volatility. A recent MACD bullish divergence alongside a bullish engulfing candlestick pattern indicates potential upward momentum over the next 24 hours, with a key resistance test at 1.146.
Technical Trend: EURUSD currently exhibits a cautiously bullish trend, with short-term sideways volatility within a broader mild uptrend.
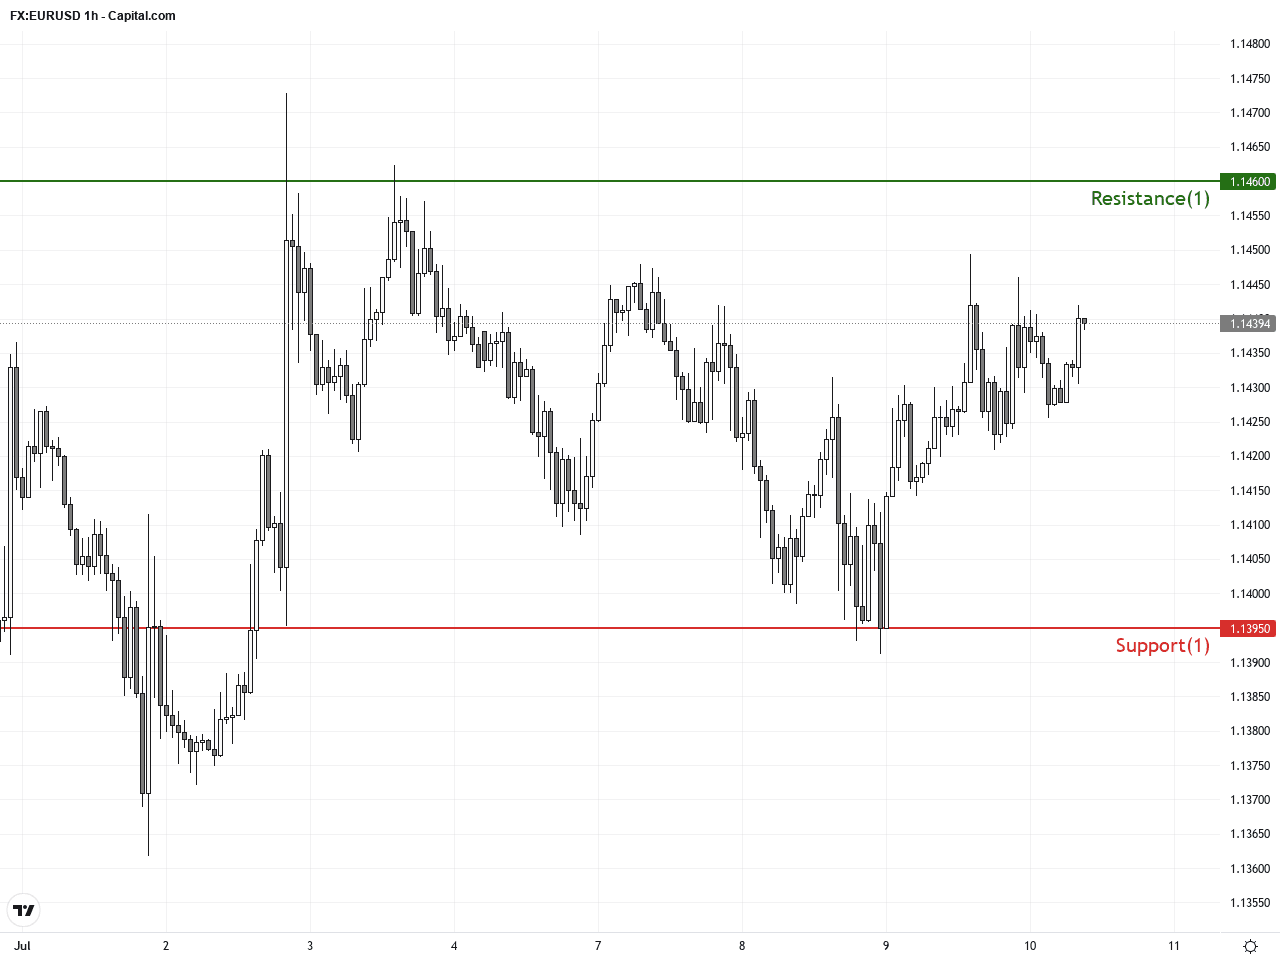
Technically, EURUSD is forming multiple patterns concurrently, including a consolidative range and a potential bullish flag. The daily Bollinger Bands contraction signals the market is poised for a directional move, but the MACD has not yet signaled a strong buy, suggesting momentum buildup. Hourly chart indicators such as bullish divergence and engulfing candle point to short-term strength, making the key 1.146 resistance the pivot for breakout confirmation towards 1.1525 or beyond.Today’s economic calendar centers on German data releases including May’s trade balance, exports, and imports—all beating expectations and implying economic strength in the Eurozone. Additionally, Czech Republic and Slovakia report industrial production figures signaling varied but important regional trends. The key event is the ECB minutes release at 13:30 GMT+1, which could heavily sway EURUSD momentum. Hawkish tones might pressure the euro, while dovish content could bolster it. Overall, today’s European economic events carry high relevance for EURUSD traders, warranting close attention to market reactions post-release.
Resistance & Support
The above financial market data, quotes, charts, statistics, exchange rates, news, research, analysis, buy or sell ratings, financial education, and other information are for reference only. Before making any trades based on this information, you should consult independent professional advice to verify pricing data or obtain more detailed market information. 1uptick.com should not be regarded as soliciting any subscriber or visitor to execute any trade. You are solely responsible for all of your own trading decisions.