

 |
| Gold V.1.3.1 signal Telegram Channel (English) |
GBPUSD Technical Analysis: Break Above 1.3400 Resistance as BoE Rate Hike Hopes Boost Pound, July 10, 2026
2026-07-10 @ 13:01
Over the past 24 to 48 hours, GBP/USD hovered near the 1.34 level with some volatility. On Thursday, the British Pound managed to break above the key resistance at 1.3410, reaching its highest point in almost three weeks. This upward momentum was supported by growing market expectations of further Bank of England rate hikes. Meanwhile, the US Dollar remained firm, buoyed by the Federal Reserve’s (FOMC) minutes which revealed policy divergence, maintaining the dollar’s safe-haven appeal and keeping the DXY index stable or slightly higher.
Additionally, renewed US-Iran tensions pushed investors towards the safety of the dollar, slightly boosting its strength. However, relief over reduced UK political risks — notably Burnham’s reaffirmation of fiscal rules — gave the Pound some lift, resulting in a tug-of-war between the two currencies. The pair closed yesterday at 1.34306, up slightly from the previous day’s 1.34078, reflecting ongoing market battles amid geopolitical and monetary policy uncertainties.
For the average investor, this period’s fluctuations reflect the Pound gaining traction on the back of BoE rate hike optimism, while the Dollar’s moves are dictated by Fed policy divides and international tensions. Those looking to seize short-term opportunities should closely monitor forthcoming policy updates and geopolitical developments, as these will directly impact GBP/USD direction.
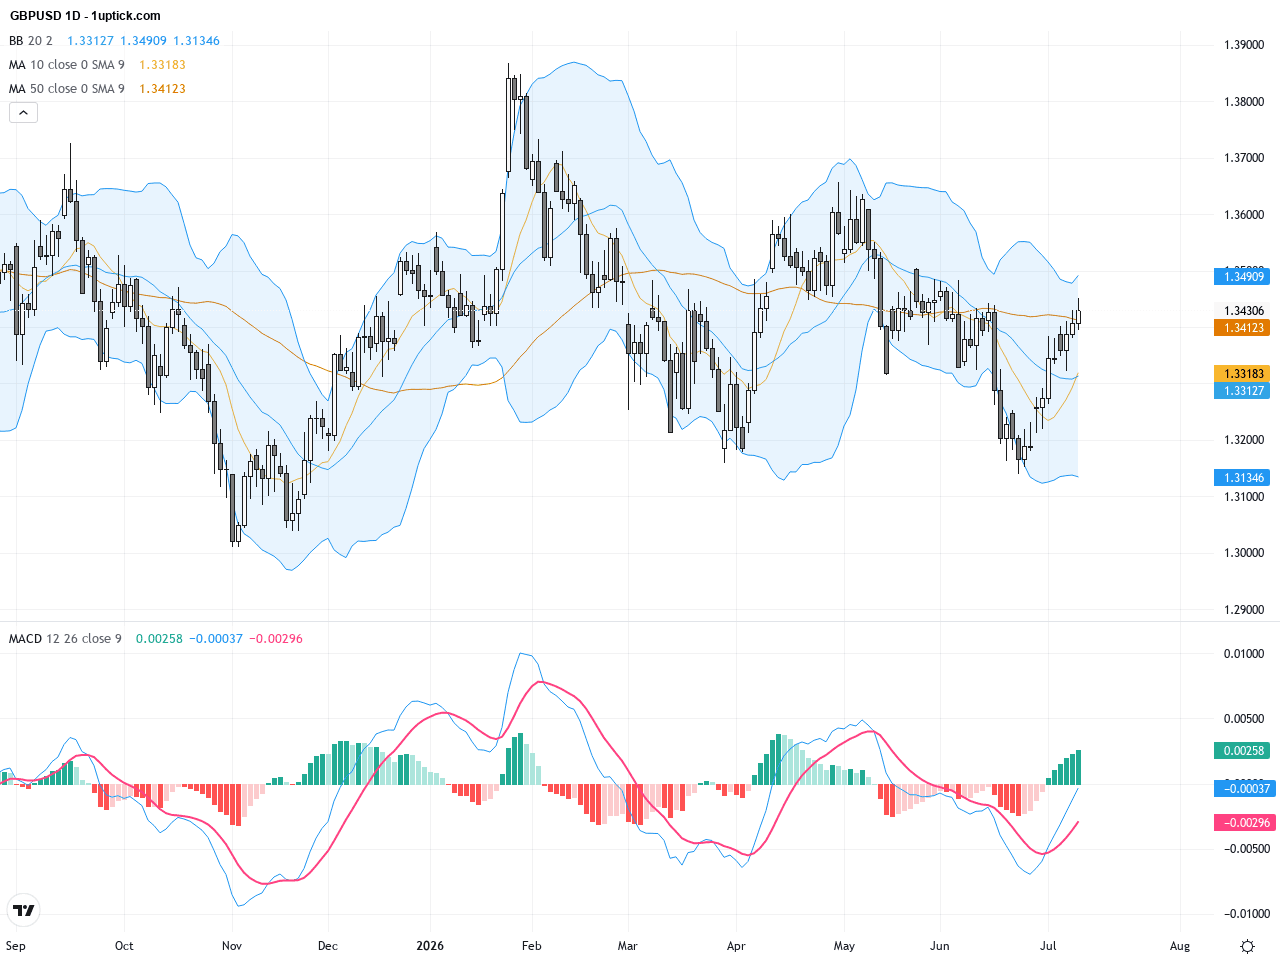
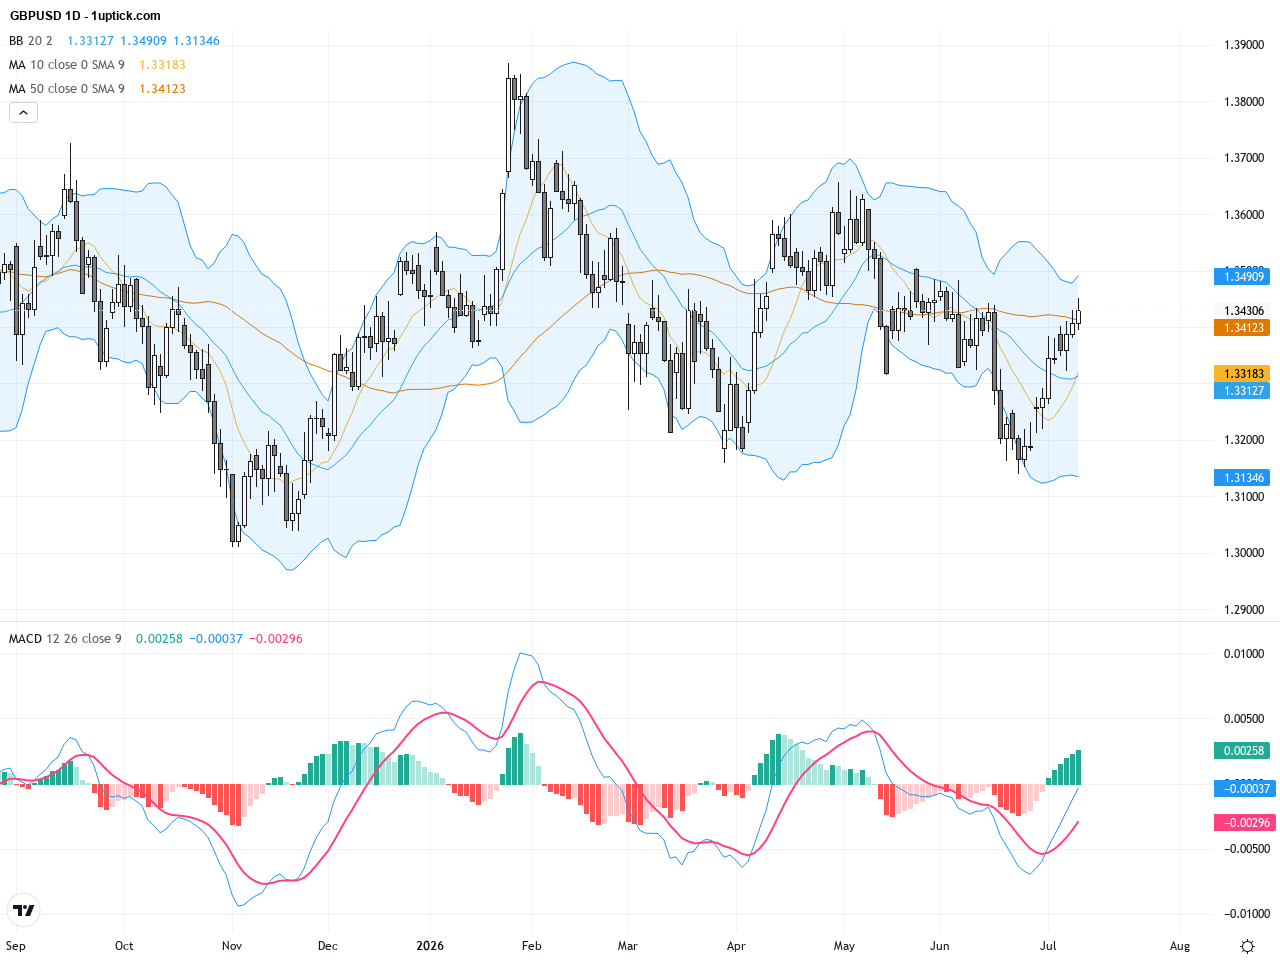
The GBPUSD daily chart shows a clear uptrend from around 1.3100, breaking above key moving averages including the 50-day MA (~1.3362) and the 200-day MA (1.34174), signaling sustained bullish momentum. Bollinger Bands are expanding, indicating increased volatility. The MACD remains above zero with a strong bullish crossover, supporting upward momentum. The longer-term trend confirms gains since late June, reflecting a positive fundamental and technical alignment.
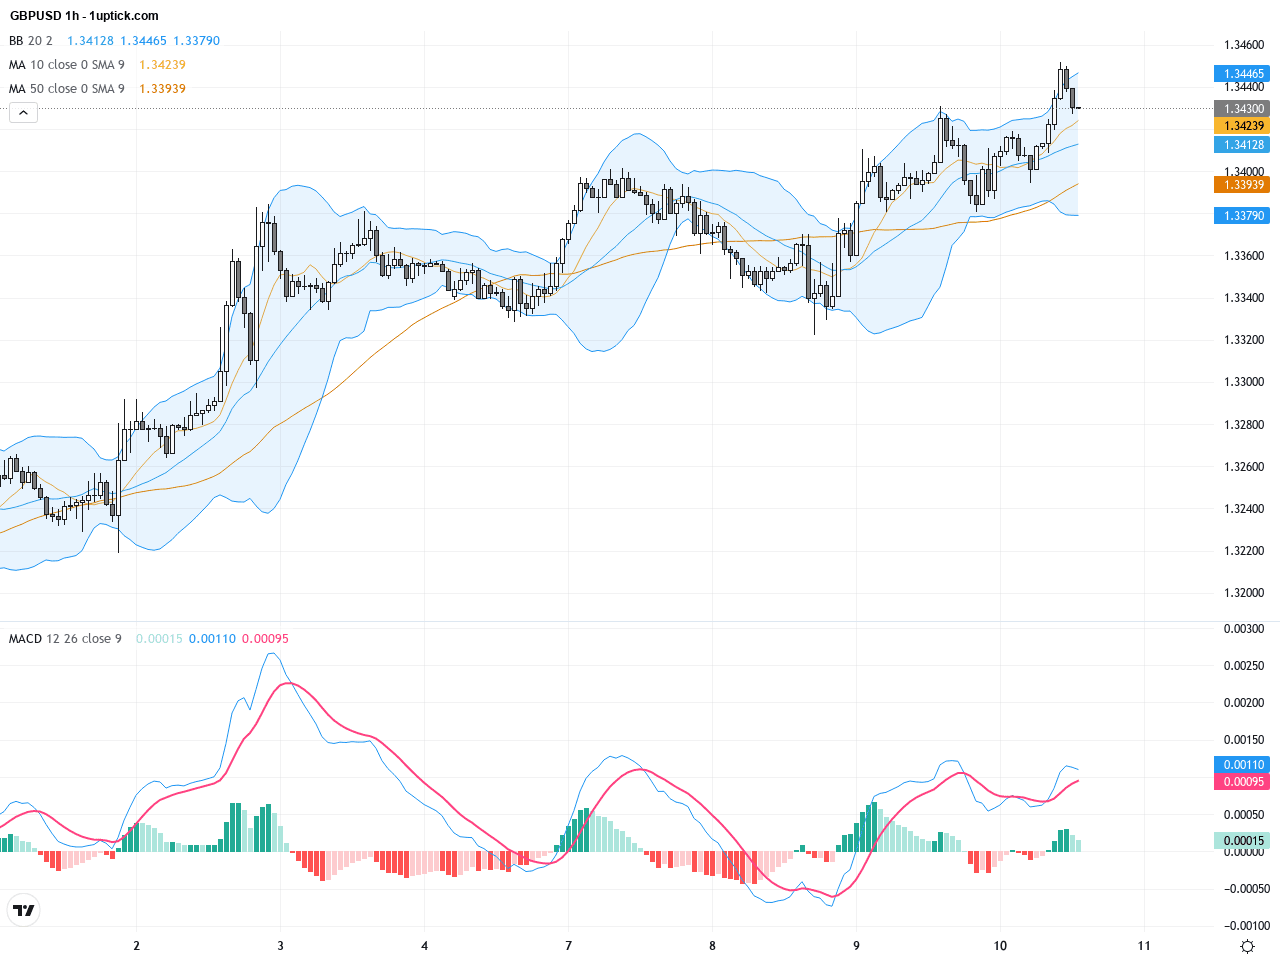
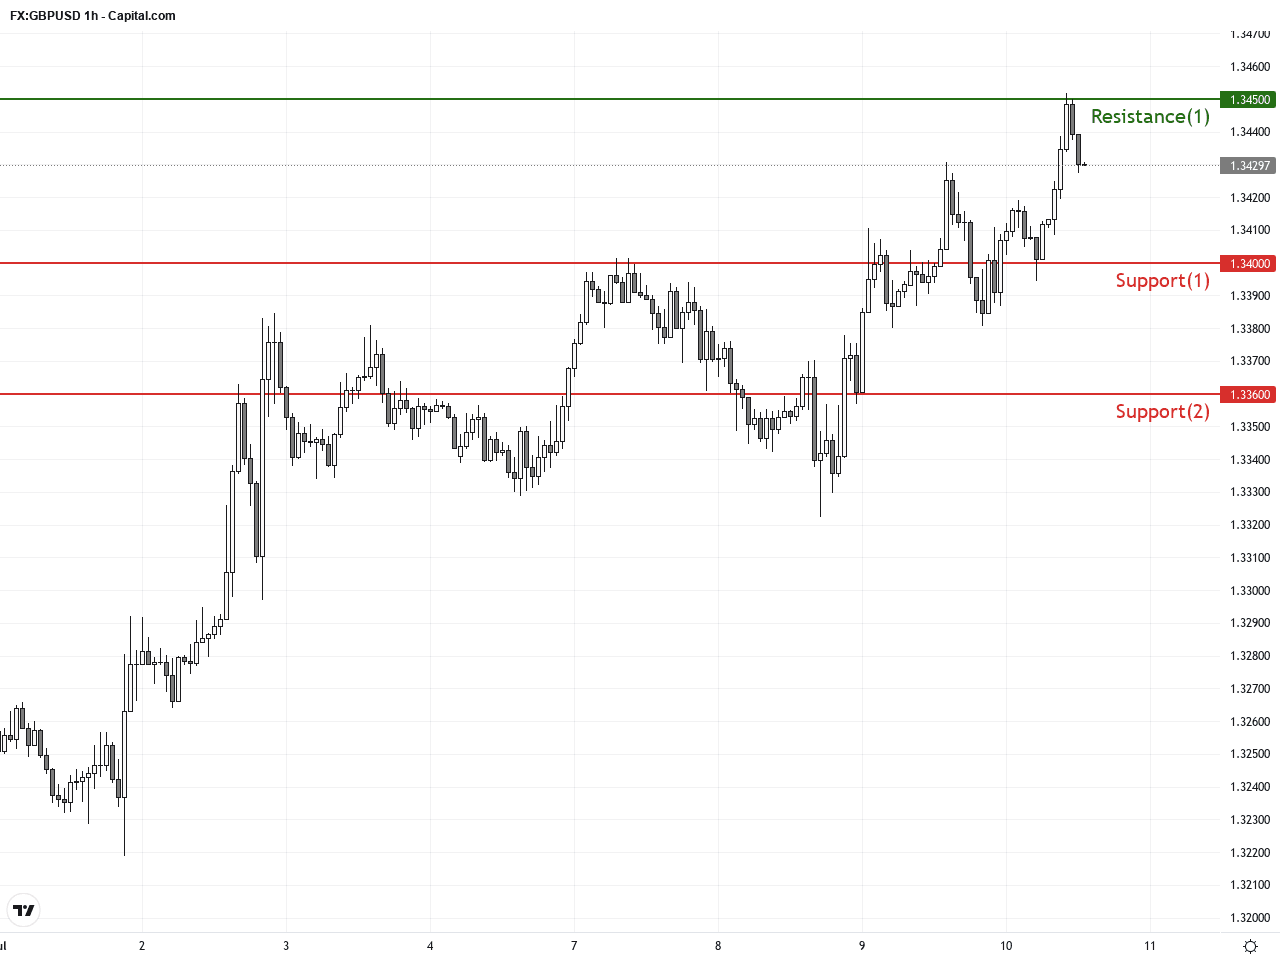
On the hourly chart, GBPUSD has formed a gradual ascending wedge over the last 3-5 days, testing resistance between 1.3400 and 1.3450. Short-term moving averages (20 and 50) remain bullishly aligned. Bollinger Bands tightened before expanding again, suggesting a potential breakout. The MACD shows upward momentum recovery within the day, encouraging short-term buying. A flag-like consolidation pattern suggests a breakout above resistance could propel prices toward 1.3500.
Technical Trend: Trend Direction: Steady Bullish
GBPUSD demonstrates a strong technical breakout, especially having surpassed the 200-day moving average, confirming a bullish trend. Daily MACD bullish cross signals sustained momentum, while the hourly consolidation pattern points to an impending breakout. Current consolidation above 1.3400 supports continued bullish sentiment, but traders should stay alert to Fed policy developments and geopolitical tensions as potential volatility triggers.Today’s economic calendar has no direct major events affecting GBPUSD. Focus remains on the US Federal Reserve’s monetary policy report and some Nordic producer price and industrial production data. Given the stable expectations, the impact on GBPUSD is likely neutral today. However, if the Fed report leans hawkish, the USD could strengthen, putting pressure on GBP; otherwise, the Pound may benefit.
Resistance & Support
The above financial market data, quotes, charts, statistics, exchange rates, news, research, analysis, buy or sell ratings, financial education, and other information are for reference only. Before making any trades based on this information, you should consult independent professional advice to verify pricing data or obtain more detailed market information. 1uptick.com should not be regarded as soliciting any subscriber or visitor to execute any trade. You are solely responsible for all of your own trading decisions.