

 |
| Gold V.1.3.1 signal Telegram Channel (English) |
USDJPY Eyes Critical Resistance Near 162 as Technical Patterns Suggest Bullish Momentum, July 10, 2026
2026-07-10 @ 11:01
In the past 24 to 48 hours, the USD/JPY pair experienced significant volatility, pulling back from four-decade highs near 162.83 to around 162.38. On Thursday, the U.S. dollar softened amid a rally in stock markets and retreat in crude oil prices, exerting downward pressure on the greenback. Compared to yesterday’s closing price of 162.356, USD/JPY ended lower near 161.45. The decline was partly driven by Japan’s government intervention efforts to curb yen depreciation, with a record intervention totaling 11.73 trillion yen, yet market hesitation persisted.
Geopolitical tensions between the U.S. and Iran further heightened market uncertainty, prompting cautious investor positioning and adding volatility pressure on the dollar in Asian trading sessions. Meanwhile, strategic investors and hedge funds continued to build bullish dollar bets against the yen, keeping USD/JPY elevated even amidst short-term pullback pressures.
For the average investor, these price fluctuations highlight a scenario where careful monitoring of geopolitical developments and global economic data releases is crucial to spotting trading opportunities. The market news clearly illustrates that a strong stock market rally intertwined with Middle East tensions is shaping USD/JPY’s tug-of-war for a new equilibrium. Understanding this dynamic helps investors better navigate exchange rate shifts and the risks and opportunities in the forex markets.
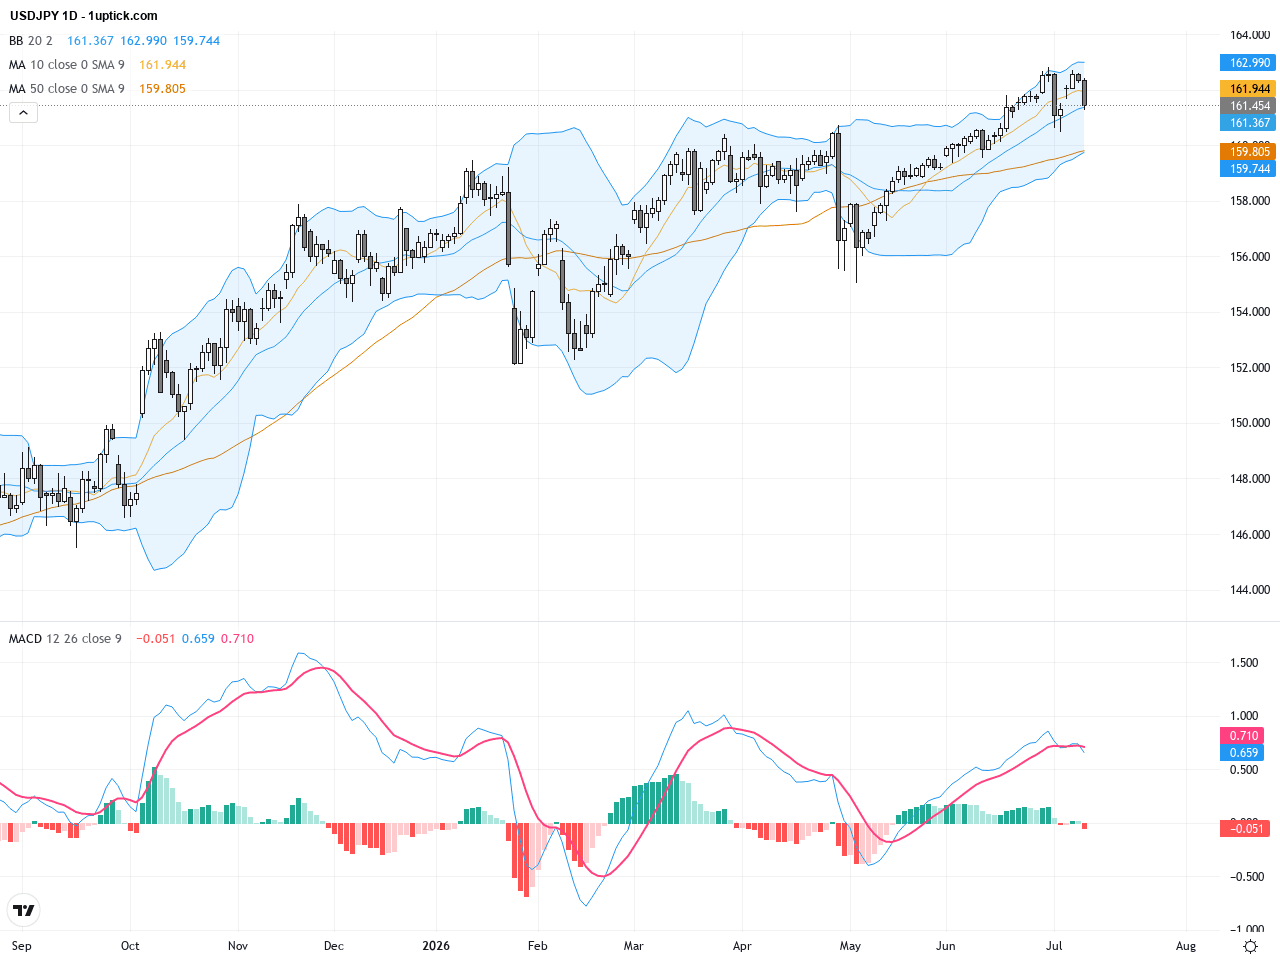
The USDJPY daily chart illustrates a strong upward trend since the start of the year, with price consistently breaking previous highs and now approaching the 162 resistance zone. Bollinger Bands are expanding upward signaling increased volatility. MACD remains above the zero line with the fast line rising, indicating strong bullish momentum. Both 50-day and 200-day moving averages are trending up with price above them, confirming a favorable medium to long-term trend for buyers.
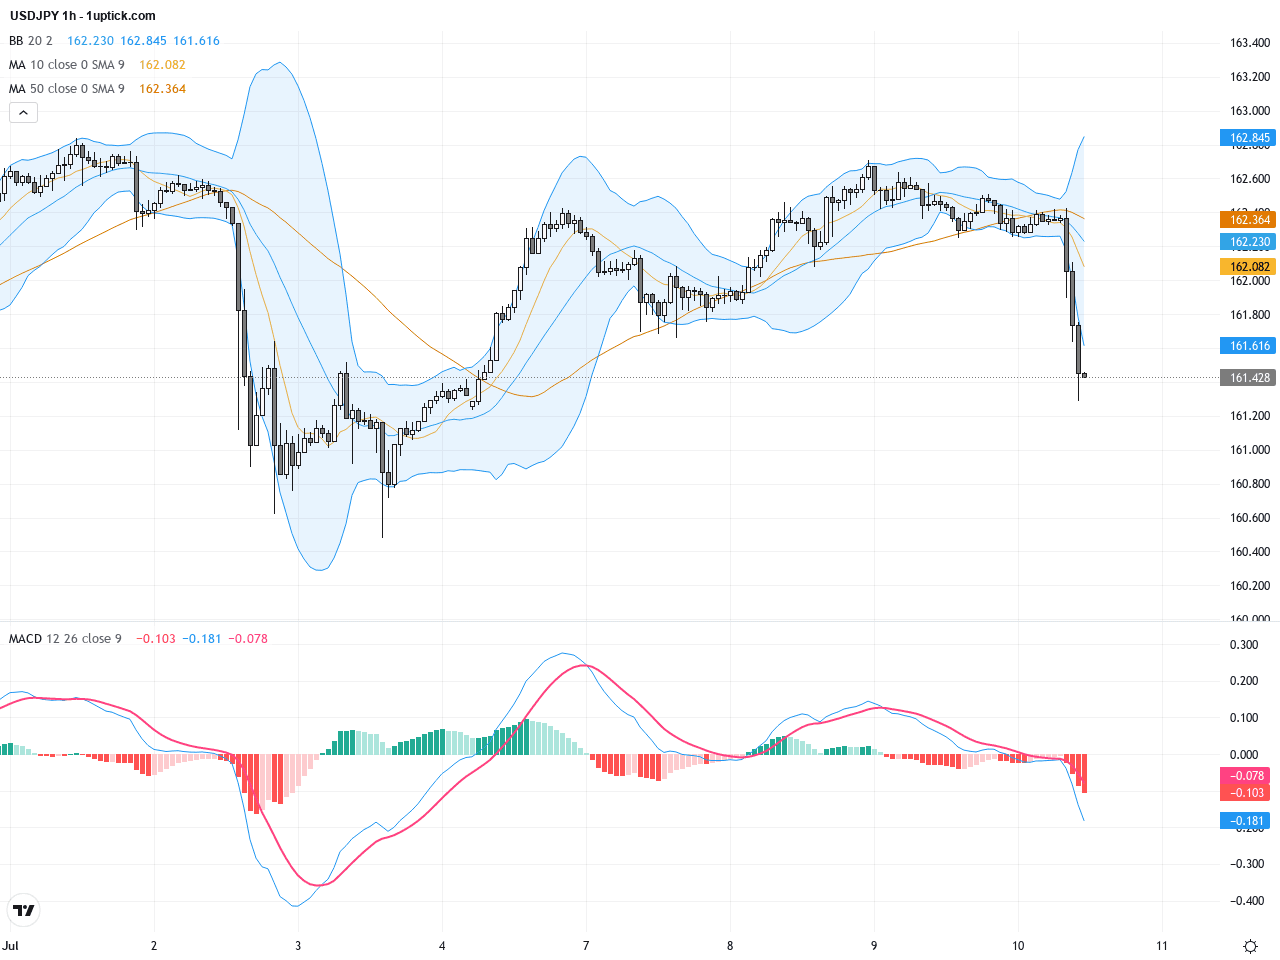
On the hourly chart over the past three to five days, USDJPY shows a consolidation with price oscillating between 161.3 and 162.4. The Bollinger Bands are narrowing, suggesting a short-term consolidation. The MACD lines are converging for a potential bullish crossover and RSI is near 70 without being overbought, signaling possible upward breakout soon. A flag pattern is forming, and a break above 162.5 could trigger a new bullish leg.
Technical Trend: Cautiously Bullish
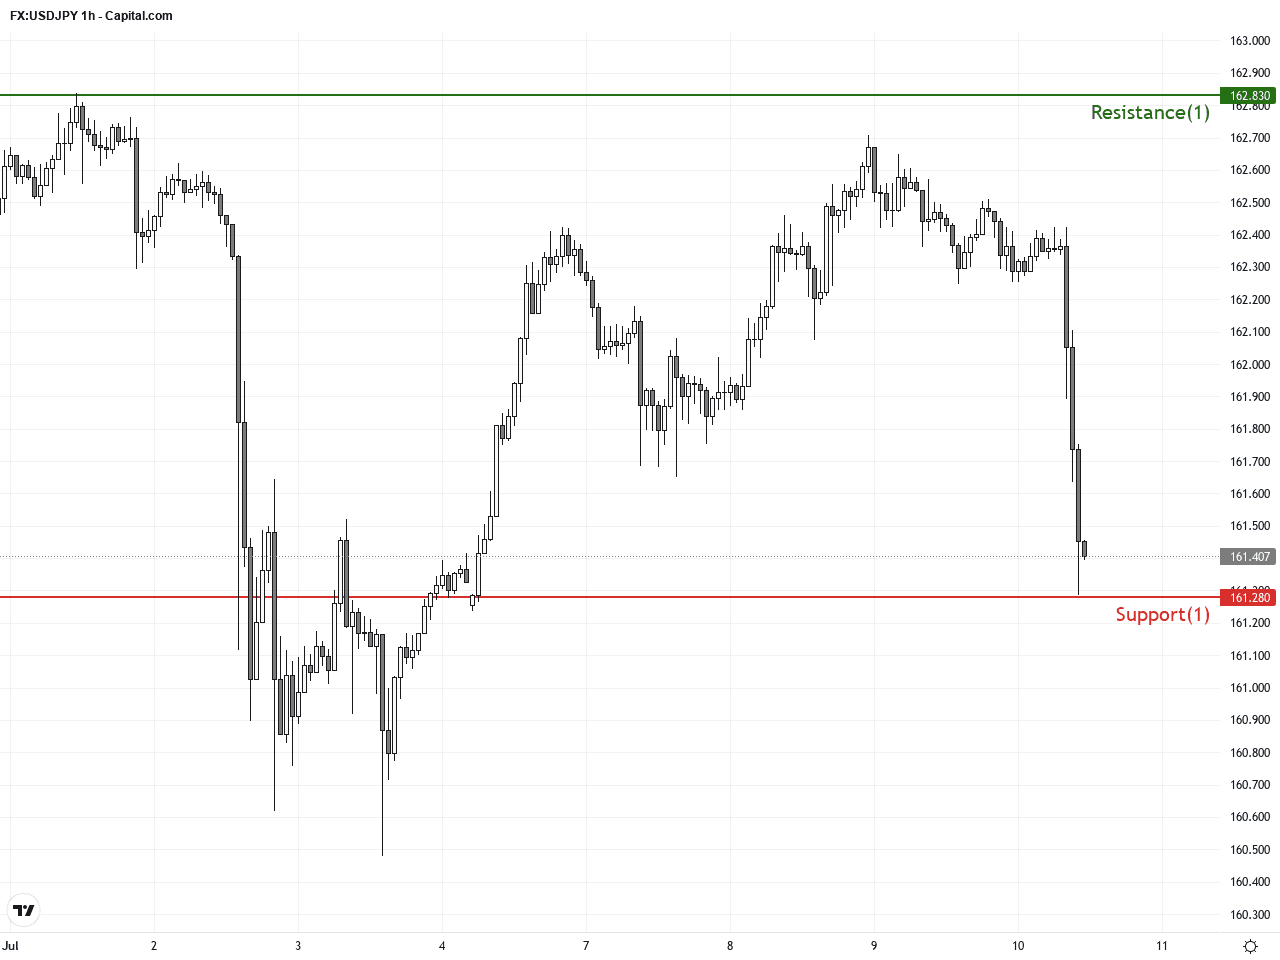
Technically, USDJPY faces a key psychological resistance near all-time highs, supported by bullish MACD and moving average alignments on the daily chart. The recent flag formation indicates a potential continuation of the uptrend if the pair breaks above 162.5. A notable recent candlestick with a long lower wick suggests buyers are defending support. However, traders should remain cautious of geo-political risks and central bank policy changes that may increase volatility.There are no significant economic events directly impacting USDJPY scheduled for today. Market attention is on the EU ECOFIN Meeting and the US Federal Reserve Monetary Policy Report, neither of which has released specific data yet. Investors should monitor these events closely as unexpected outcomes could indirectly influence the USD and thus USDJPY.
Resistance & Support
The above financial market data, quotes, charts, statistics, exchange rates, news, research, analysis, buy or sell ratings, financial education, and other information are for reference only. Before making any trades based on this information, you should consult independent professional advice to verify pricing data or obtain more detailed market information. 1uptick.com should not be regarded as soliciting any subscriber or visitor to execute any trade. You are solely responsible for all of your own trading decisions.