






 |
| Gold V.1.3.1 signal Telegram Channel (English) |
GBPUSD: Technical Patterns and Political Risks Shape Pound-Dollar Trading Outlook, July 20, 2026
2026-07-20 @ 13:01
Over the past 24 to 48 hours, the GBP/USD pair exhibited notable volatility, closing yesterday at 1.34665. The market was influenced by a combination of factors, including shifting UK political sentiment and escalating geopolitical tensions in the Middle East.
The latest report from Italian bank UniCredit highlights an improvement in UK political confidence, which supports potential continued gains for the Pound. On the other hand, rising US-Iran tensions have driven investors towards the safety of the US dollar, putting downward pressure on GBP/USD. Additionally, strong US retail sales data bolstered the dollar, adding to the pressure on the Pound.
For everyday investors, this market movement can be likened to a balancing act of risk and opportunity: the positive shift in political sentiment acts like a ‘wind of change’ that fuels potential Pound strength; meanwhile, international unrest is like a ‘sudden storm’ pushing investors to seek the safety of the dollar, weighing down the GBP. This dynamic interplay explains the recent fluctuations in the GBP/USD rate driven by these unfolding events.
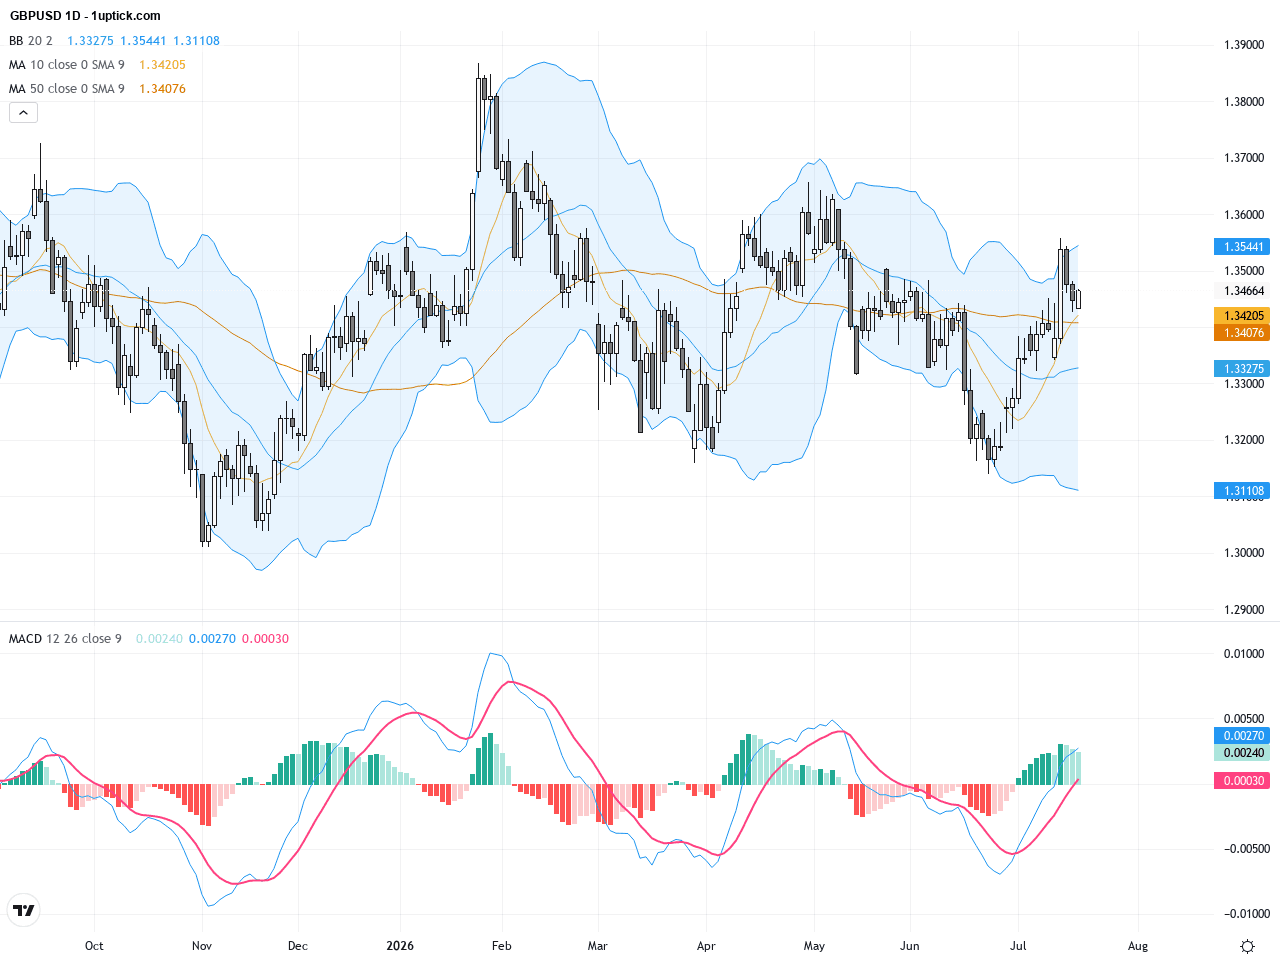
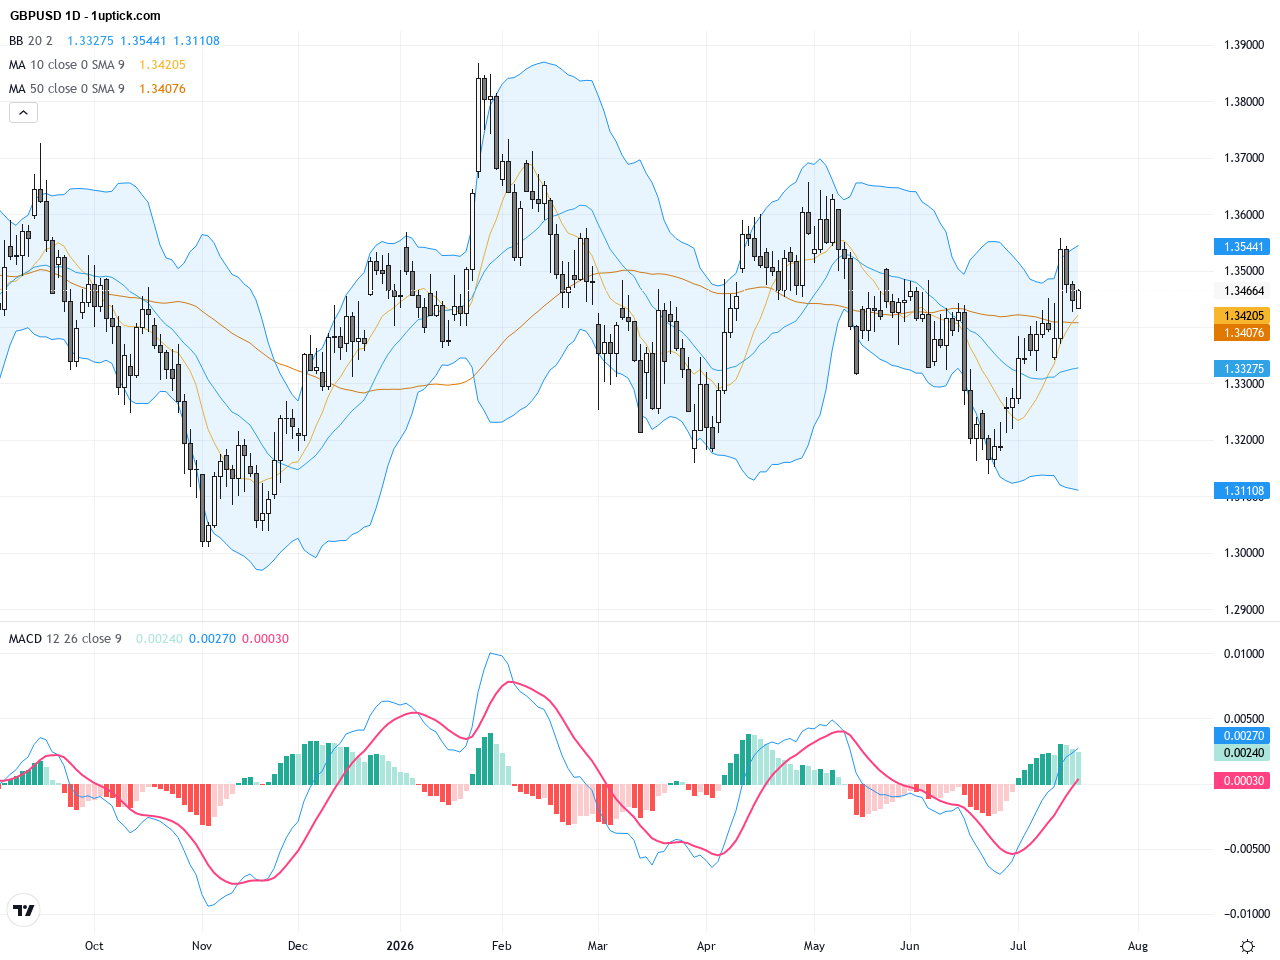
The GBPUSD daily chart shows price consolidating between roughly 1.33 and 1.38 since June. The 50-day and 200-day moving averages are intertwined, indicating a sideways to slightly bullish longer-term stance. Bollinger Bands are contracting, suggesting lower volatility. The MACD indicator shows a mild bullish crossover, pointing to a stable trend with potential to resume upward momentum. Overall, the price action exhibits a broad consolidation with key support near 1.34 and resistance around 1.36 needing attention.
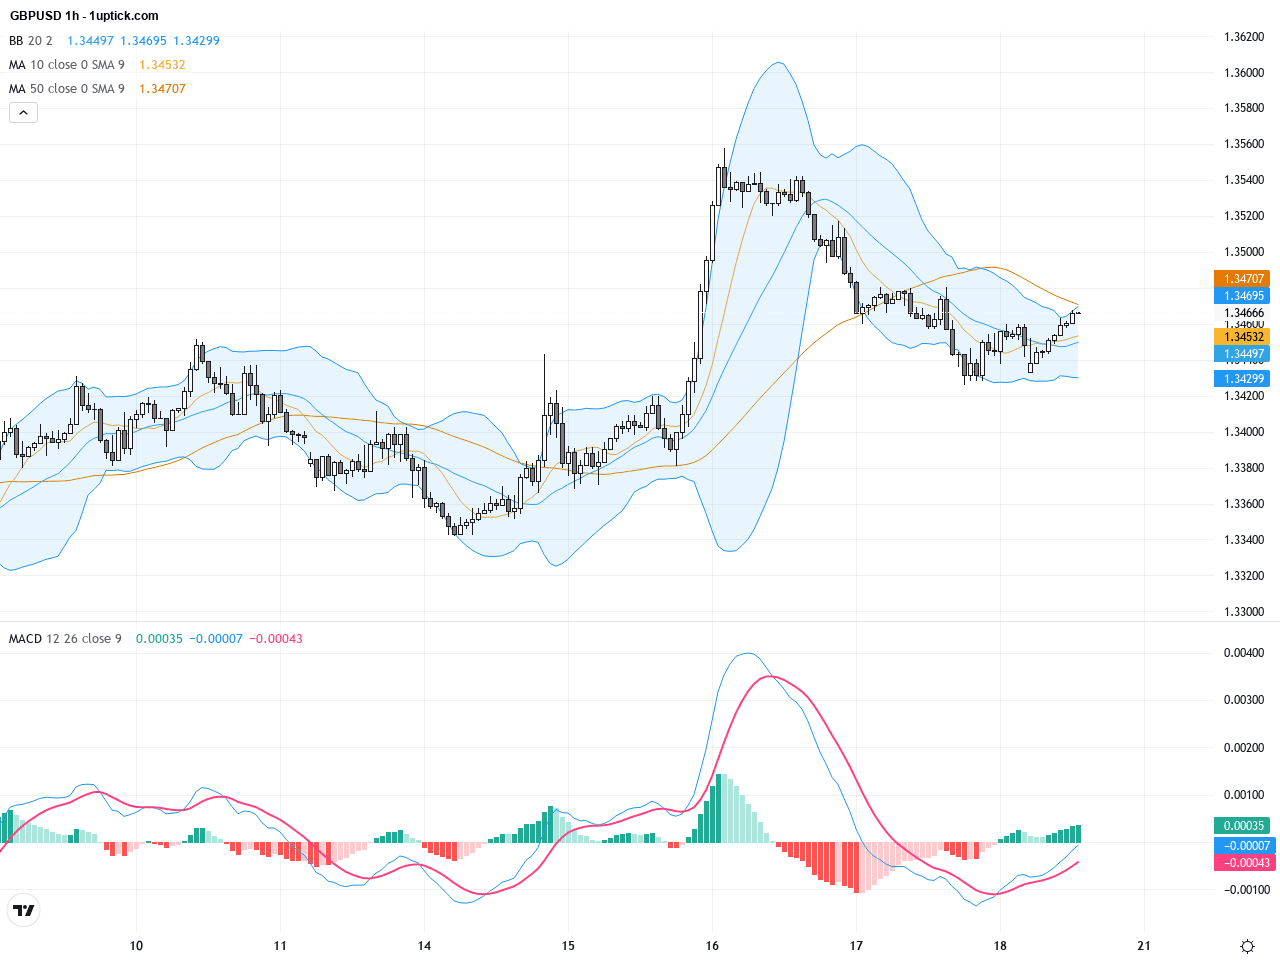
On the hourly chart covering the last 3-5 days, GBPUSD trades in a narrow 1.34-1.35 range. Moving averages show a short-term bullish alignment, but the price has repeatedly hit the upper Bollinger Band and retreated, implying near-term resistance. The MACD recently formed a bullish crossover (golden cross), signaling increasing momentum. A significant bullish engulfing candlestick pattern was observed recently, suggesting a likely short-term rebound within the next 24 hours, albeit subject to external news influences.
Technical Trend: GBPUSD currently exhibits a cautious consolidation trend with a mild bullish bias, indicating a slightly upward but range-bound phase.
Technically, GBPUSD is characterized by daily Bollinger Band contraction and strengthening MACD momentum, signaling a potential rebound opportunity. The recent bullish engulfing pattern on the hourly chart underlines short-term buyer strength. Nevertheless, external geopolitical risks and demand for the US dollar as a safe haven remain important headwinds. Traders should monitor critical support and resistance levels closely and adjust positions in line with evolving market sentiment.There are no significant or directly relevant economic events impacting GBPUSD on today’s calendar. The scheduled data, such as producer price indices and industrial production from various countries, are minor factors for GBPUSD traders. Attention remains focused on geopolitical developments and UK political changes.
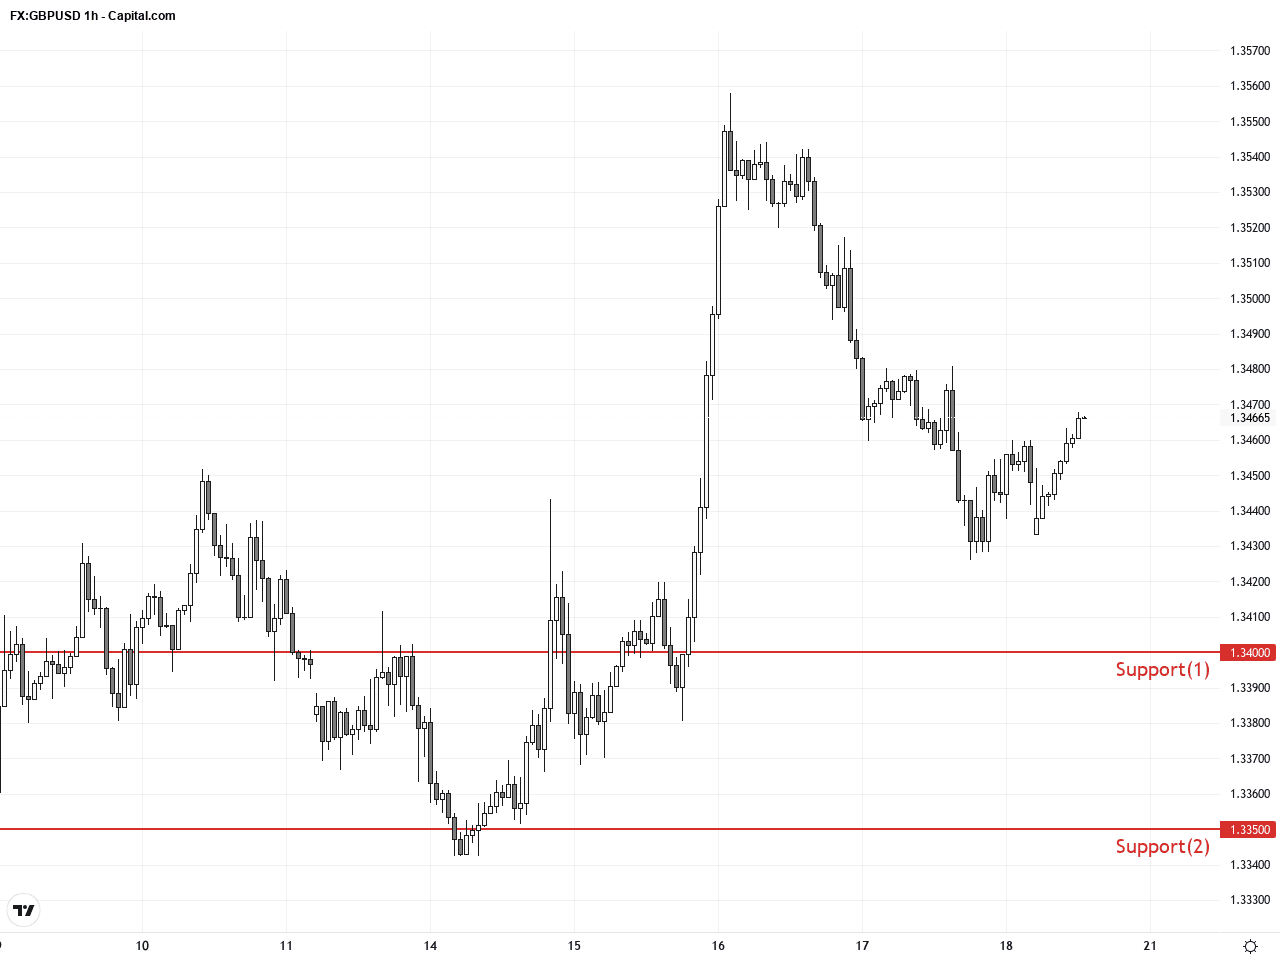
Resistance & Support
The above financial market data, quotes, charts, statistics, exchange rates, news, research, analysis, buy or sell ratings, financial education, and other information are for reference only. Before making any trades based on this information, you should consult independent professional advice to verify pricing data or obtain more detailed market information. 1uptick.com should not be regarded as soliciting any subscriber or visitor to execute any trade. You are solely responsible for all of your own trading decisions.