









 |
| Gold V.1.3.1 signal Telegram Channel (English) |
XAUUSD: Gold Price Bounces From Key Support Zone Amid Rising Yield Pressure, September 3, 2026
2026-09-03 @ 05:04
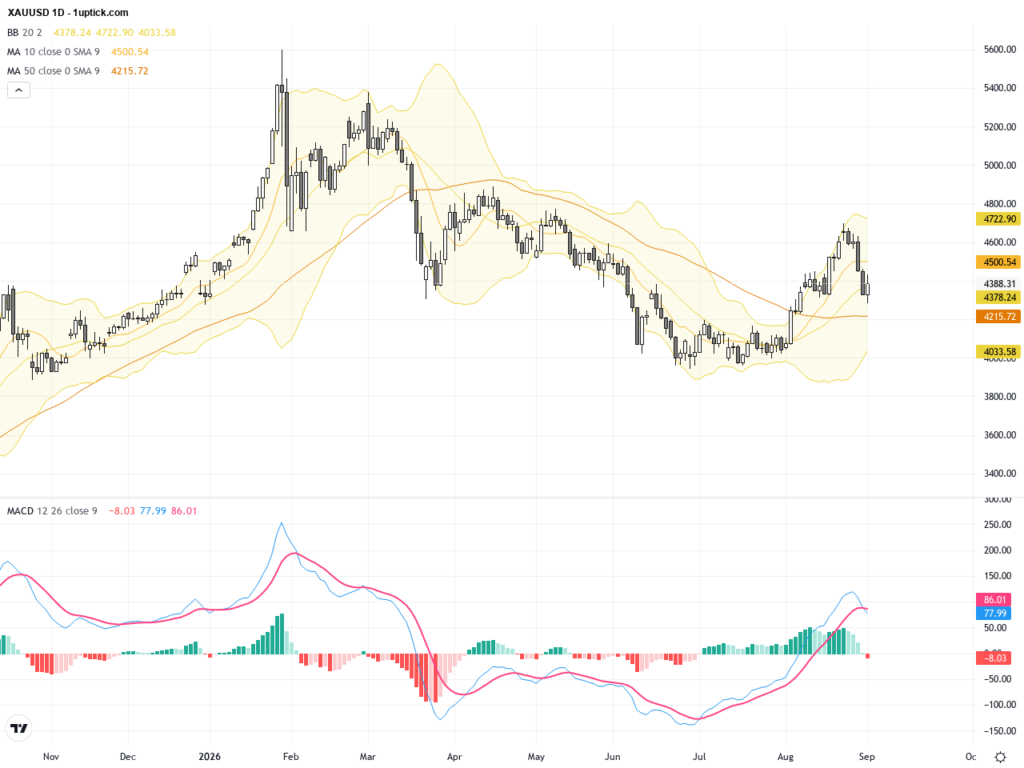
Over the past 24 to 48 hours, the gold market (XAUUSD) has seen significant volatility, with prices dropping sharply from the previous close of $4389.1 to an intraday low around $4282.45, falling below the $4300 level. This decline was mainly driven by rising US interest rate expectations, particularly after Fed official Warsh’s hawkish inflation remarks at Jackson Hole, which heightened market concerns over further rate hikes and pushed real US yields close to 4.8%.
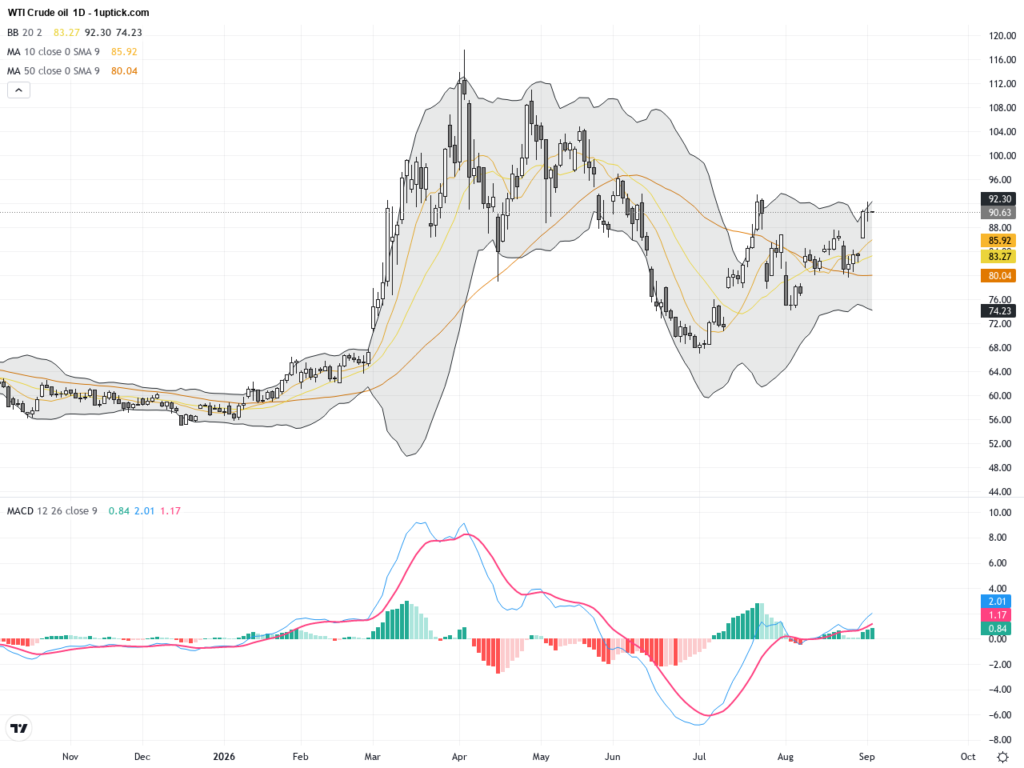
Additionally, geopolitical tensions in the Middle East, including the Larak Island strike that lifted oil prices, have increased market uncertainty, impacting gold’s appeal as an inflation hedge. Although gold found some support within a key retracement zone, the backdrop of high yields and a strong US dollar continues to weigh on prices.
For the average investor, the recent gold price moves highlight the critical influence of Federal Reserve policies and geopolitical risks in driving precious metals market volatility. With interest rates remaining elevated, gold may struggle to maintain upward momentum in the near term. Investors should stay vigilant on upcoming US economic data and global developments.
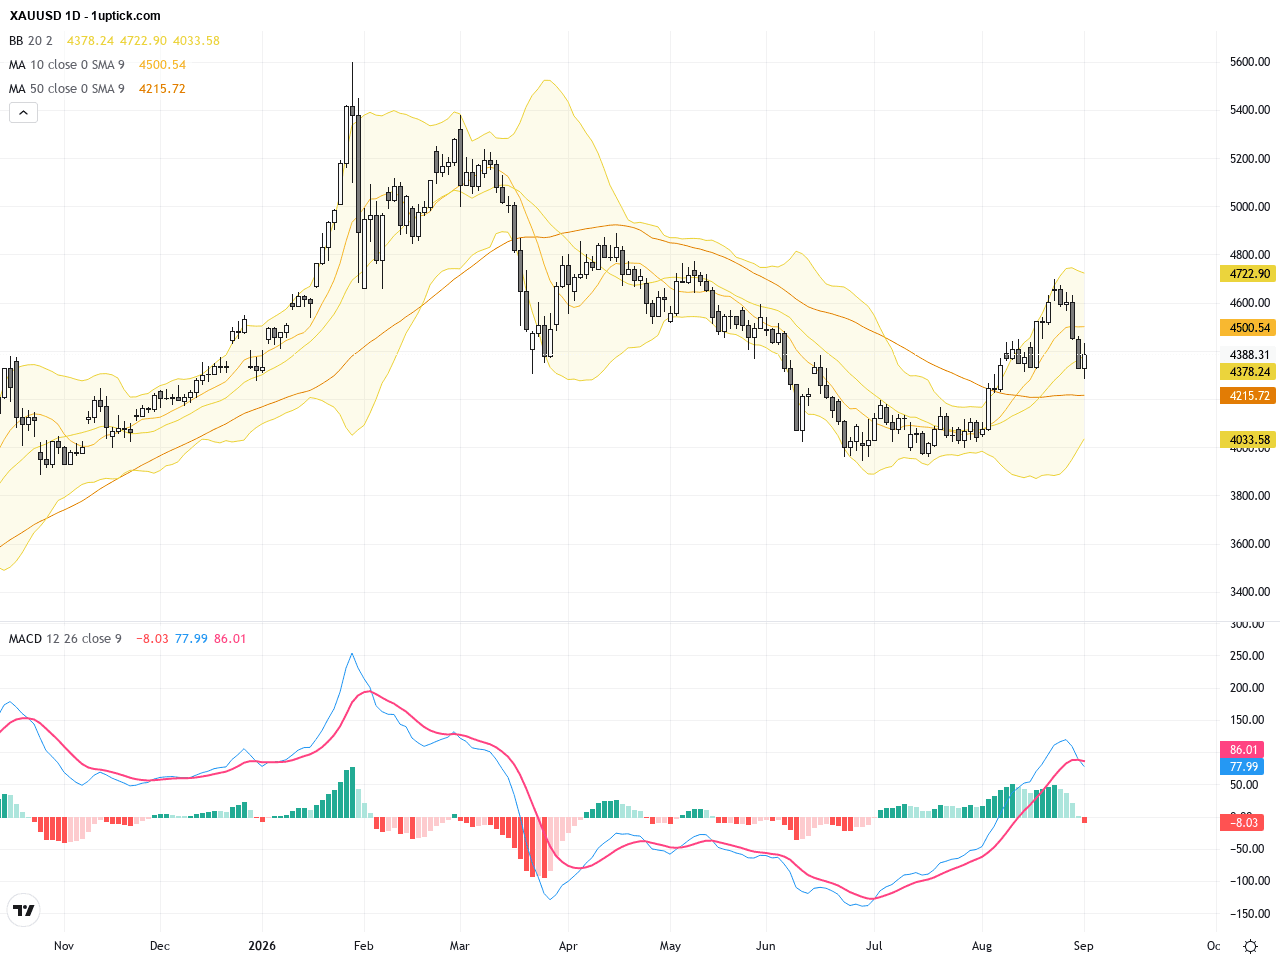
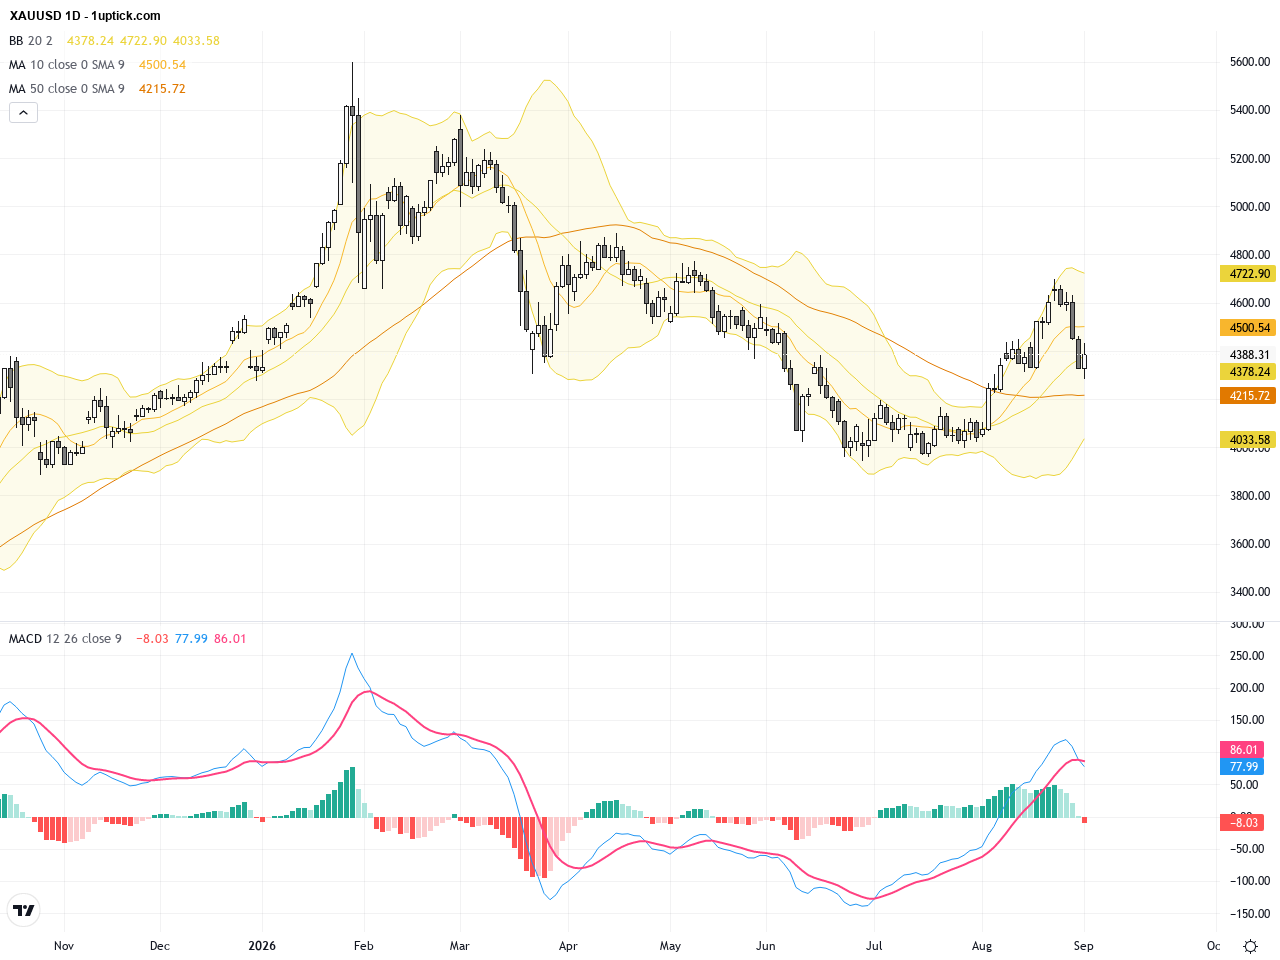
The daily chart reveals a corrective phase after a significant drop from recent highs. XAUUSD dipped under 4300, touching the 4282 support level before bouncing back. Bollinger Bands are tightening, indicating reduced volatility, while the MACD remains in negative territory, highlighting persistent medium-term bearish momentum. The 20-day and 50-day moving averages have formed a bearish crossover, reinforcing the overall downside trend. However, the formation of a potential double bottom around the support zone suggests a possible bullish reversal if the price breaks above recent short-term highs.
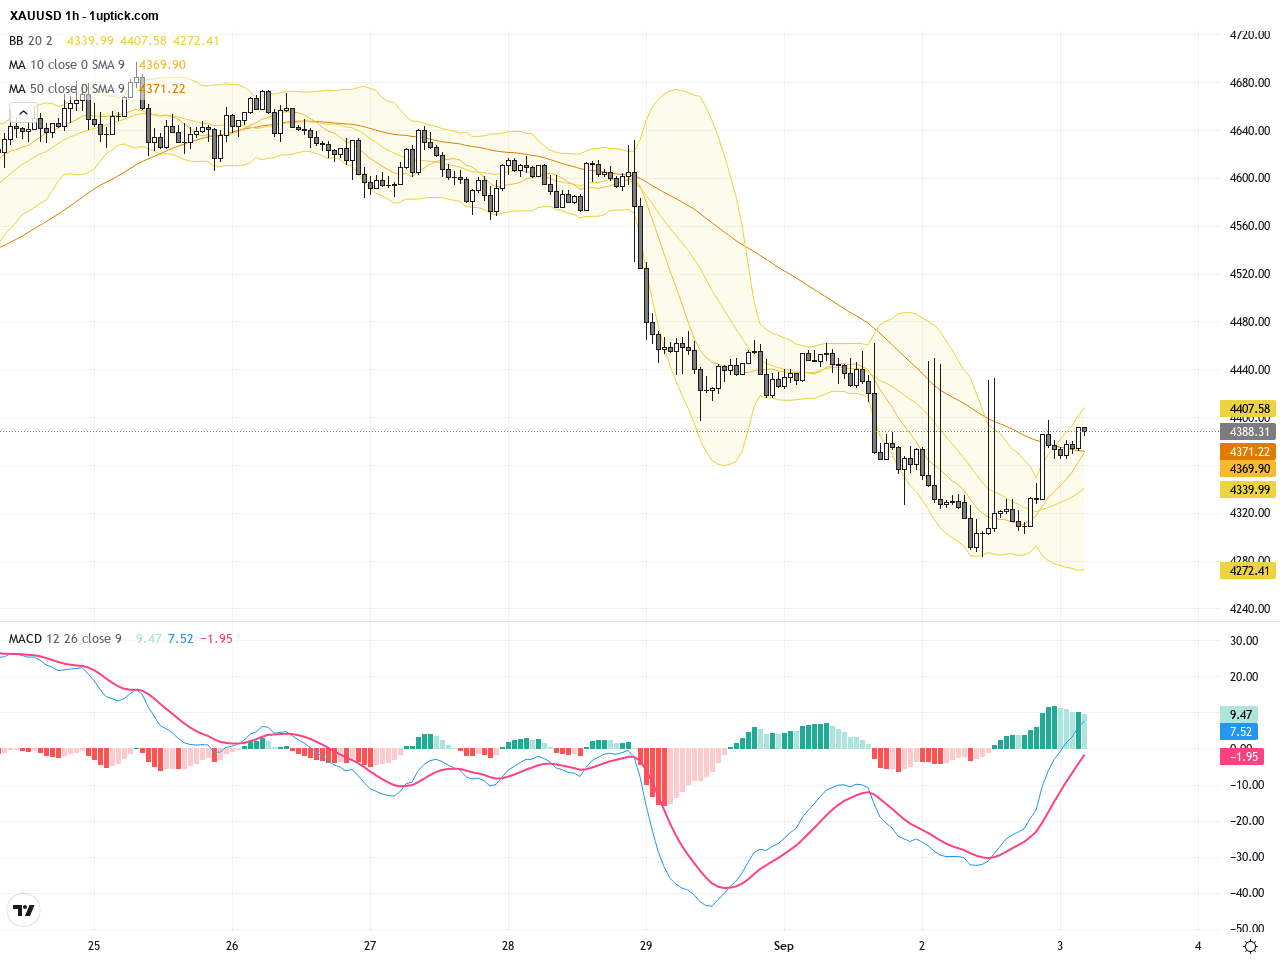
The past five days’ hourly chart shows XAUUSD oscillating between 4280 and 4390 USD, repeatedly testing the lower boundary and drawing in strong buying interest. The price is moving above the Bollinger Bands’ midline, with the MACD signaling a bullish crossover — indications that short-term momentum is shifting upward. Most recently, a bullish engulfing candlestick pattern has formed, signaling a potential move higher in the next 24 hours. Volume remains stable, supporting the ongoing recovery attempt.
Technical Trend: The current trend shows cautious rebound within an overall sideways to slightly bearish consolidation, indicating increased volatility and requiring careful trade management.
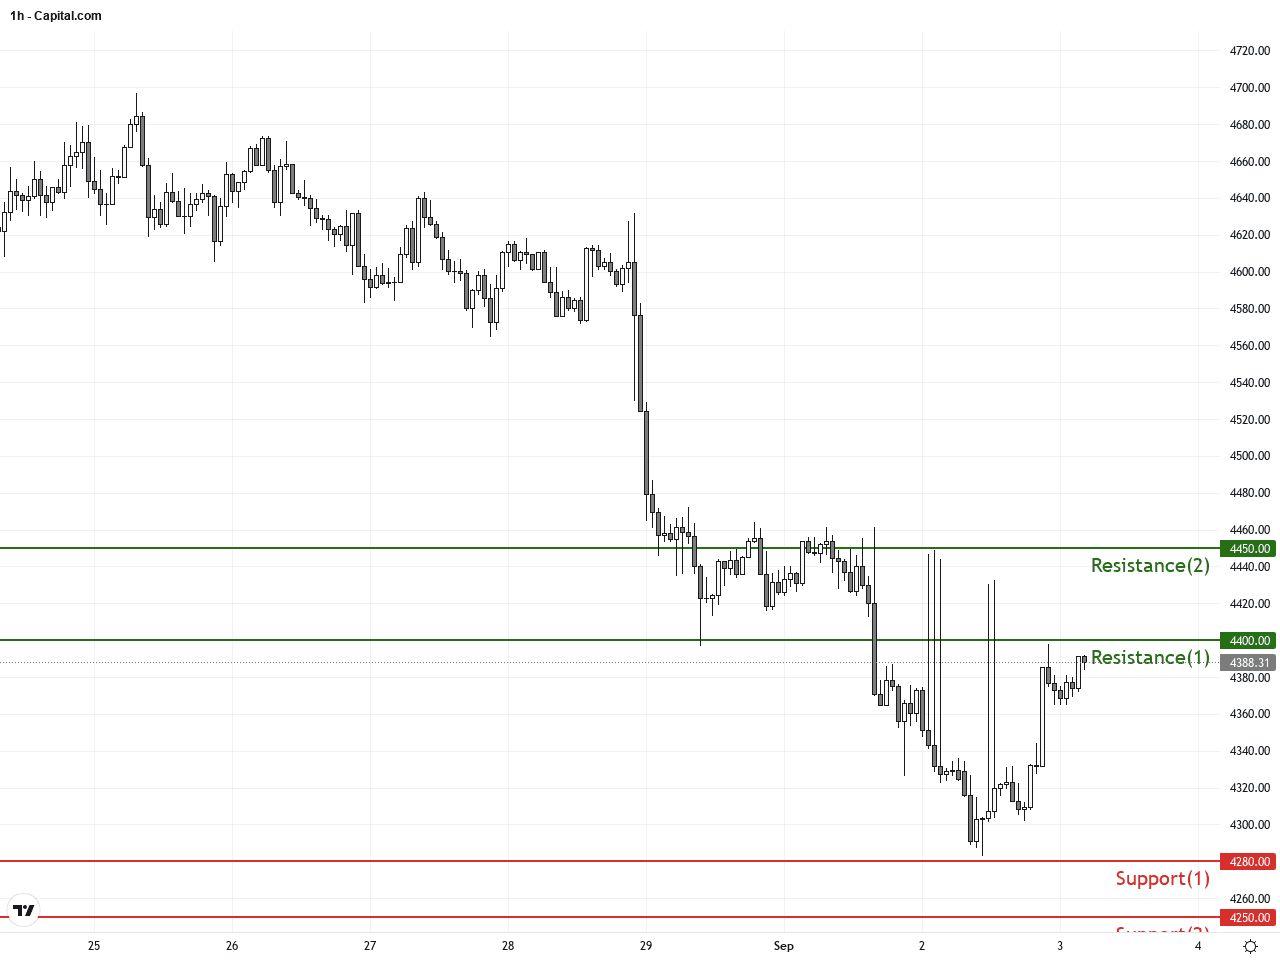
From a technical perspective, XAUUSD exhibits short-term rebound potential. The MACD bullish crossover suggests improving buyer momentum, supported by stable volume. The double bottom pattern on the daily chart and narrowing Bollinger Bands signal an imminent bounce toward the 4400 level. However, bearish pressure remains on the longer term, confirmed by the moving average death cross not yet reversed. Traders should monitor for confirmed breakout signals and economic data shifts to adjust positioning accordingly.Today’s economic calendar includes global economic data and speeches such as Australian Q2 GDP exceeding forecasts at 2.1% year-over-year, and the New Zealand Official Cash Rate holding steady at 2.75%. While these events offer some indirect support for gold’s safe-haven appeal, there are no major US economic releases directly impacting XAUUSD today. Market watchers should note the upcoming US ADP Employment Report and weekly US crude oil inventory data; significant deviations here could induce USD volatility and thus influence gold prices.
Resistance & Support
The above financial market data, quotes, charts, statistics, exchange rates, news, research, analysis, buy or sell ratings, financial education, and other information are for reference only. Before making any trades based on this information, you should consult independent professional advice to verify pricing data or obtain more detailed market information. 1uptick.com should not be regarded as soliciting any subscriber or visitor to execute any trade. You are solely responsible for all of your own trading decisions.