










 |
| Gold V.1.3.1 signal Telegram Channel (English) |

AUDUSD: Bulls Struggle Below 50-Day SMA as Key Resistance Holds, July 27, 2026
2026-07-27 @ 06:01
Over the past 24 to 48 hours, the AUD/USD pair has exhibited notable volatility, pressured by a stronger US Dollar despite stronger-than-expected Australian employment data. Yesterday’s closing price was 0.69996, while the current price hovers around 0.6966, reflecting a 0.45% decline. This underscores the tug-of-war investors are facing between a robust USD and positive Aussie fundamentals.
Recent market reports highlight that the Reserve Bank of Australia’s hawkish stance provides some support for the Australian dollar; however, Middle East geopolitical tensions have driven oil prices higher, increasing expectations for Fed rate hikes and consequently fueling risk aversion. This dynamic has kept the pair struggling just below the 50-day moving average resistance. Although AUD/USD briefly reclaimed the 0.70 level near its 200-day EMA, uncertainty over US economic data and monetary policy continues to weigh on price action.
For the average investor, this means that while Australia’s labor market shows resilience, the US Dollar’s safe-haven appeal is limiting any immediate upward momentum in AUD/USD. It is advisable to closely monitor upcoming US jobs data and Middle East developments, as these factors will directly influence exchange rate trends and risk assessment moving forward.
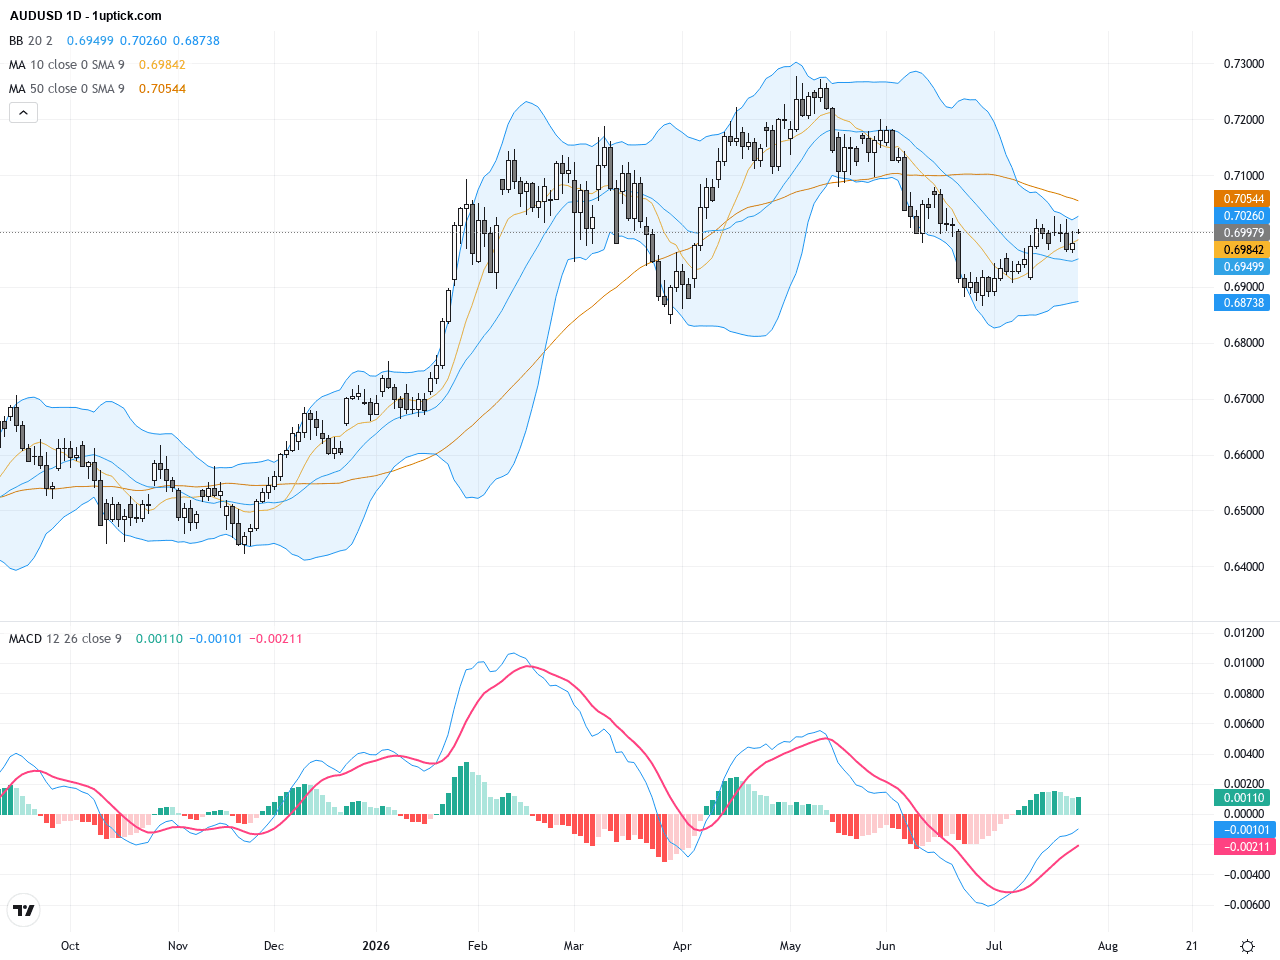
The daily chart shows AUDUSD trading within a range since the start of the year, oscillating between approximately 0.64 and 0.73. Recently, the price has attempted to break above the 50-day and 200-day moving averages (around 0.70005 and 0.697 respectively) but faced resistance due to USD strength. The Bollinger Bands have tightened indicating reduced volatility, while the MACD remains near the zero line without clear direction, suggesting a lack of momentum continuation in the short term.
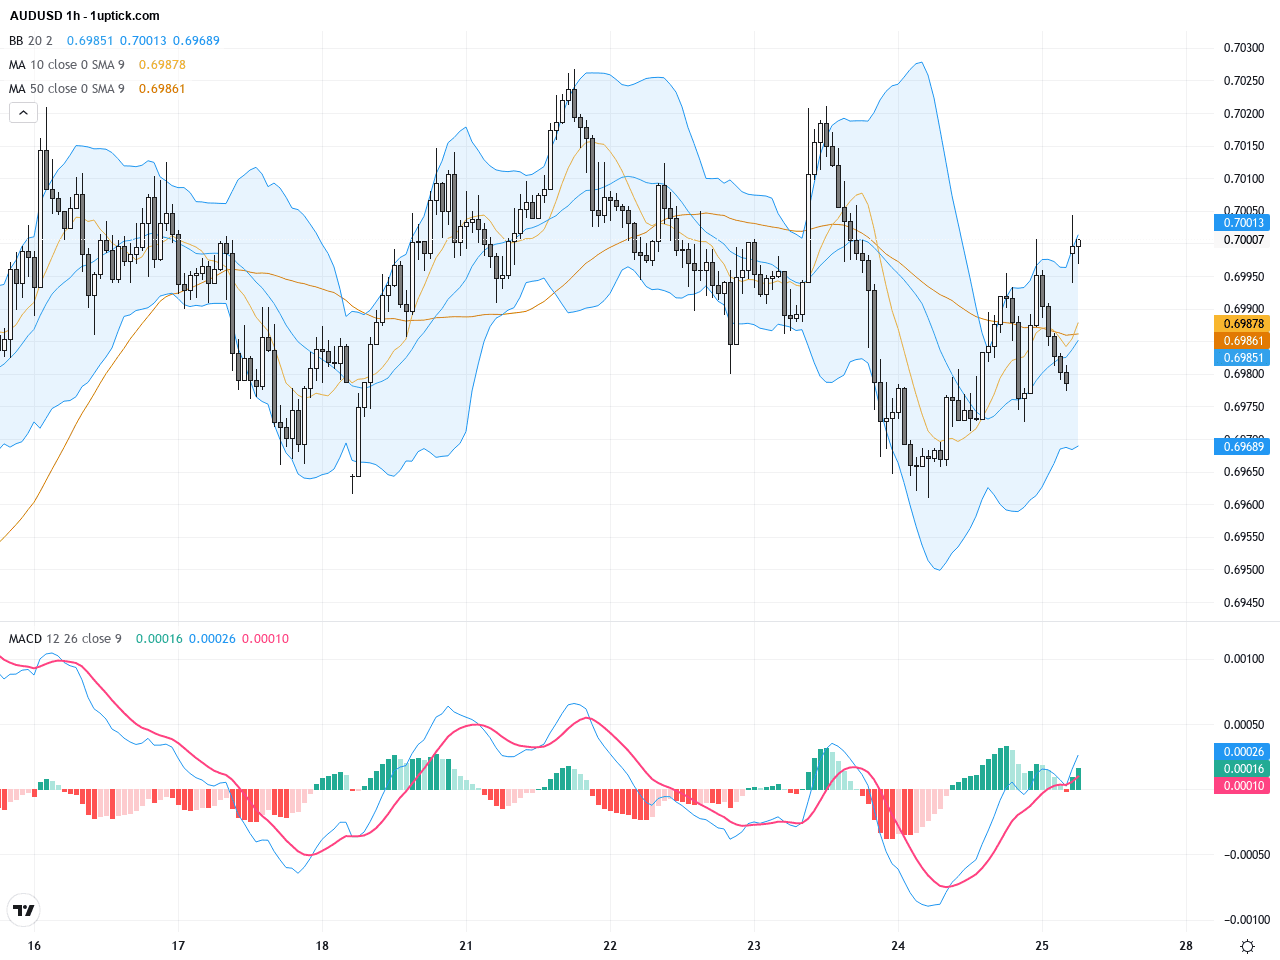
The 1-hour chart over the past five days highlights intense short-term tug-of-war between bulls and bears. Price has repeatedly tested the 0.70 level but failed to break above it, forming an approximate symmetrical triangle consolidation. Short-term moving averages are converging, MACD shows weakening momentum, and the narrowing Bollinger Bands signal an impending breakout, making the coming sessions critical for traders.
Technical Trend: AUDUSD is currently in a ‘Cautiously Sideways’ trend, characterized by balanced but slightly bearish consolidation, awaiting a clear breakout to confirm next direction.
Technical analysis points to AUDUSD struggling below the 50-day SMA, with key daily resistance holding firm. The short-term symmetrical triangle pattern suggests a big directional move is imminent. Declining MACD histogram and tightening Bollinger Bands indicate momentum fading. A breakout above 0.7050 would validate bullish sentiment and open targets toward higher resistance, while a drop below 0.6950 would warn of deeper correction risks.According to the GMT+1 economic calendar, there are no major data releases directly impacting AUDUSD today. The US durable goods orders releases at 14:30 carry moderate expectations with limited likely impact on USD or AUD. EU and German business climate data are also scheduled but with minimal influence on AUD. Overall, the fundamental landscape remains quiet with no significant events poised to drive AUDUSD movement today.
Resistance & Support

The above financial market data, quotes, charts, statistics, exchange rates, news, research, analysis, buy or sell ratings, financial education, and other information are for reference only. Before making any trades based on this information, you should consult independent professional advice to verify pricing data or obtain more detailed market information. 1uptick.com should not be regarded as soliciting any subscriber or visitor to execute any trade. You are solely responsible for all of your own trading decisions.