







 |
| Gold V.1.3.1 signal Telegram Channel (English) |
XAUUSD Trading Alert: Volatile Consolidation Signals Potential Breakout, July 28, 2026
2026-07-28 @ 05:04
Over the past 48 hours, gold (XAUUSD) has exhibited notable volatility, closing at 4076.685 USD per ounce on July 27, reflecting a slight decline from the previous day. This movement has been largely driven by market anticipation of the Federal Reserve’s upcoming interest rate decision and its potential impact. Investors remain focused on the forthcoming Federal Open Market Committee (FOMC) meeting results, as it will directly influence gold’s appeal as a safe haven and the US dollar’s trajectory.
Market attention has also been drawn to notable economist Warsh’s comments, which could break the gold market’s five-week sideways range. Additionally, rising global oil prices have diverted some capital towards energy assets, placing short-term pressure on gold. Overall, the market broadly expects the Fed to maintain a relatively hawkish rate stance, suppressing prices of non-yielding assets like gold, causing gold prices to remain unsettled in a consolidation phase.
For the average investor, this indicates that gold’s near-term trend will be heavily swayed by macroeconomic policy decisions and broader market sentiment. Should the Fed raise rates, the opportunity cost of holding gold increases, potentially weighing on gold prices; conversely, a more dovish stance would support gold as a safe haven asset.
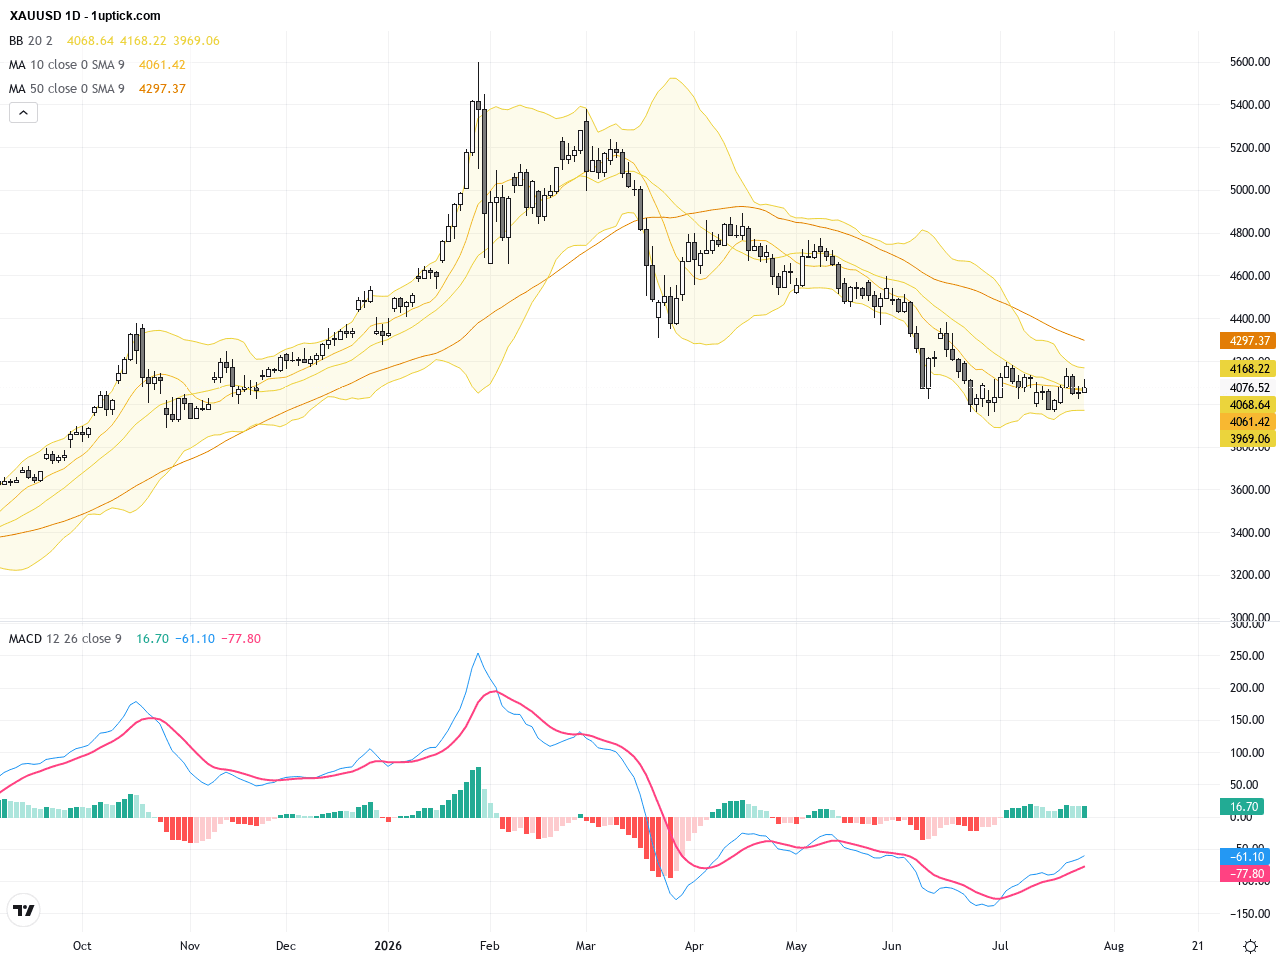
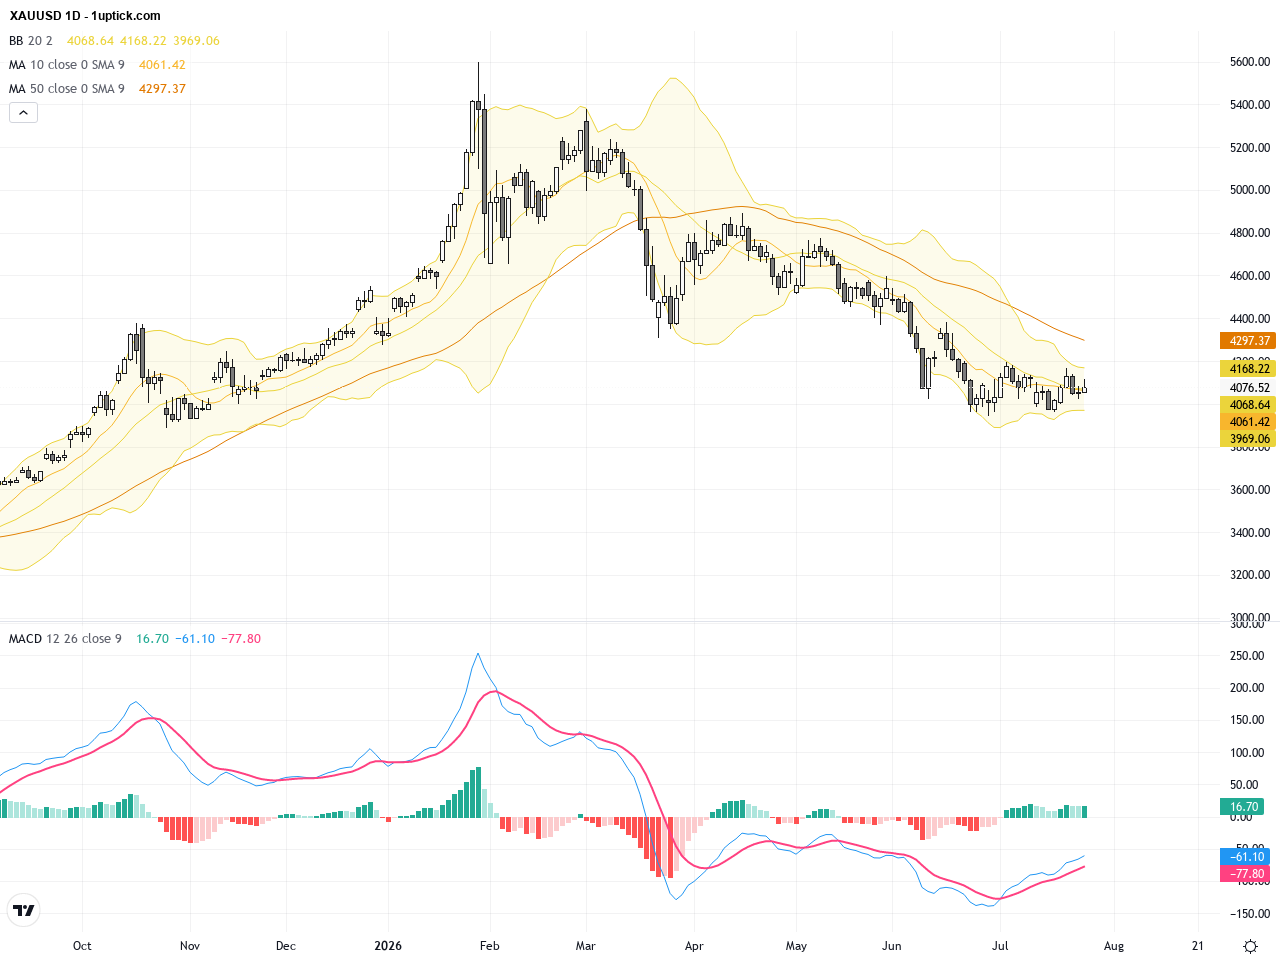
The daily chart reveals a recent downtrend in XAUUSD, with prices declining from highs around 4160 USD to near the current 4076 USD. Bollinger Bands are narrowing, signaling decreased volatility, while the MACD remains in negative territory, highlighting bearish momentum. Moving averages are flattening, indicating indecision and a battle between bulls and bears. The price is hovering near critical support levels, making it vital to watch for confirmation of either a rebound or a breakdown in the near term.
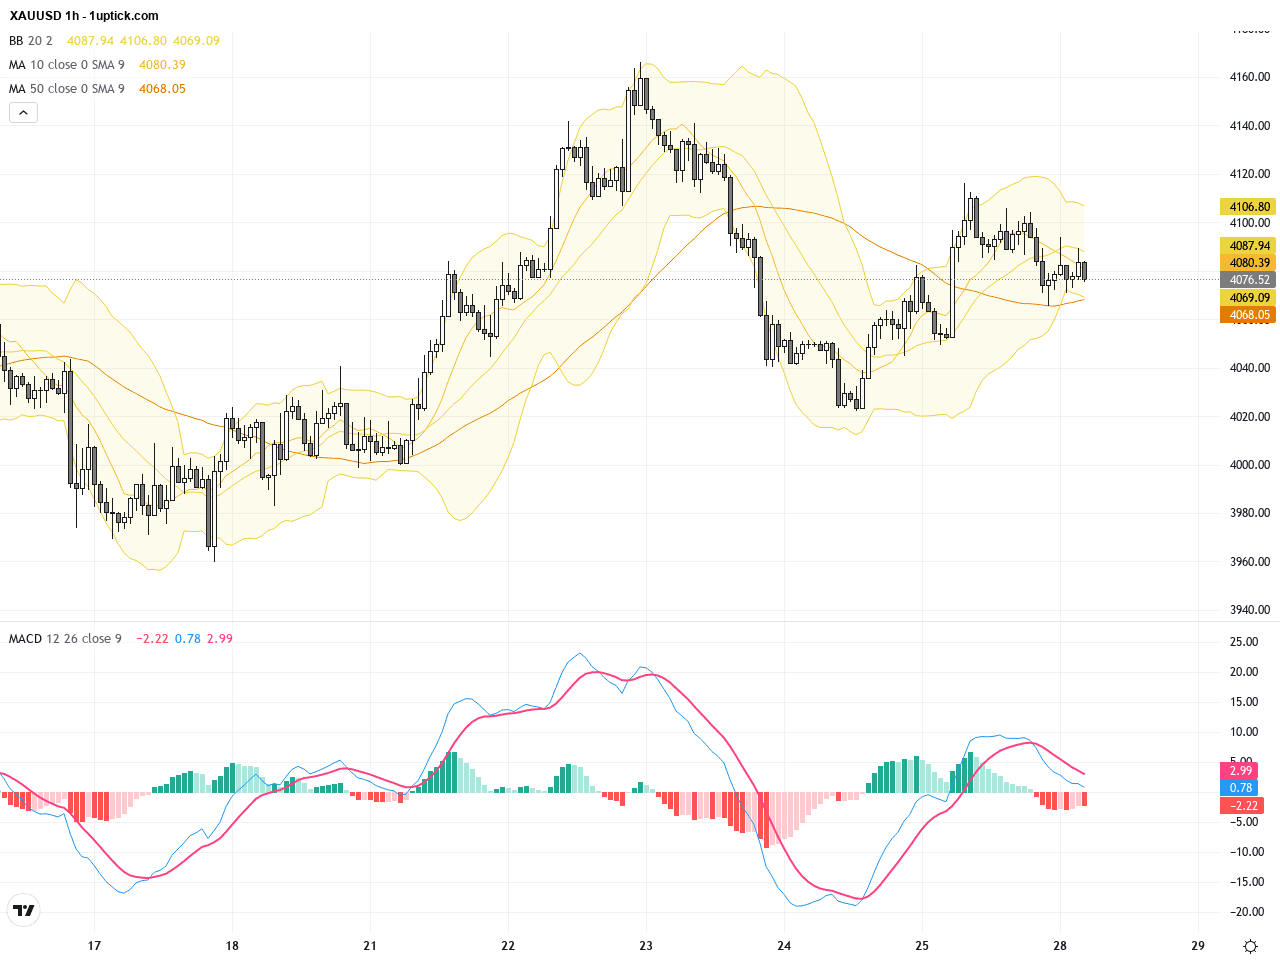
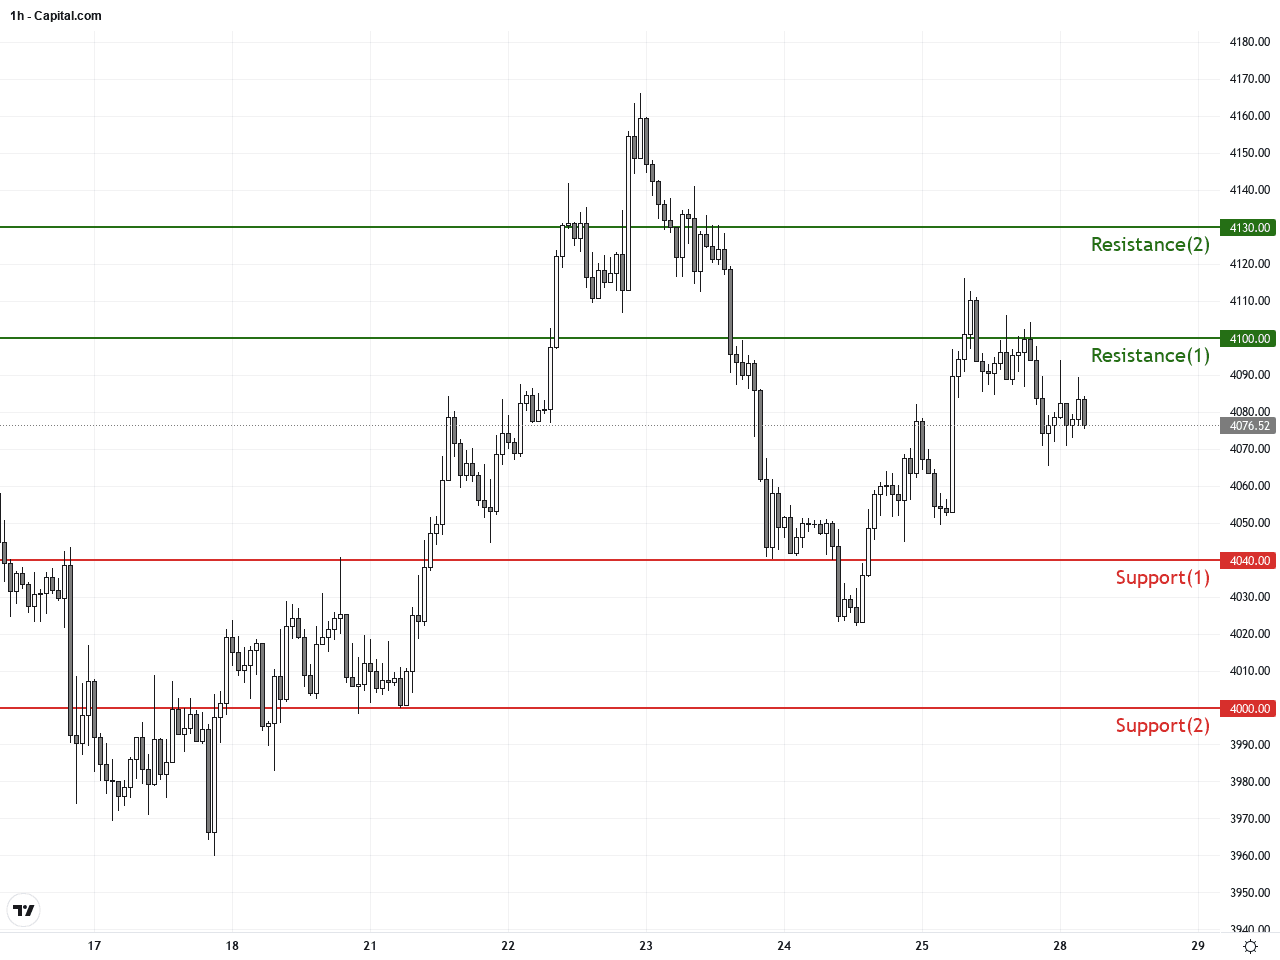
On the hourly chart, over the past 3-5 days, XAUUSD has repeatedly tested resistance near 4100 USD without strong breaks, pulling back to support around 4050 USD. Bollinger Bands are compressed with prices near the middle band, suggesting caution from traders. MACD shows a crossover around the zero line, and RSI remains neutral, reflecting an unclear short-term trend. The pattern resembles a converging triangle, implying an imminent breakout could be on the horizon.
Technical Trend: Currently, XAUUSD is in a cautious consolidation phase with an overall weak trend, best described as ‘uncertain sideways’. The market is poised for a breakout in either direction, pending confirmation.
Technically, XAUUSD shows a tightening Bollinger Band and bearish MACD on the daily chart, suggesting a potential for increased volatility and a directional breakout soon. The hourly triangle consolidation pattern points to an imminent price move above 4100 USD resistance or below 4040 USD support. Multiple moving averages converging on the H4 chart accentuate the indecision, awaiting a key market driver. Traders should stay alert to upcoming US economic reports and Fed commentary to catch the next high-probability setup.Today’s GMT+1 economic calendar includes EU and German business climate data and money supply stats, which are generally neutral for XAUUSD. US releases of Durable Goods Orders and Dallas Fed Manufacturing Index later today could impact USD strength and thus gold prices. Unless significant surprises emerge, these events may only slightly influence intraday price movements. Traders should monitor the data closely for any potential catalysts.
Resistance & Support
The above financial market data, quotes, charts, statistics, exchange rates, news, research, analysis, buy or sell ratings, financial education, and other information are for reference only. Before making any trades based on this information, you should consult independent professional advice to verify pricing data or obtain more detailed market information. 1uptick.com should not be regarded as soliciting any subscriber or visitor to execute any trade. You are solely responsible for all of your own trading decisions.