







 |
| Gold V.1.3.1 signal Telegram Channel (English) |
USDCAD: Key Support and Resistance Levels After Fed Holds Rates Steady, July 30, 2026
2026-07-30 @ 13:01
Over the past 48 hours, the USD/CAD pair has experienced a slight decline, slipping from yesterday’s closing price of 1.40549 to around the 1.40 level. This modest retracement was primarily driven by the Federal Reserve’s decision to hold interest rates steady, a move largely anticipated by the market which therefore did not trigger major volatility. With the rate pause largely priced in, the US dollar lacks upward momentum at this point.
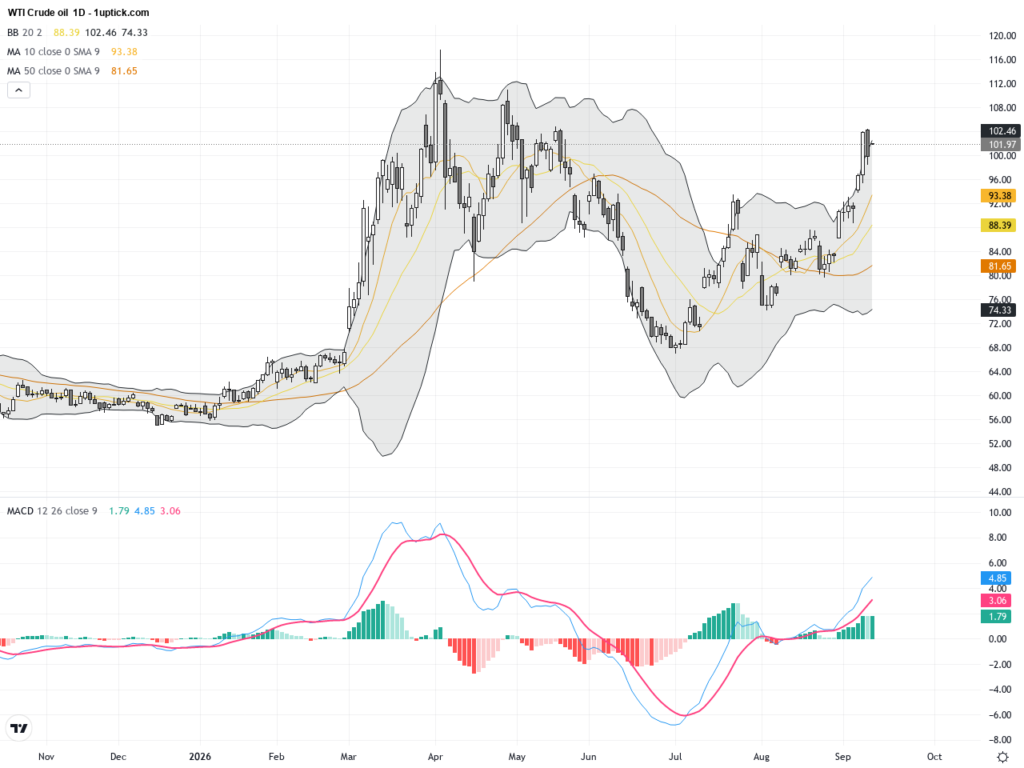
Additionally, declining dollar safe-haven demand and a pullback in oil prices have constrained USD/CAD’s movement. As a commodity currency, the Canadian dollar’s strength closely follows oil price trends. While oil prices had previously risen on increased regional supply risks, the recent correction limited the loonie’s rebound, and coupled with ongoing uncertainties over Fed policy direction, USD/CAD continues to trade in a narrow range between 1.40 and 1.41.
For the average investor, this means short-term stability in USD/CAD with limited breakout potential. Attention should be given to future Fed policy signals and North American energy market developments, as these will directly impact currency movements. Overall, the Fed’s interest rate hold provides a temporary stabilizing backdrop, but investors need to watch for geopolitical events and energy price swings, which could precipitate more significant moves in the exchange rate in the near future.
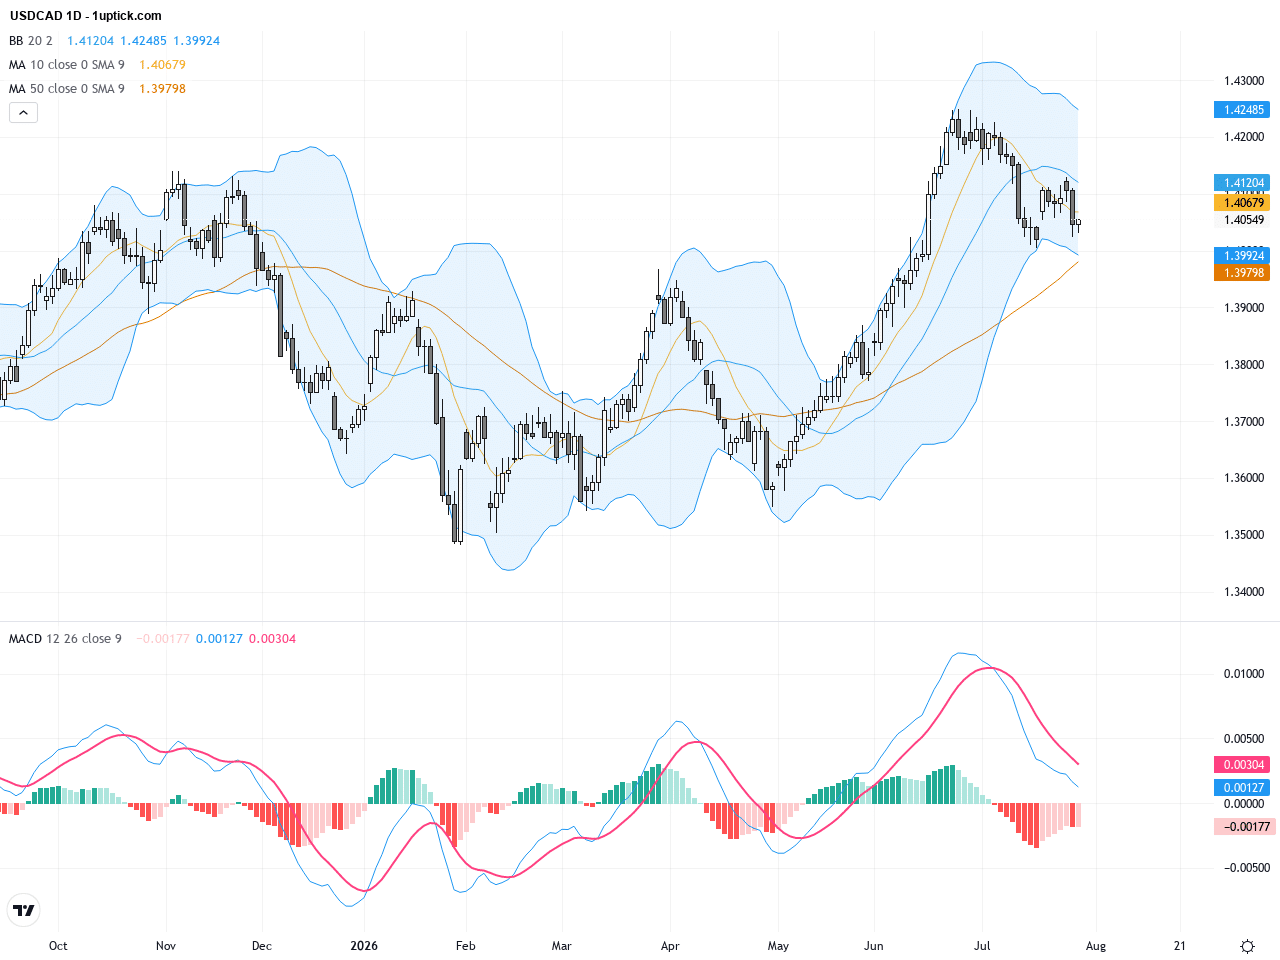
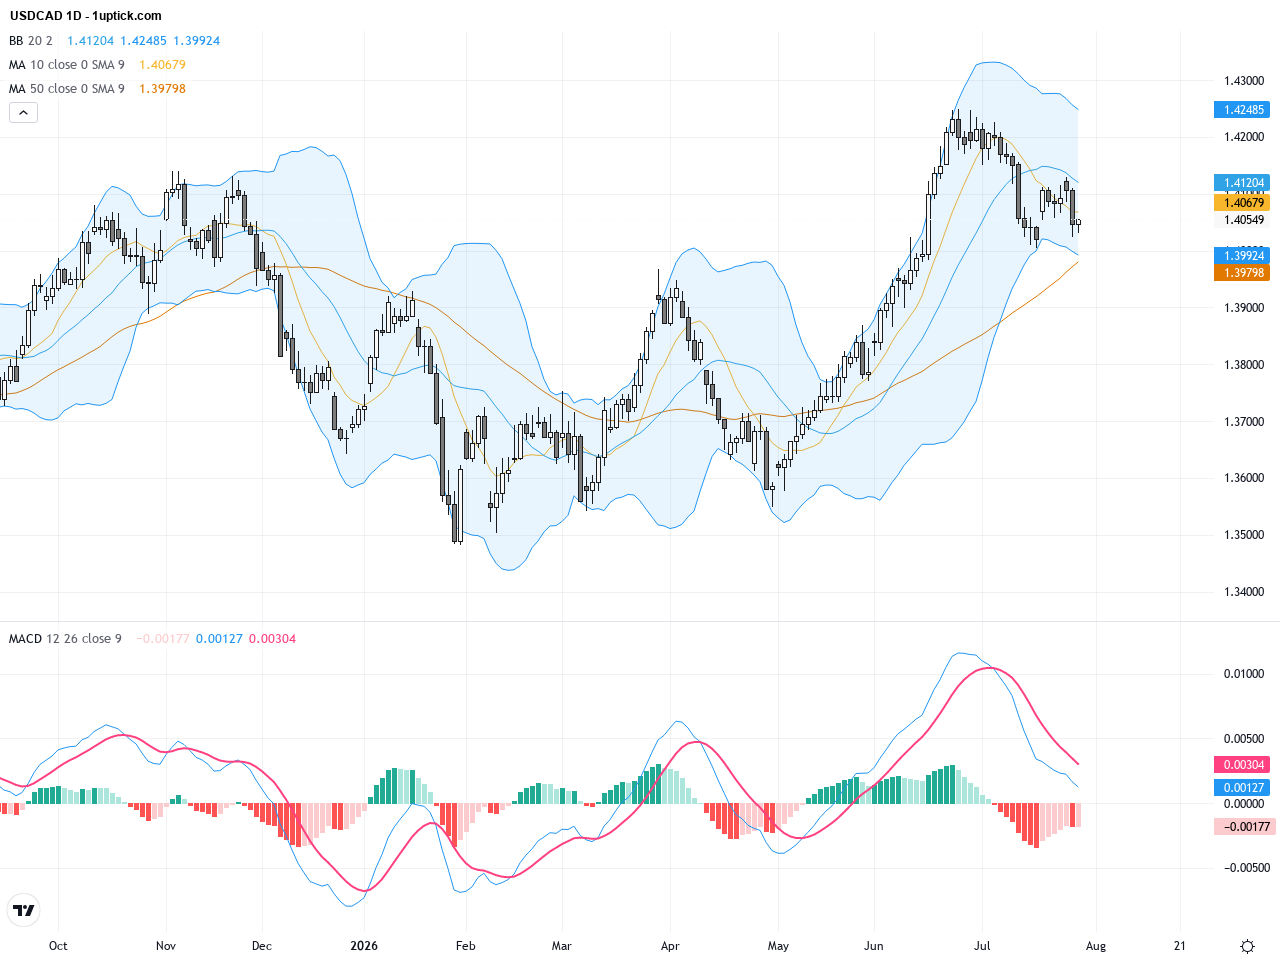
The USDCAD daily chart illustrates a consolidation with slight upward bias since its recent lows. Price hovers just below the 50-day moving average at around 1.41, with the 200-day moving average near 1.38 providing solid support. The Bollinger Bands are narrowing, and the MACD is near the zero line, indicating market indecision. No clear reversal pattern is shown on the daily timeframe yet, but bullish momentum remains in place pending a break above the 1.4150 resistance level.
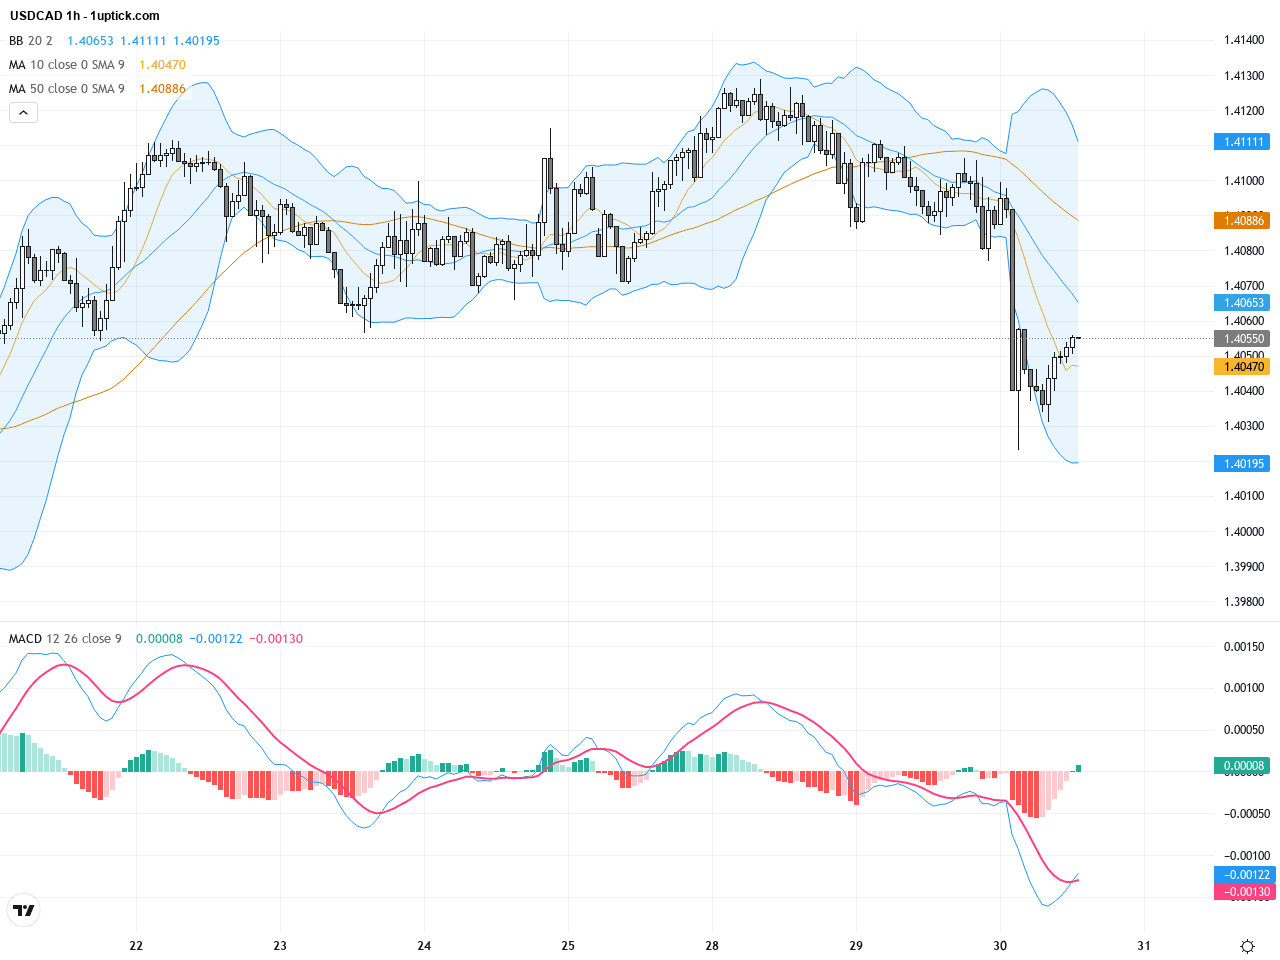
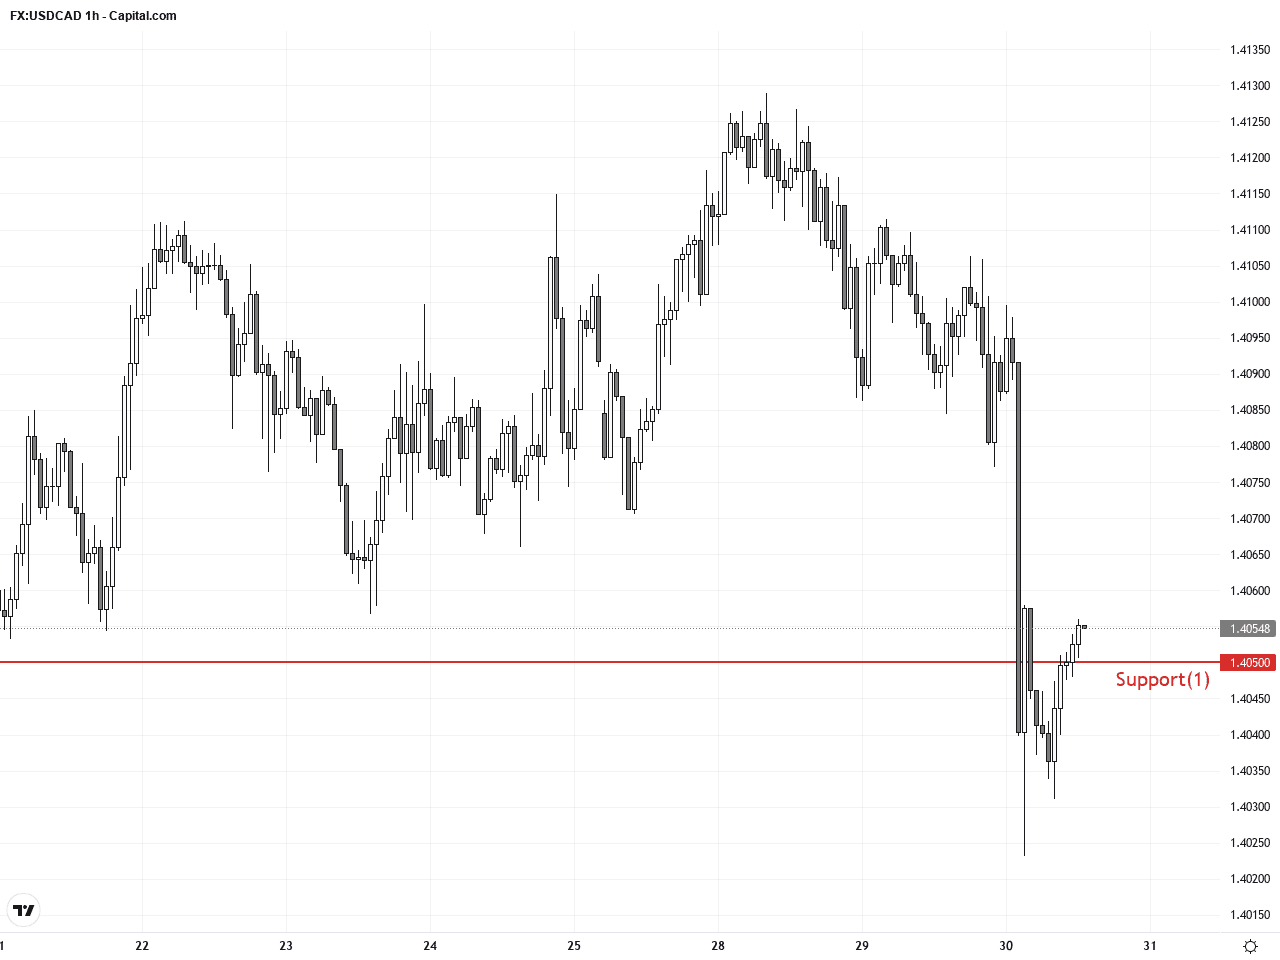
On the 1-3 day hourly chart, USDCAD is consolidating with multiple tests of the 1.4050 support but no decisive break below. Short-term moving averages show bullish alignment, and the Bollinger Bands are starting to widen. The MACD has formed a bullish crossover, suggesting potential for near-term upside. A break above 1.4125 could trigger the next leg higher.
Technical Trend: The current trend is cautiously bullish within a consolidation phase, awaiting confirmation from a breakout above resistance.
Technically, USDCAD is consolidating near the pivotal 1.4150 resistance level. The MACD bullish crossover and supportive moving averages suggest upside potential in the short term. The narrowing Bollinger Bands on the daily chart imply imminent increased volatility and potential for a breakout. Recent Fed news is priced in; upcoming oil price dynamics and economic data will be key to the pair’s movement.Today’s economic calendar includes key US data releases at 14:30 GMT+1 such as the core Personal Consumption Expenditures (PCE) and preliminary GDP figures, which are highly relevant to USDCAD. Better-than-expected numbers would likely strengthen the US dollar and push USDCAD higher, while softer data could weigh on the pair. Other scheduled data from different regions have limited direct impact on the pair. The market focus remains firmly on Fed policy cues and energy price developments.
Resistance & Support
The above financial market data, quotes, charts, statistics, exchange rates, news, research, analysis, buy or sell ratings, financial education, and other information are for reference only. Before making any trades based on this information, you should consult independent professional advice to verify pricing data or obtain more detailed market information. 1uptick.com should not be regarded as soliciting any subscriber or visitor to execute any trade. You are solely responsible for all of your own trading decisions.