









 |
| Gold V.1.3.1 signal Telegram Channel (English) |
WTI Crude Oil: Middle East Tensions Trigger Sharp Price Surge Amid Key Resistance Zone, July 30, 2026
2026-07-30 @ 06:03
Over the past 24 to 48 hours, WTI Crude Oil prices showed notable volatility, surging from yesterday’s close of $84.46 to above $87, marking a nearly $3 increase. This reflects the market’s acute sensitivity to escalating geopolitical risks in the Middle East.
According to the latest market news, renewed military strikes in the region have pushed oil prices sharply higher. Joint US-Saudi airstrikes in Iraq and Iranian missile attacks targeting US forces in Jordan reignited tensions, raising investor concerns over potential disruptions in energy supply. Earlier, oil prices fell about 5% amid hopes of a pause in conflict, highlighting the market’s fragile balance between peace hopes and supply risk anxieties.
For the average investor, this means short-term oil prices are largely driven by unpredictable international security developments rather than just supply and demand fundamentals. The sudden price swings underscore the need to closely monitor geopolitical events and adjust investment approaches accordingly to manage risks in this highly sensitive commodity market.
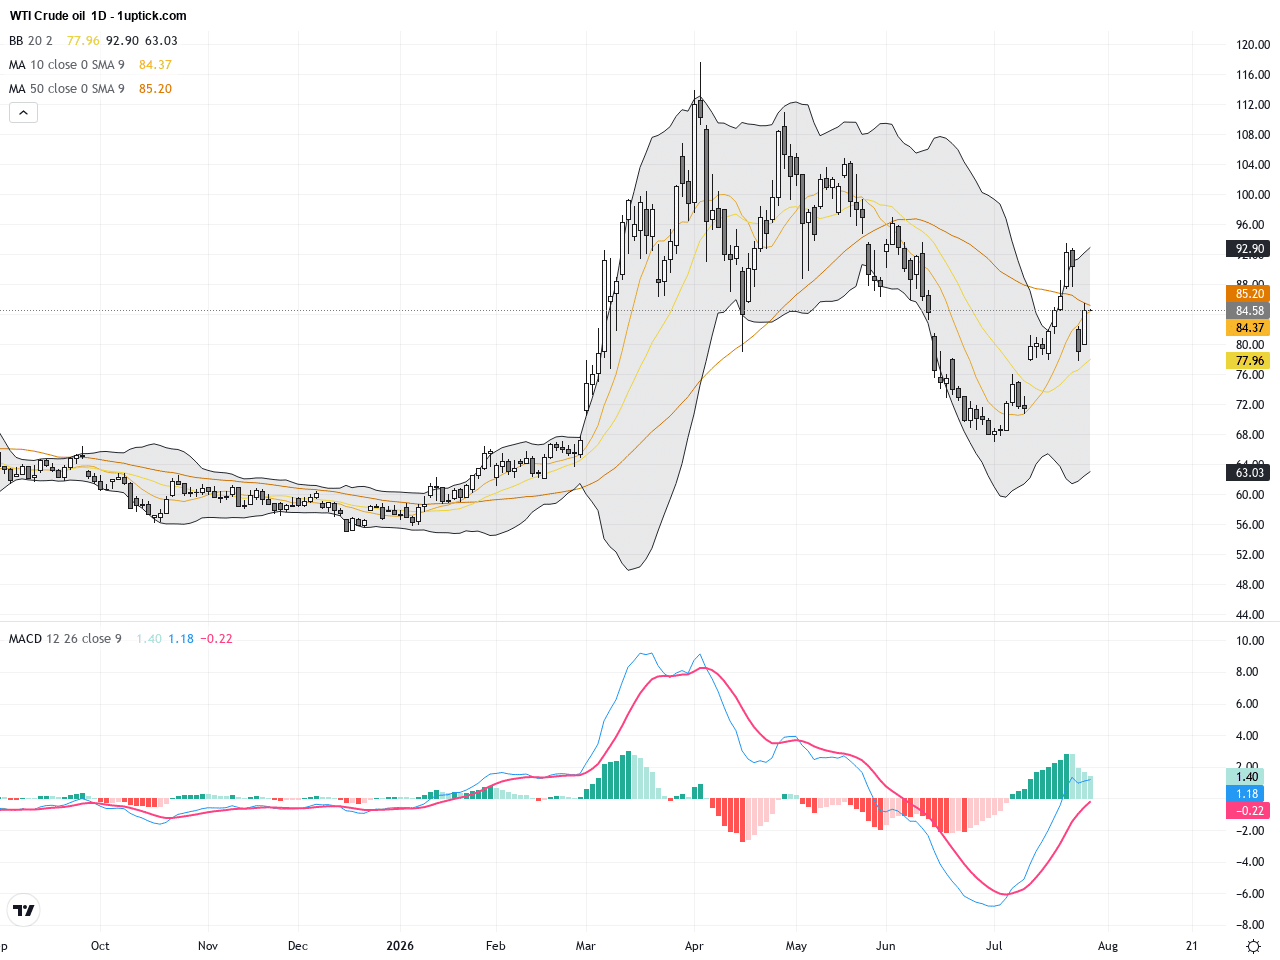
The daily chart reveals a steady uptrend in WTI Crude since mid-July, climbing from around $73 towards recent highs near $85. The short-term moving average (e.g., 20-day MA) has crossed above the longer-term 50-day MA, signaling bullish momentum. Bollinger Bands show price action near the upper band, reflecting strong buying pressure but cautioning about potential overextension. The MACD trend remains positive, supporting continuation of the uptrend, though several resistance levels ahead could challenge further gains.
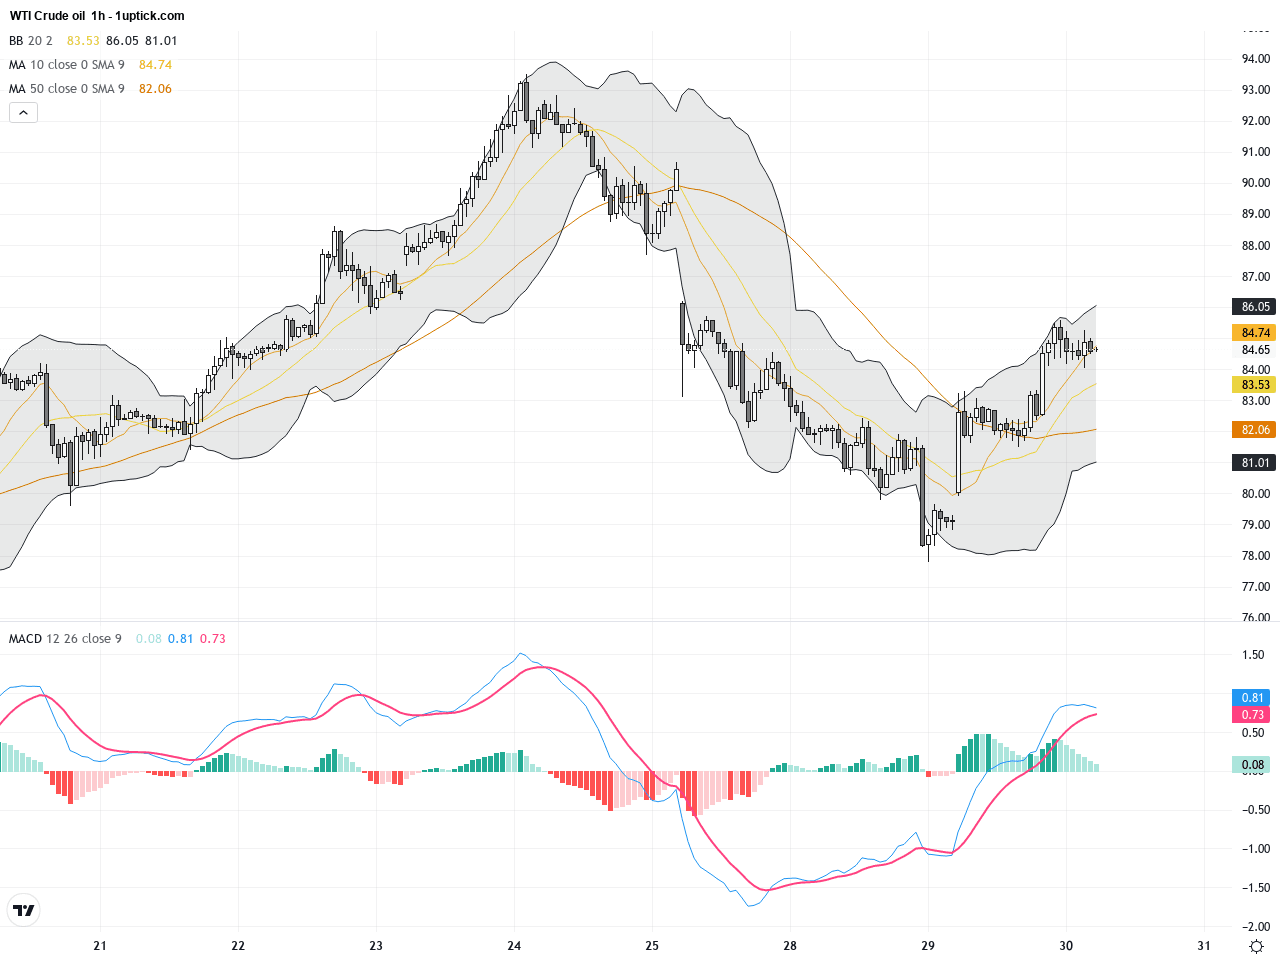
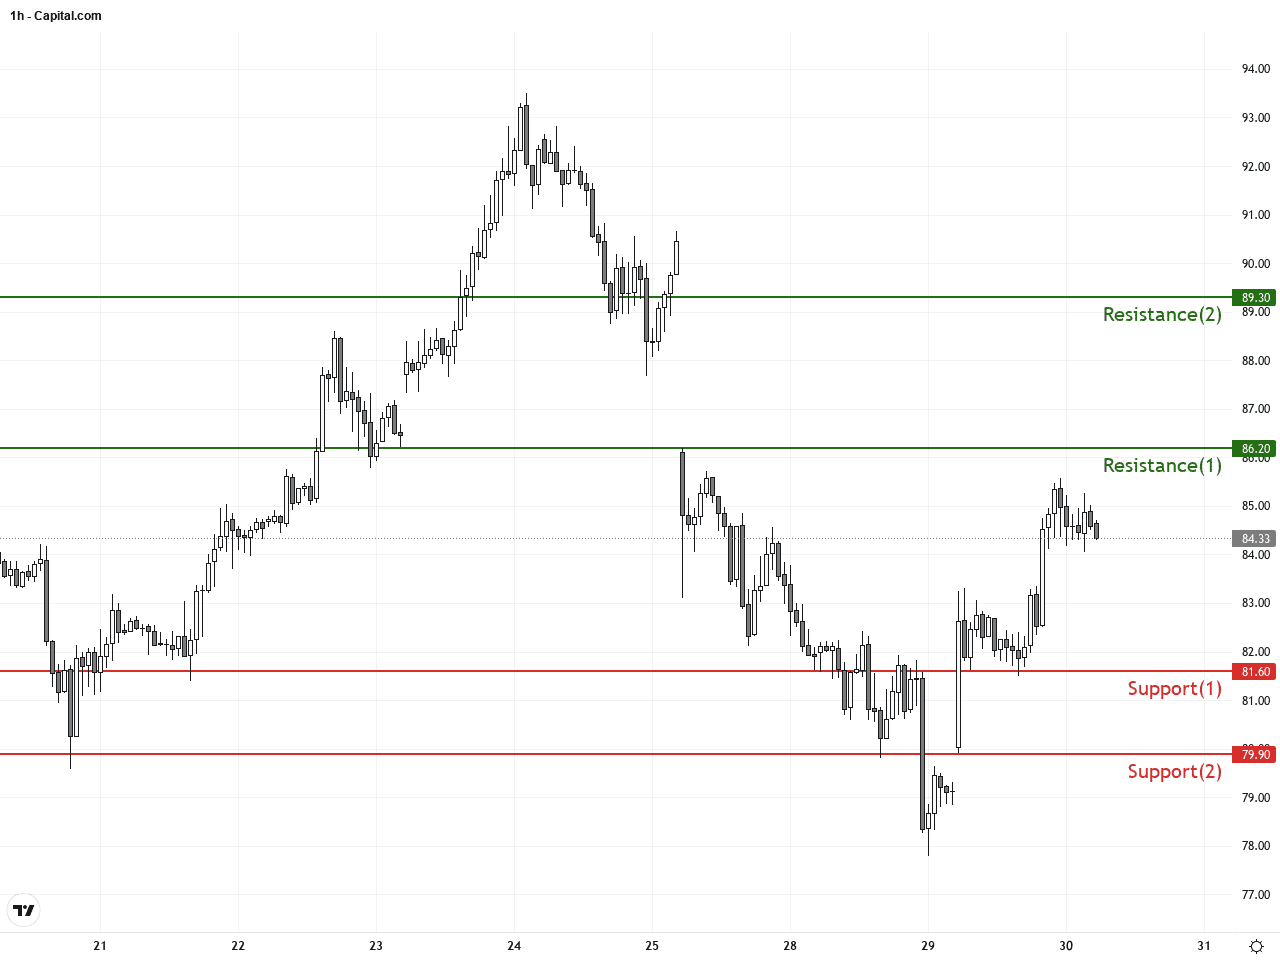
The hourly chart over the past 5 days shows a sharp recovery from $78 to nearly $85. Momentum indicators like the MACD have formed a bullish crossover, and RSI is approaching overbought territory near 70. Bollinger Bands have widened, indicating increased volatility. Notably, a bullish engulfing candlestick pattern recently formed, suggesting potential for further gains in the near term, but the high RSI also flags a possible short-term pullback. Traders should watch key support and resistance closely to confirm trend shifts.
Technical Trend: Trend status: Clearly bullish but prone to short-term volatility and consolidation.
Technically, the WTI Crude Oil market is currently in a pronounced bullish phase, confirmed by moving averages and expanding MACD momentum. However, as prices near historical resistance zones, there is risk of consolidation or short-term pullbacks. The hourly RSI in the overbought range and a recent bullish engulfing candle suggest traders watch momentum closely over the next 24 hours. Volume trends indicate strong market interest at these levels, highlighting critical areas for potential breakout or retracement trades.Today’s economic calendar features no major events with direct impact on WTI Crude Oil prices. Market participants should continue to monitor geopolitical developments and US policy for potential influences on the energy sector.
Resistance & Support
Run Live WTI Crude Oil Analysis
The above financial market data, quotes, charts, statistics, exchange rates, news, research, analysis, buy or sell ratings, financial education, and other information are for reference only. Before making any trades based on this information, you should consult independent professional advice to verify pricing data or obtain more detailed market information. 1uptick.com should not be regarded as soliciting any subscriber or visitor to execute any trade. You are solely responsible for all of your own trading decisions.