






 |
| Gold V.1.3.1 signal Telegram Channel (English) |
AUDUSD: Key Resistance Holds as Short-Term Volatility Looms in Aussie-Dollar, July 31, 2026
2026-07-31 @ 06:01
Over the past 24 to 48 hours, AUD/USD has faced noticeable selling pressure, closing yesterday at 0.70267. The sharp selloff in Asian technology stocks damaged risk appetite, causing the Australian dollar to slide and fail to break above the 38.2% Fibonacci resistance, ultimately falling to around 0.6970. This rapid downward movement was driven mainly by heightened market caution ahead of the upcoming Federal Open Market Committee (FOMC) meeting and Australia’s quarterly Consumer Price Index (CPI) release. Expectations that the Federal Reserve may maintain a hawkish stance have strengthened the US dollar, weighing on the AUD despite some support from robust Australian employment figures.
For the average investor, this means the Australian dollar’s recent performance is being tugged by global risk sentiment and major economic data releases. Market volatility tends to spike and price pullbacks are common ahead of critical policy decisions and inflation reports. Therefore, investors holding or considering trading AUD/USD should pay close attention to these events, as sudden shifts in sentiment can lead to amplified price swings and potential losses.
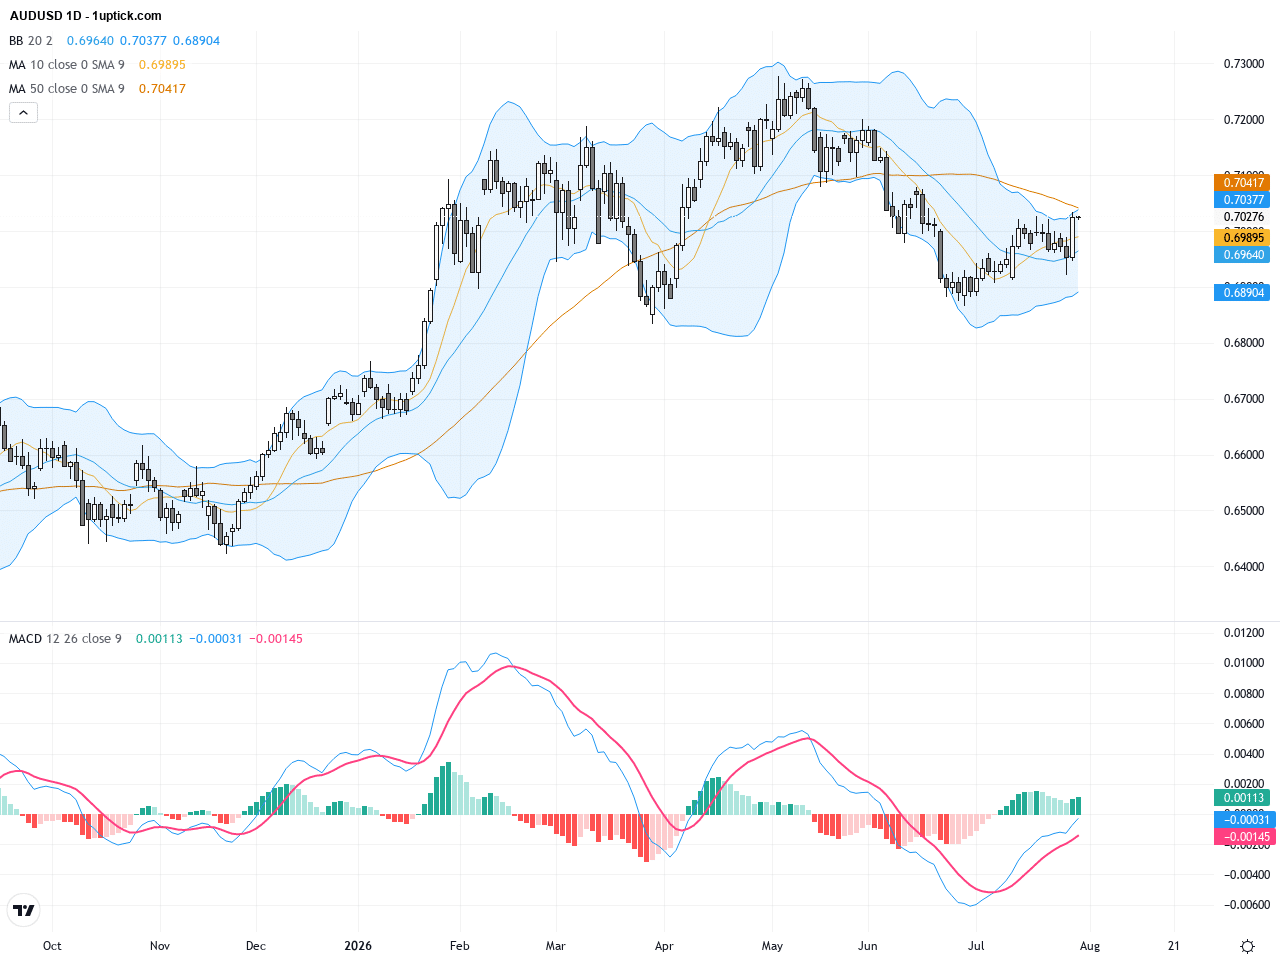
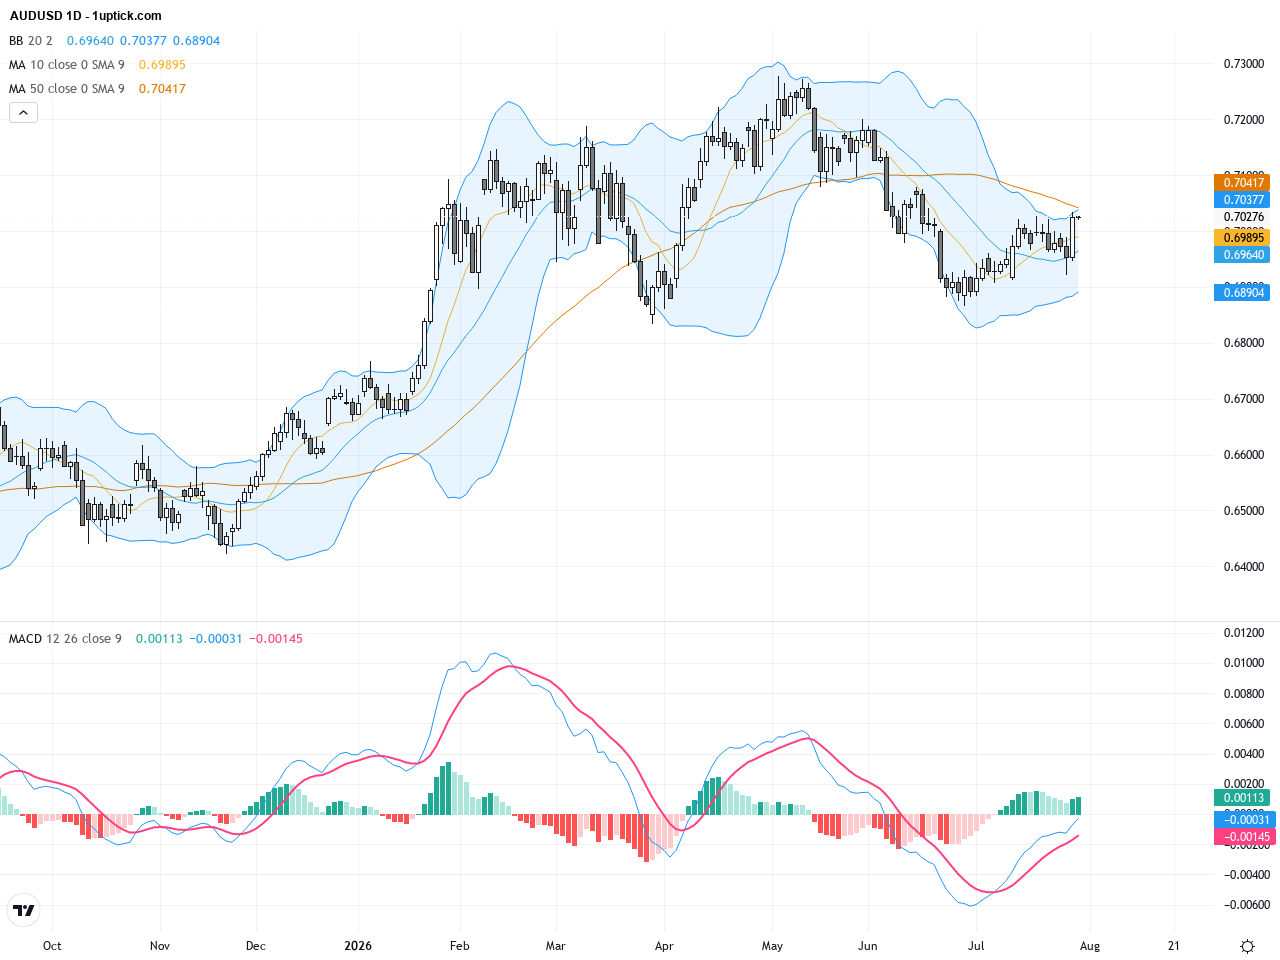
The daily chart reveals a steady uptrend in AUDUSD, with prices recovering from early-year lows and outperforming the 50-day (approx. 0.7017) and 200-day (approx. 0.6893) moving averages, confirming underlying bullish momentum. However, price action stalled around 0.7035, failing to sustain a close above this resistance, resulting in sideways consolidation. Bollinger Bands are contracting, signaling reduced volatility but a potential breakout ahead. The MACD histogram continues to shrink, indicating fading momentum as buyers and sellers momentarily equalize.
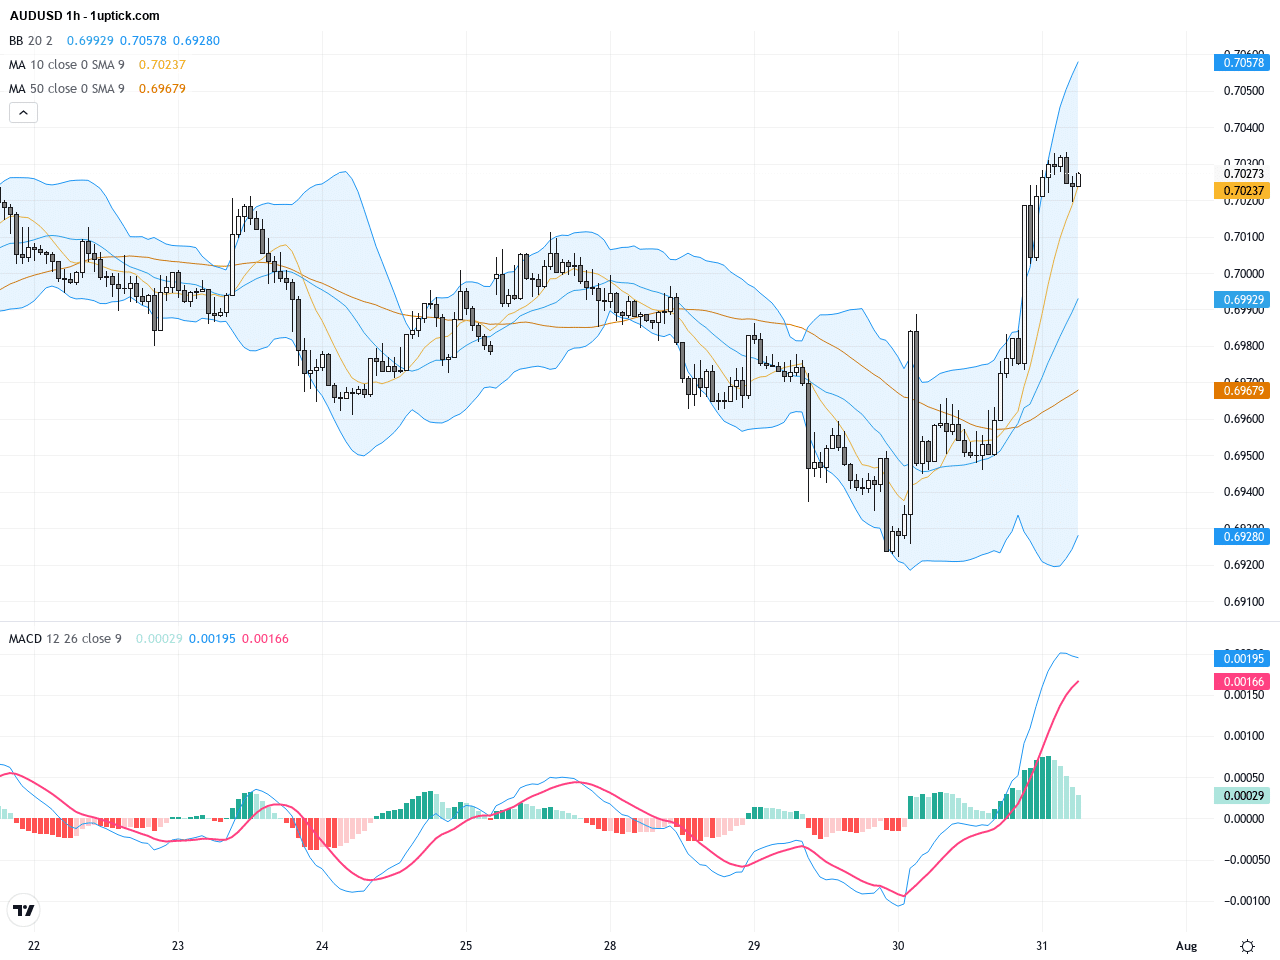
On the hourly timeframe, AUDUSD has experienced amplified swings over the past 3-5 days, dipping to near 0.6950 before rebounding. The price oscillates around the 50-hour moving average, with Bollinger Bands widening slightly, indicating increased short-term volatility. MACD bars are shrinking towards the zero-line, signaling weakening momentum without a decisive reversal. A descending flag pattern has formed recently, suggesting a cautious outlook as traders await clearer direction.
Technical Trend: Currently, AUDUSD is in a cautious sideways consolidation, exhibiting mild bearish pressure short-term but maintaining a gentle bullish bias over the medium term. Market direction hinges on imminent economic events and risk appetite shifts.
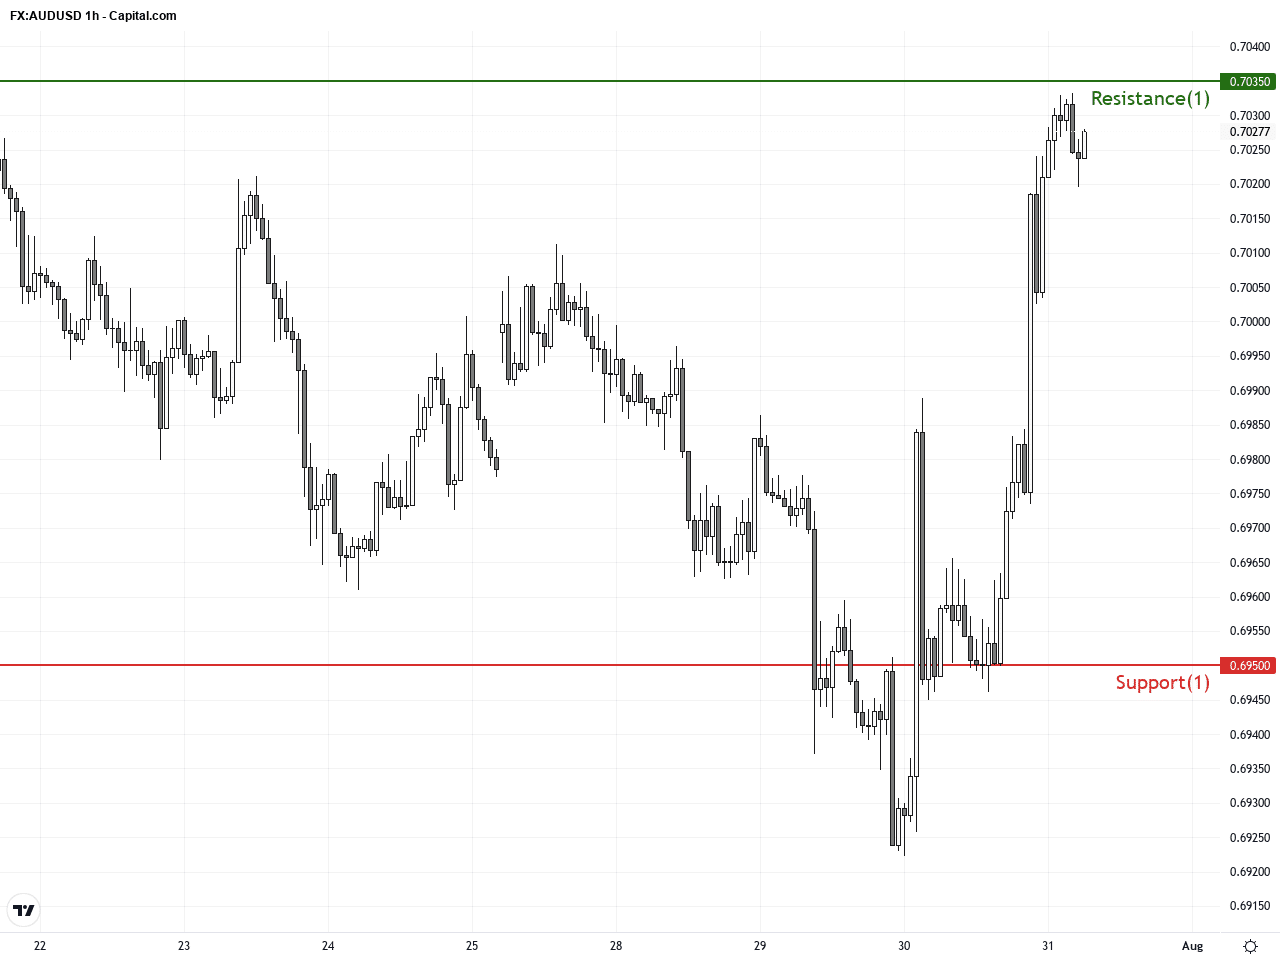
From a technical perspective, AUDUSD is encountering resistance at 0.7035-0.7040, repeatedly failing to close above this hurdle while testing support near 0.6950. Momentum indicators like MACD and RSI suggest weakening bullish energy. The emerging descending flag and recent bearish engulfing candlestick hint at near-term downside risk. Traders should monitor this consolidation range alongside upcoming CPI and Fed meeting developments for possible breakout opportunities.Today’s economic calendar features key Japanese data including the Bank of Japan’s rate decision and Tokyo CPI figures, potentially influencing the broader Asia-Pacific currency complex. However, there are no directly significant Australian or US economic releases expected during the main trading hours relevant to AUDUSD. Australia’s Producer Price Index for Q2 is scheduled early but is unlikely to spur major moves unless markedly different from forecasts. US events such as the University of Michigan Consumer Sentiment report later in the day could impact USD strength and thus AUDUSD indirectly.
Resistance & Support
The above financial market data, quotes, charts, statistics, exchange rates, news, research, analysis, buy or sell ratings, financial education, and other information are for reference only. Before making any trades based on this information, you should consult independent professional advice to verify pricing data or obtain more detailed market information. 1uptick.com should not be regarded as soliciting any subscriber or visitor to execute any trade. You are solely responsible for all of your own trading decisions.