

 |
| Gold V.1.3.1 signal Telegram Channel (English) |
EURUSD Technical & Fundamental Analysis: Key Resistance to Watch Amid Fed Pause Volatility, July 31, 2026
2026-07-31 @ 09:01
Over the past 24 to 48 hours, the EUR/USD currency pair experienced notable volatility primarily driven by developments around the Federal Reserve’s rate decision. The pair closed yesterday at 1.15182, with an intraday spike reaching 1.14306 as traders reacted to the Fed’s pause in rate hikes. According to Citi’s latest forecast, the reduced likelihood of additional Fed rate increases has capped the Dollar’s upward potential, providing near-term support for the Euro.
The Fed’s policy announcement was pivotal this week, prompting investors to reassess the US Dollar’s outlook. As geopolitical tensions ease and inflation concerns soften, the Euro benefited from a more constructive environment. For everyday investors, this signals limited near-term Dollar strength and a possible rebound for EUR/USD, highlighting trade opportunities grounded in fundamental developments rather than short-lived technical moves.
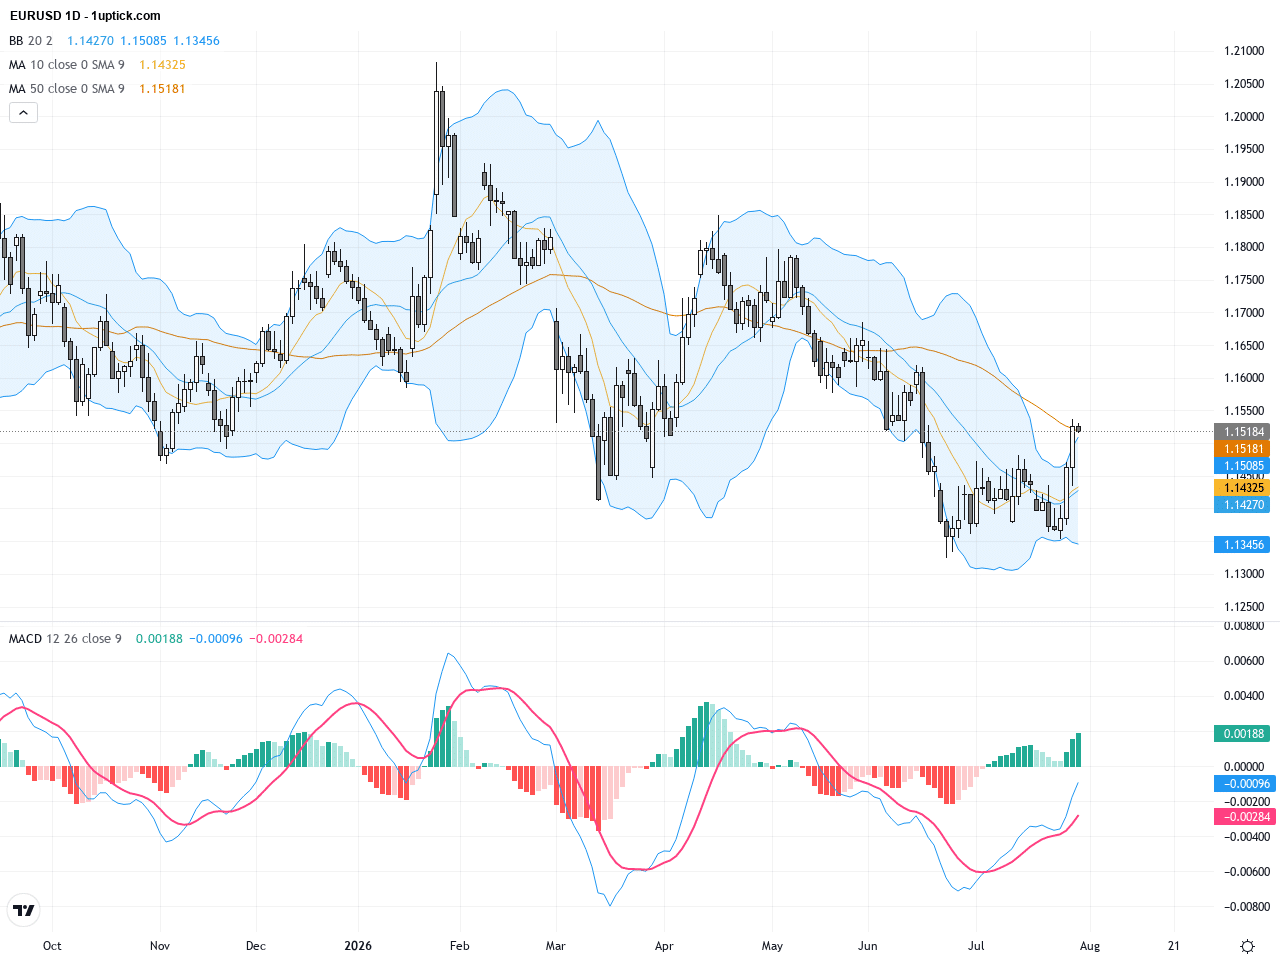
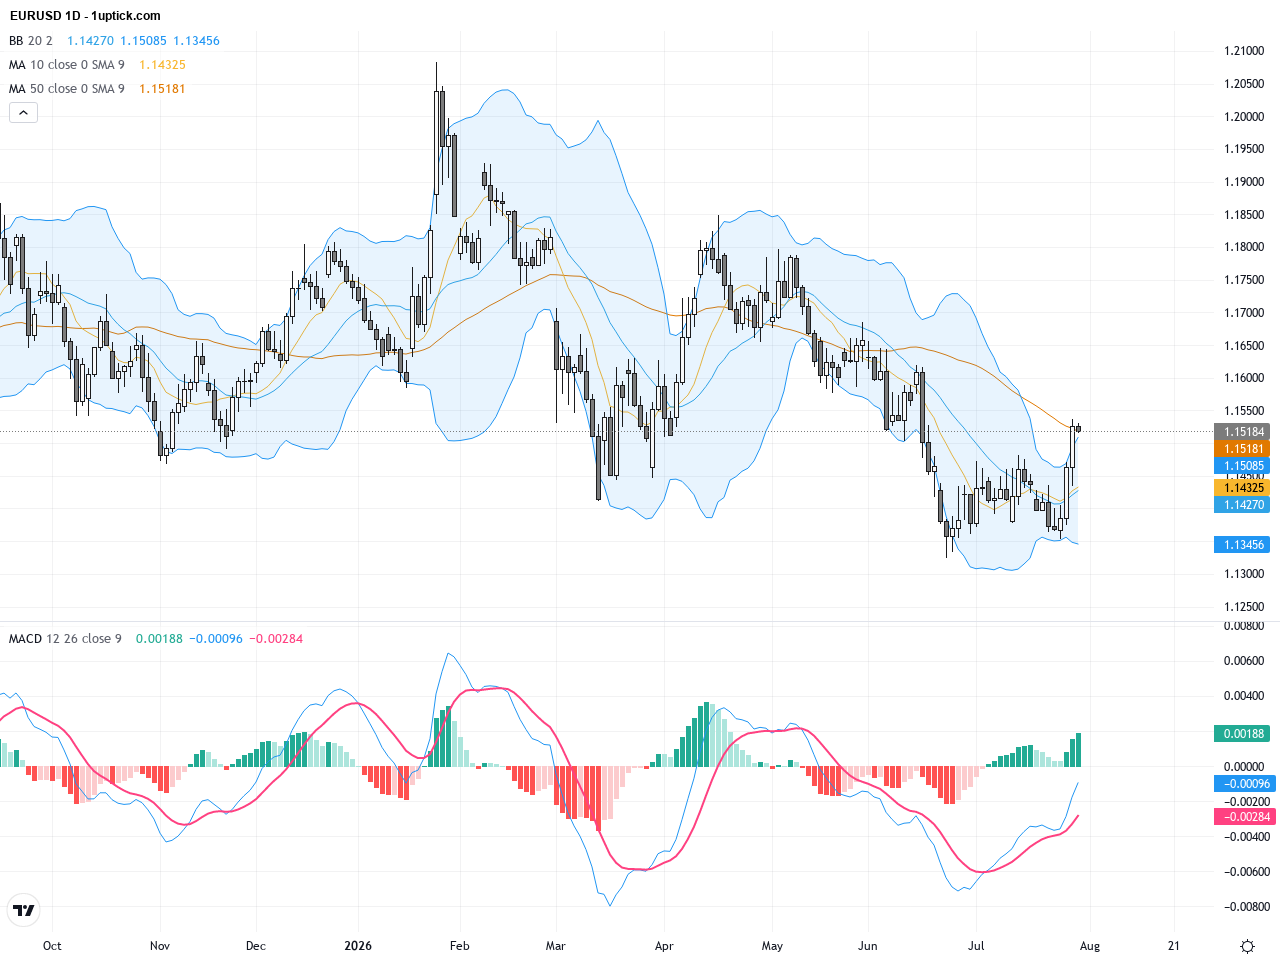
The daily chart reveals EURUSD in a consolidating decline phase, oscillating between 1.14 and 1.16. The 50-day moving average at 1.1489 lies below the 200-day at 1.163, indicating underlying bearish pressure. Bollinger Bands are tightening, signaling reduced volatility and a potential imminent breakout. The MACD is trending downward with a slower moving average crossing below the fast one, but slight signs of possible reversal exist. Overall, the daily timeframe suggests a wait-and-see phase, with traders watching for a clear break above resistance or below key support levels.
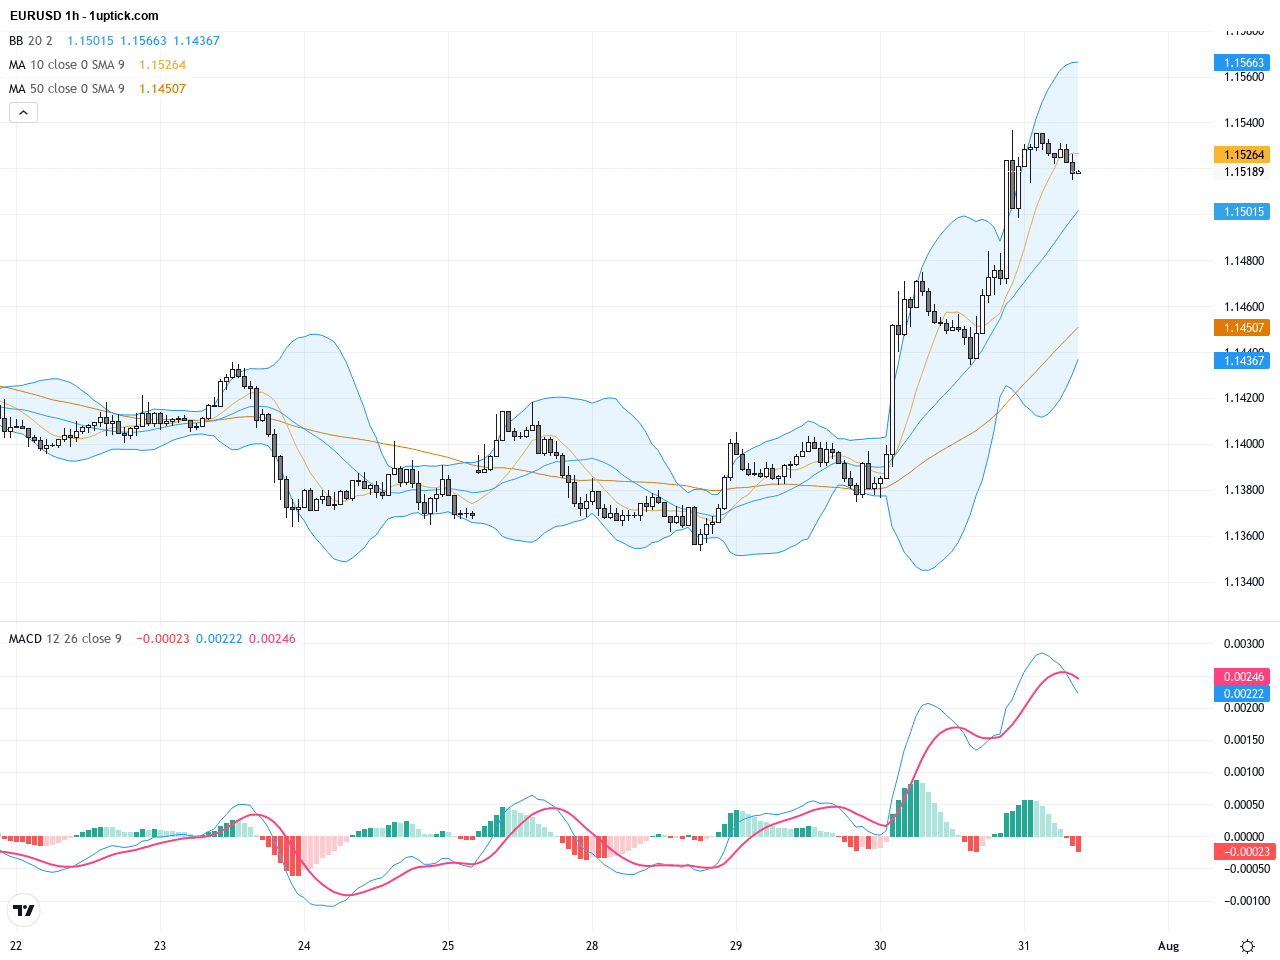
On the hourly chart, notable volatility dominates the last 3-5 days, with prices testing support around 1.1450 multiple times and forming an expanding wedge pattern. The 50-hour moving average near 1.1490 has seen repeated price tests with limited sustained breakouts, showing choppy short-term price dynamics. Recently, the MACD formed a slight bullish crossover, hinting at tentative momentum recovery, supported by candlestick hammer patterns signaling buying interest at lower levels. A sustained close above 1.15 would bolster short-term bullish prospects.
Technical Trend: EURUSD is currently in a cautiously neutral trend with a slight bullish bias over the near term.
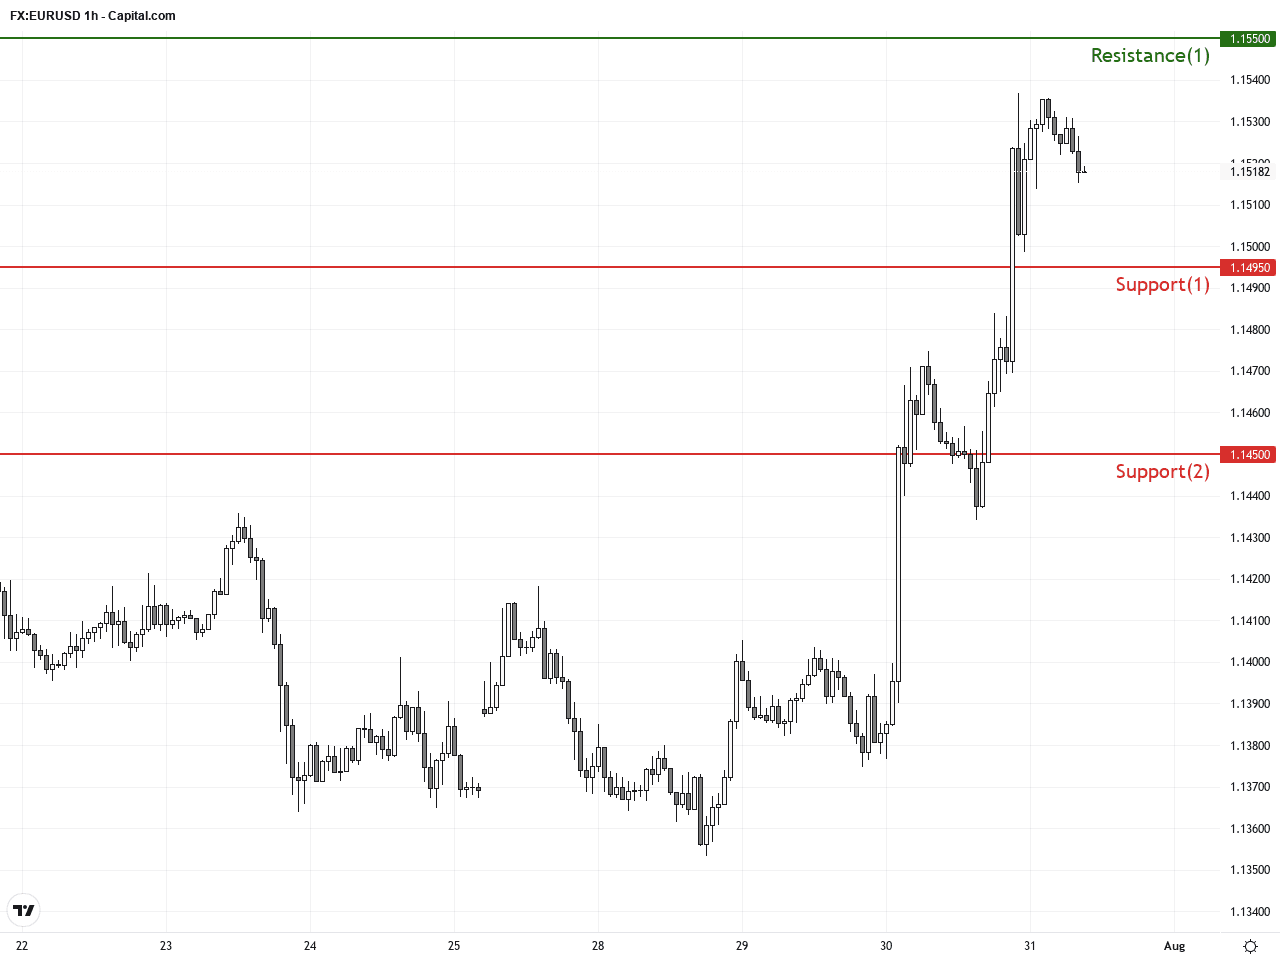
Technically, the EURUSD is supported by the expanding wedge pattern and key support zones, although the daily bullish momentum is not yet firmly established. The hourly chart’s hammer candlesticks combined with a possible MACD bullish crossover suggests buyers are stepping in, presenting a tactical entry opportunity. The main risk lies in the daily Bollinger Bands’ tight compression, which could lead to a sharp breakout in either direction. Traders should watch the 1.1520 and 1.1450 range carefully for cues.Today’s GMT+1 economic calendar is highlighted by the Bank of Japan rate decision and press conference, along with other Japanese and global indicators that have no direct impact on the EURUSD pair. There is no major Eurozone or US data scheduled for the day that would immediately influence EURUSD pricing. However, upcoming European CPI data and later US consumer confidence reports could provide volatility triggers later in the session.
Resistance & Support
The above financial market data, quotes, charts, statistics, exchange rates, news, research, analysis, buy or sell ratings, financial education, and other information are for reference only. Before making any trades based on this information, you should consult independent professional advice to verify pricing data or obtain more detailed market information. 1uptick.com should not be regarded as soliciting any subscriber or visitor to execute any trade. You are solely responsible for all of your own trading decisions.