

 |
| Gold V.1.3.1 signal Telegram Channel (English) |
USDJPY Technical & Fundamental Analysis: Key Resistance and Support Levels Post Yen Intervention, August 7, 2026
2026-08-07 @ 11:01
Over the past 24 to 48 hours, the USDJPY exchange rate has shown modest fluctuations, closing near 158.37 with relative stability. The market’s key focus is on the first coordinated FX intervention by Japan and the US since 1998, where both countries jointly injected approximately 13.8 trillion yen to support the yen and stem its depreciation. This intervention has drawn significant attention as investors watch whether it can stabilize the yen in the long term or merely produce a short-lived effect.
Meanwhile, robust US economic data and rising global crude prices have boosted the dollar, nudging USDJPY slightly higher. However, many FX strategists and economists remain skeptical about the long-term efficacy of the intervention, citing challenges to the dollar’s global dominance. Investors now face a crossroads, weighing whether the historical intervention patterns will repeat or if a new market regime is emerging.
For the average investor, this round of yen intervention versus dollar strength resembles a balancing act amid market turbulence. Short-term exchange rate moves remain unpredictable, so keen attention to policy directions in both countries and economic data releases is essential for making informed investment decisions.
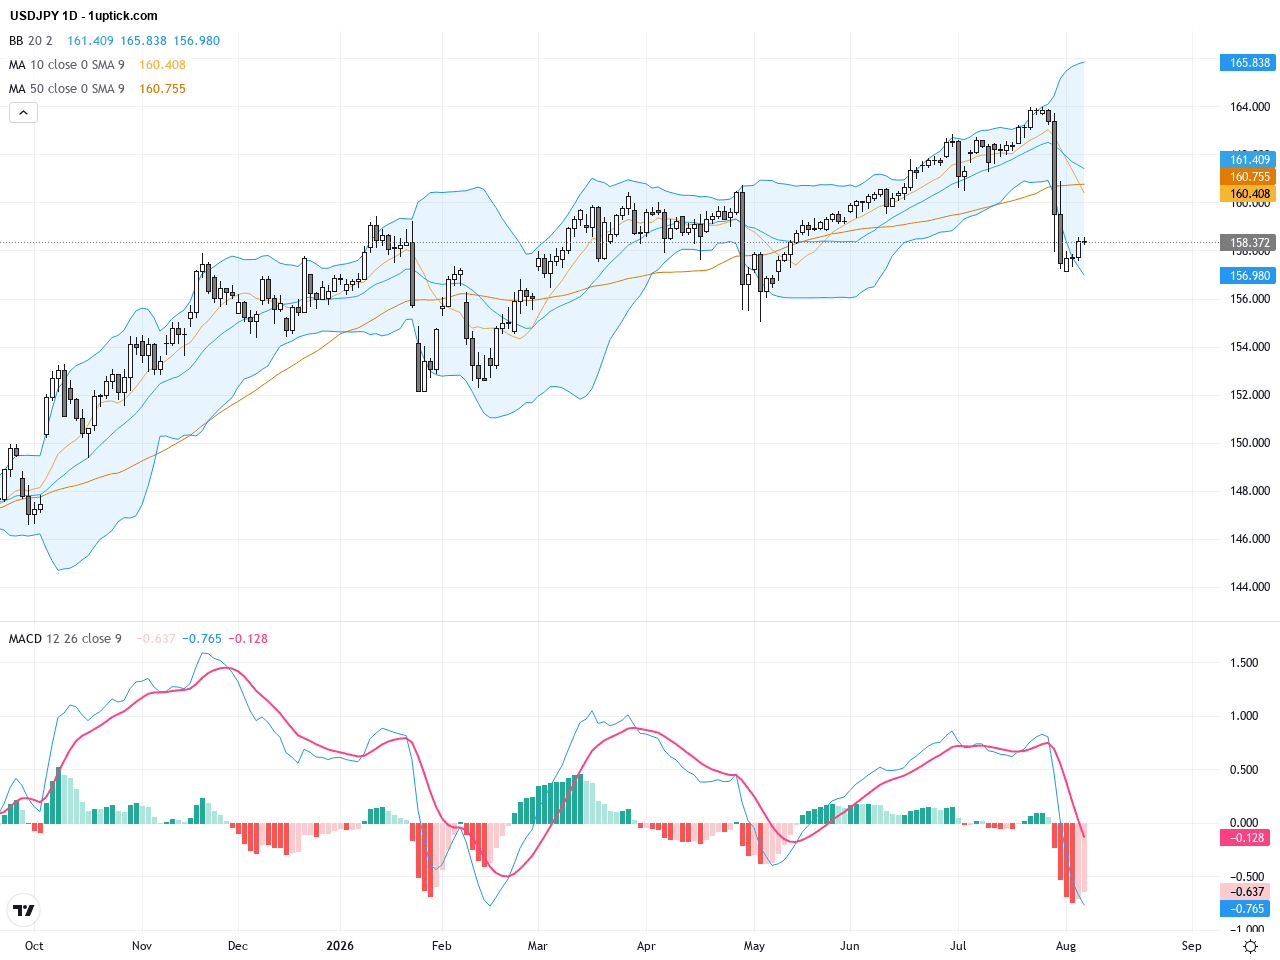
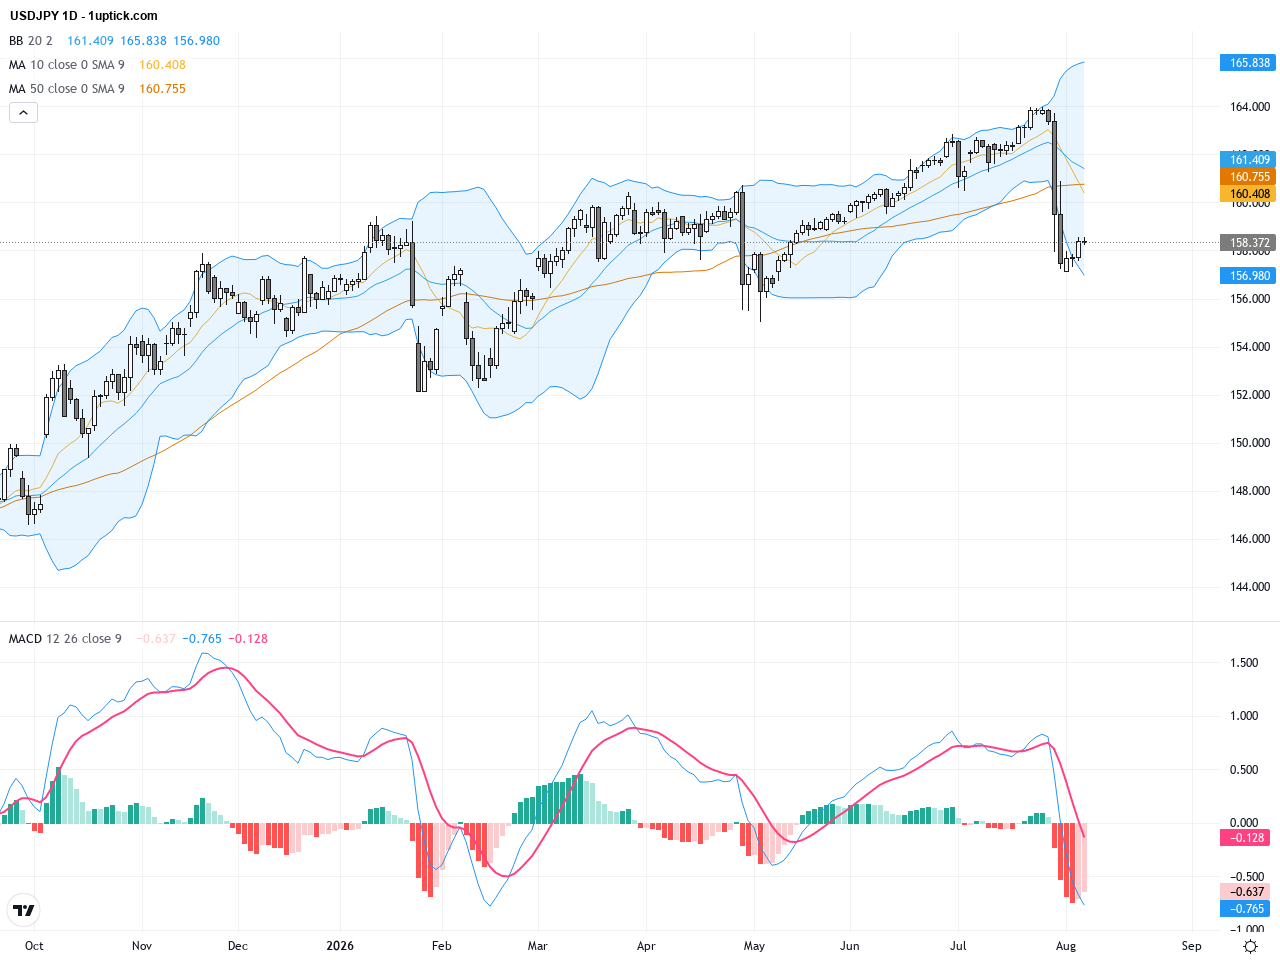
The daily chart shows that over the past month, USDJPY traded above the 160 level before pulling back towards the 158-159 range following yen intervention news. The 200-day moving average near 157.95 acts as a key support, with price hovering slightly above, indicating that the longer-term uptrend remains intact but short-term downside pressure is evident. Bollinger Bands are converging, signaling potential upcoming price breakout. MACD oscillates close to the zero line, reflecting balanced momentum without a clear trend reversal yet.
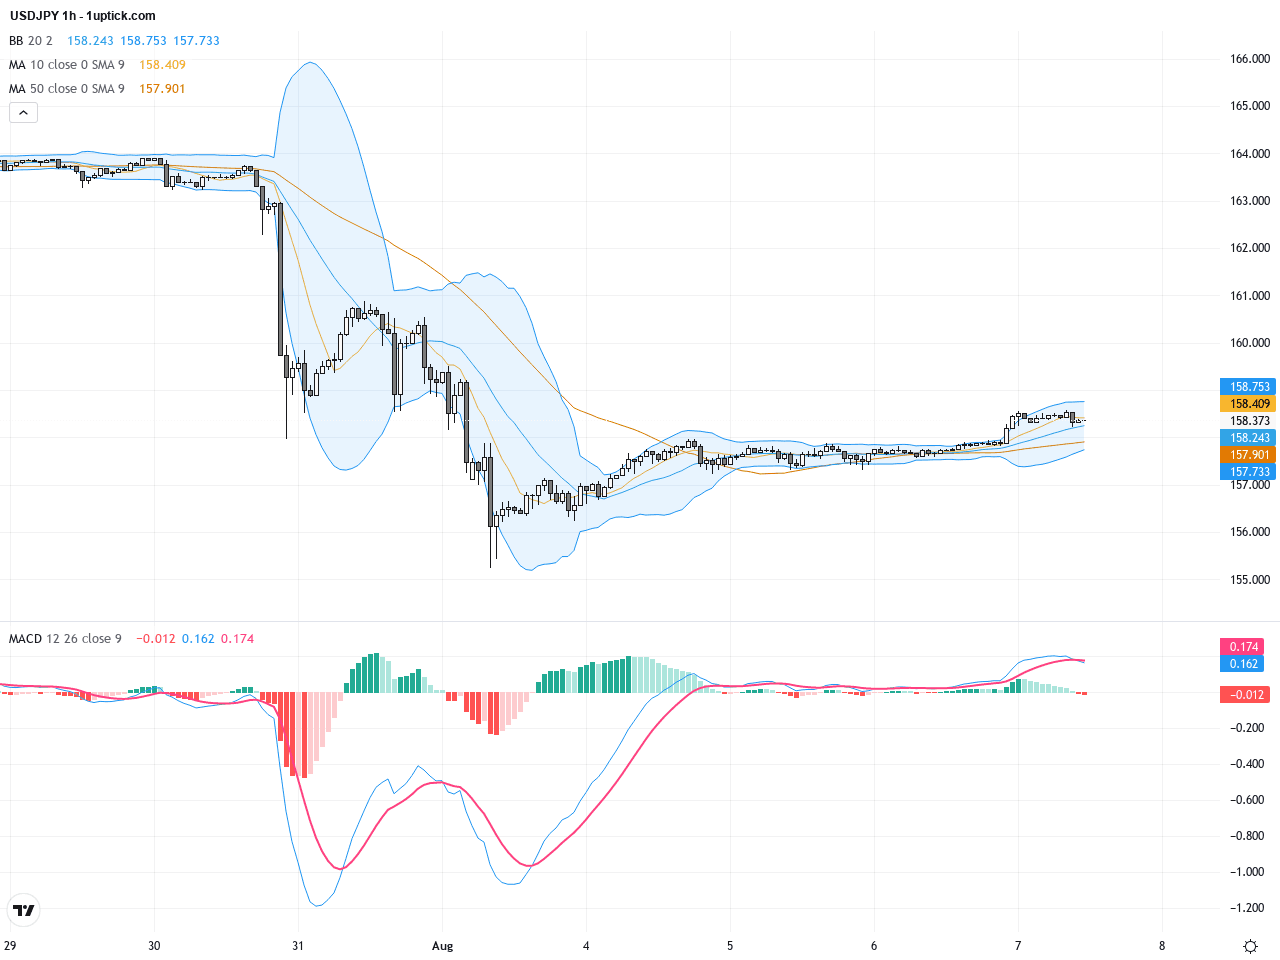
The hourly chart over the last 3-5 days reveals a short-term consolidation phase with prices oscillating between 158.2 and 158.6. The 50 and 200-period moving averages are near convergence, hinting at a potential shift in direction. Narrowing Bollinger Bands suggest reduced volatility, while a slight bullish MACD divergence points to possible short-term upside. A flag pattern has formed intraday, and a breakout above resistance may offer a trading opportunity for short-term bulls.
Technical Trend: USDJPY is currently in a cautious consolidation phase with an overall marginally bullish bias, best described as ‘Cautiously Bullish Consolidation.’
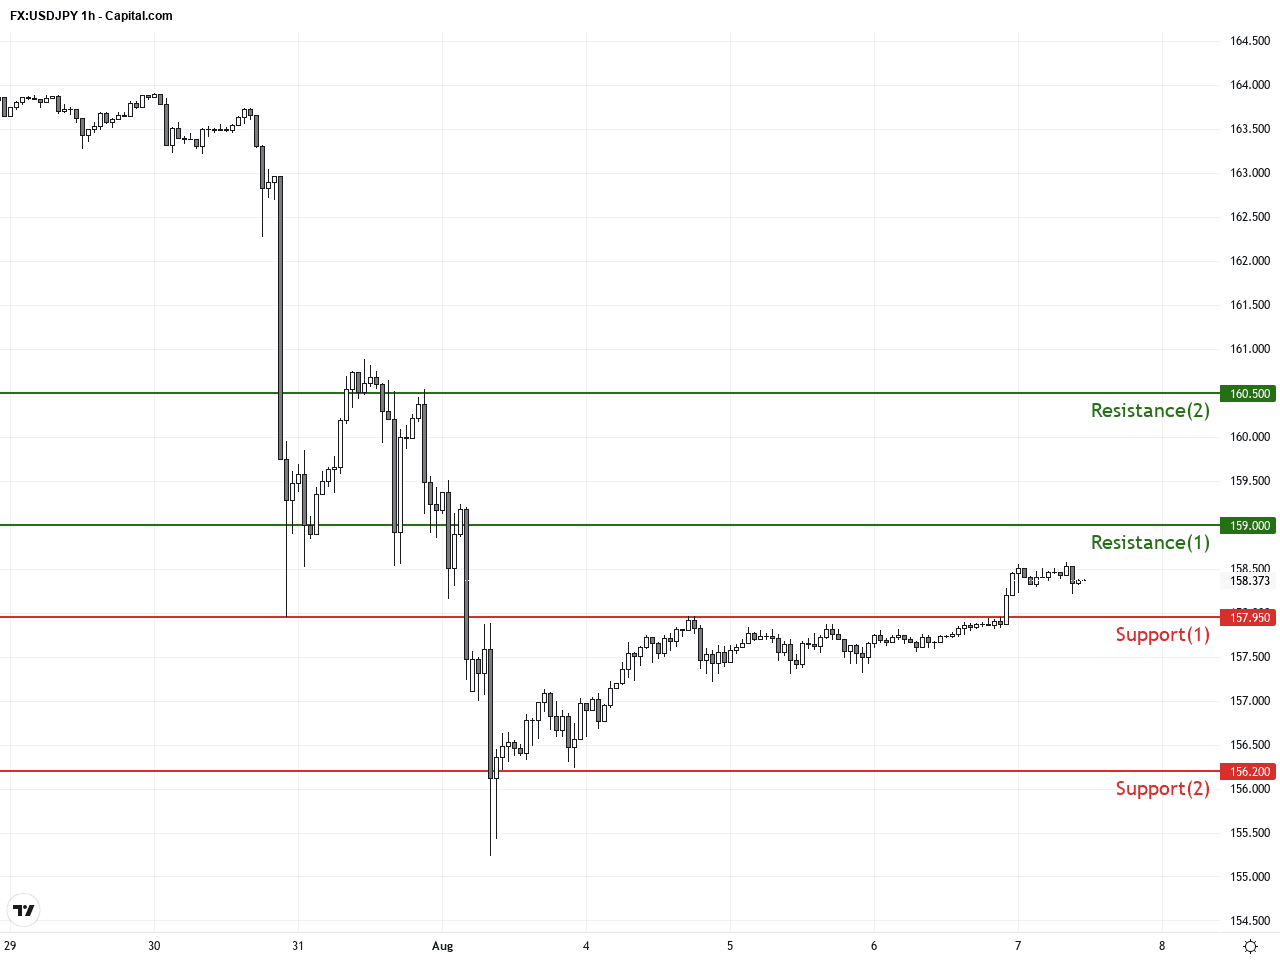
Technically, the daily chart highlights critical support around 157.95 (200-day MA), breach of which could lead to deeper declines. Hourly MACD and RSI reveal bullish divergence, suggesting a possible bottoming and short-term rebound. Price remains range-bound between 157 and 159, with yen intervention risks and U.S. data release timing key influences. High risk stems from failed intervention potentially exacerbating volatility.Today’s economic calendar includes key U.S. releases at 14:30 GMT+1, notably July’s Non-Farm Employment Change, forecast at 80,000 jobs added, and the Unemployment Rate steady at 4.2%. This is the most impactful event for USDJPY, where stronger-than-expected data could bolster the USD and push USDJPY higher, while weaker figures may pressure the pair downward. Japan’s June household spending showed a decline, underscoring domestic demand weakness and a limited near-term yen support. Overall, the USD maintains a bias for strength, but traders should watch for market reactions closely.
Resistance & Support
The above financial market data, quotes, charts, statistics, exchange rates, news, research, analysis, buy or sell ratings, financial education, and other information are for reference only. Before making any trades based on this information, you should consult independent professional advice to verify pricing data or obtain more detailed market information. 1uptick.com should not be regarded as soliciting any subscriber or visitor to execute any trade. You are solely responsible for all of your own trading decisions.