



 |
| Gold V.1.3.1 signal Telegram Channel (English) |
USDCAD Faces Critical Resistance at 1.4000: Technical Trading Outlook and Key Levels, August 11, 2026
2026-08-11 @ 13:01
Over the past 24 hours, the USD/CAD exchange rate showed a downward trend, closing yesterday at 1.39307, a slight decline of 0.063% from the previous day. Investors closely monitored developments in the Middle East alongside the upcoming key U.S. economic data releasing this week, which impacted market sentiment. Despite oil prices remaining relatively stable, the interplay between the dollar and oil markets introduced volatility to the exchange rate.
The recent market focus has been on the lack of a deal between the U.S. and Iran, causing oil prices to rally about 5%, while the U.S. Dollar Index edged up modestly. As a result, USD/CAD faces downside risk, especially below the significant psychological level of 1.4000. Stronger-than-expected Canadian labor market data further boosted the Canadian dollar, putting additional pressure on the USD/CAD pair.
For the average investor, the recent exchange rate movements resemble the calm before the storm, with fluctuating oil prices and pending U.S. economic reports stirring sensitivities in the currency market. Keeping an eye on upcoming data releases is advisable, as they might become pivotal turning points for the pair’s future direction.
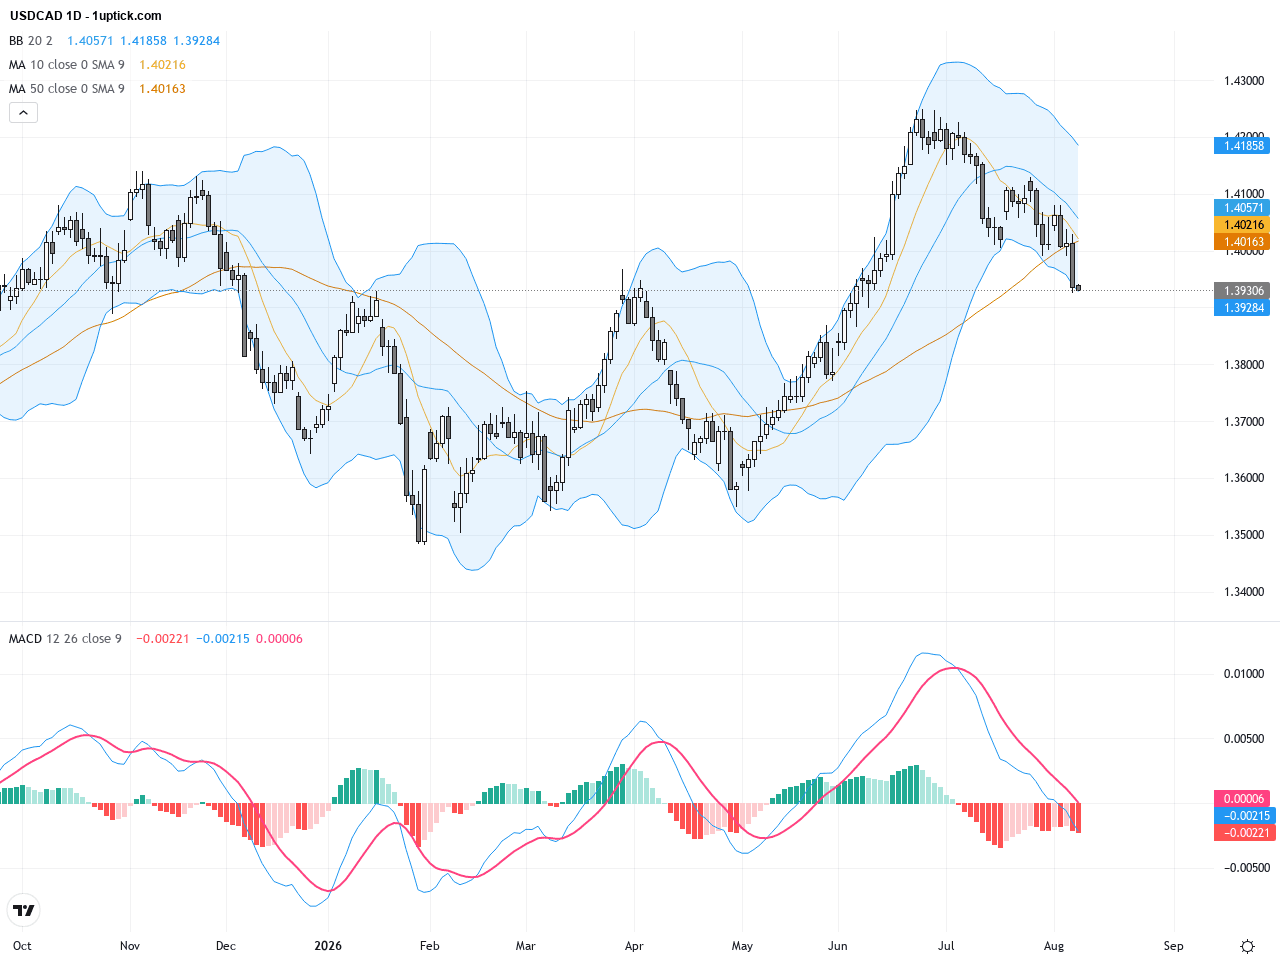
The daily chart reveals a downtrend for USDCAD since early June, with recent price action approaching the 1.39 area, forming a descending channel. Bollinger Bands suggest prices hovering near the middle band but moving closer to the lower band, indicating increasing selling pressure. The MACD has formed a bearish crossover below the zero line, confirming weakening bullish momentum. The 50-day EMA near 1.41 remains above current prices, reinforcing the bearish structure. Technical indicators collectively suggest sellers remain in control, with potential for further downside until stronger support emerges.
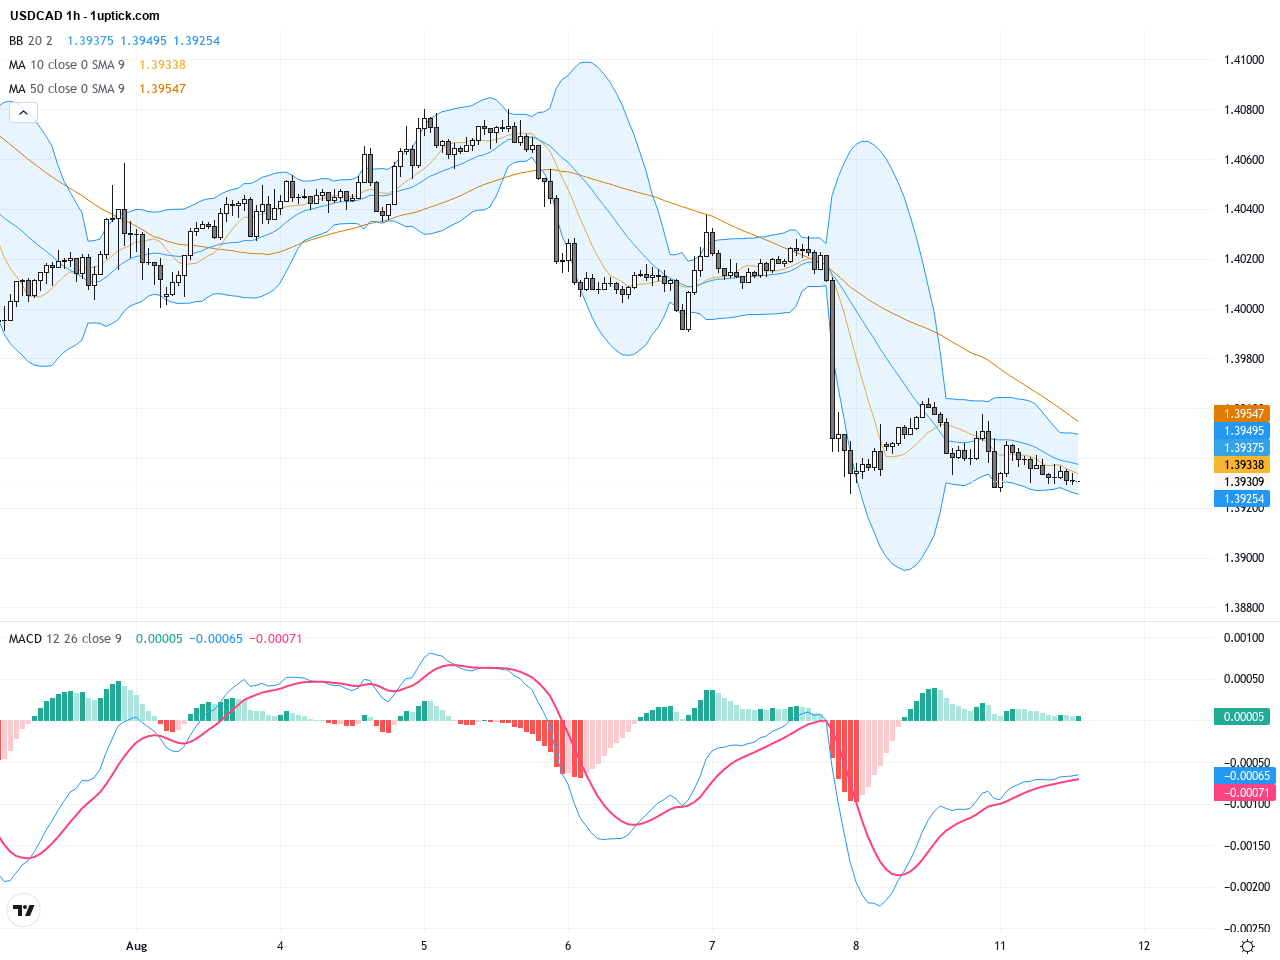
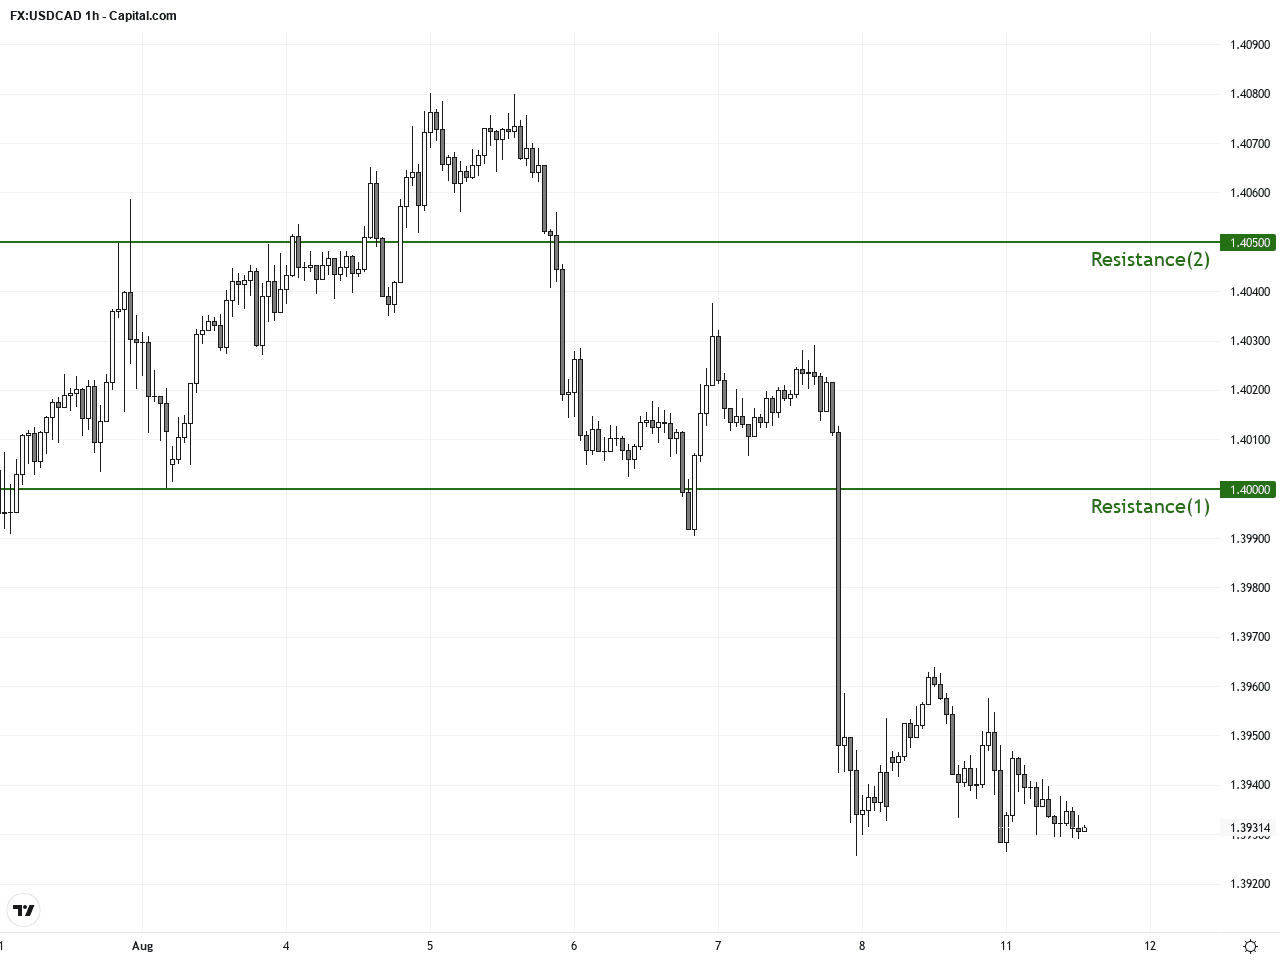
The hourly chart shows a consolidation pattern over the past 3-5 days, forming a short-term descending wedge with narrowing volatility. Bollinger Bands have contracted near the middle band, with price repeatedly testing the 1.3930-1.3950 resistance zone but failing to break higher decisively. The MACD recently crossed upward from bearish territory, signaling a possible short-term rally; however, volume has not picked up, limiting upside momentum. The latest candlestick formed a hammer with a long lower wick on the hourly chart, hinting at a possible short-term buying interest, though confirmation is needed.
Technical Trend: Cautiously Bearish
Technically, USDCAD is battling key resistance at the 1.4000 level, where bulls and bears are tightly contesting control. Daily chart indicators like the MACD bearish crossover and Bollinger Band middle resistance point towards continued bearish pressure. Conversely, the hourly descending wedge pattern and recent hammer candlestick suggest short-term rebound potential, albeit with limited momentum. A decisive break above 1.4000 with significant volume could signal trend reversal, while failure to hold above 1.39 support may accelerate downside momentum. Traders should monitor these technical signals closely to adjust exposure.Today’s GMT+1 economic calendar does not include any major economic events directly affecting either the US or Canada, hence USDCAD is unlikely to experience immediate impact from data releases. However, earlier Australian interest rate decisions and China’s monetary data may influence global risk sentiment. The key event to watch will be the US API crude oil inventory report late in the session; notable changes in oil stocks could drive oil price volatility, which would indirectly impact USDCAD prices given Canada’s role as a major oil exporter.
Resistance & Support
The above financial market data, quotes, charts, statistics, exchange rates, news, research, analysis, buy or sell ratings, financial education, and other information are for reference only. Before making any trades based on this information, you should consult independent professional advice to verify pricing data or obtain more detailed market information. 1uptick.com should not be regarded as soliciting any subscriber or visitor to execute any trade. You are solely responsible for all of your own trading decisions.