








 |
| Gold V.1.3.1 signal Telegram Channel (English) |
WTI Crude Oil: Breaking Key Resistance Signals Bullish Trading Outlook, August 11, 2026
2026-08-11 @ 06:03
Over the past 24 to 48 hours, WTI Crude Oil prices have surged significantly. Starting from the closing price of $82.13 on August 10, 2026, oil prices climbed further yesterday, reflecting heightened market concerns over geopolitical risks.
Recent market news reveals ongoing uncertainties in Iran-Oman negotiations over the Strait of Hormuz, delaying the reopening of this critical shipping route. Iran’s demands—including military withdrawal, asset unfreezing, and reparations—have prolonged the closure, tightening global supply concerns and driving prices higher. Additionally, reports indicate US oil reserves at the lowest level in 43 years, further stoking fears of supply shortages.
For the average investor, geopolitical instability typically turns energy commodities, especially crude oil, into a safe haven, pushing prices up. The worries over disrupted supply chains have prompted spikes in WTI prices over the last two days, creating notable market volatility and highlighting the latest market news that traders and investors are closely monitoring.
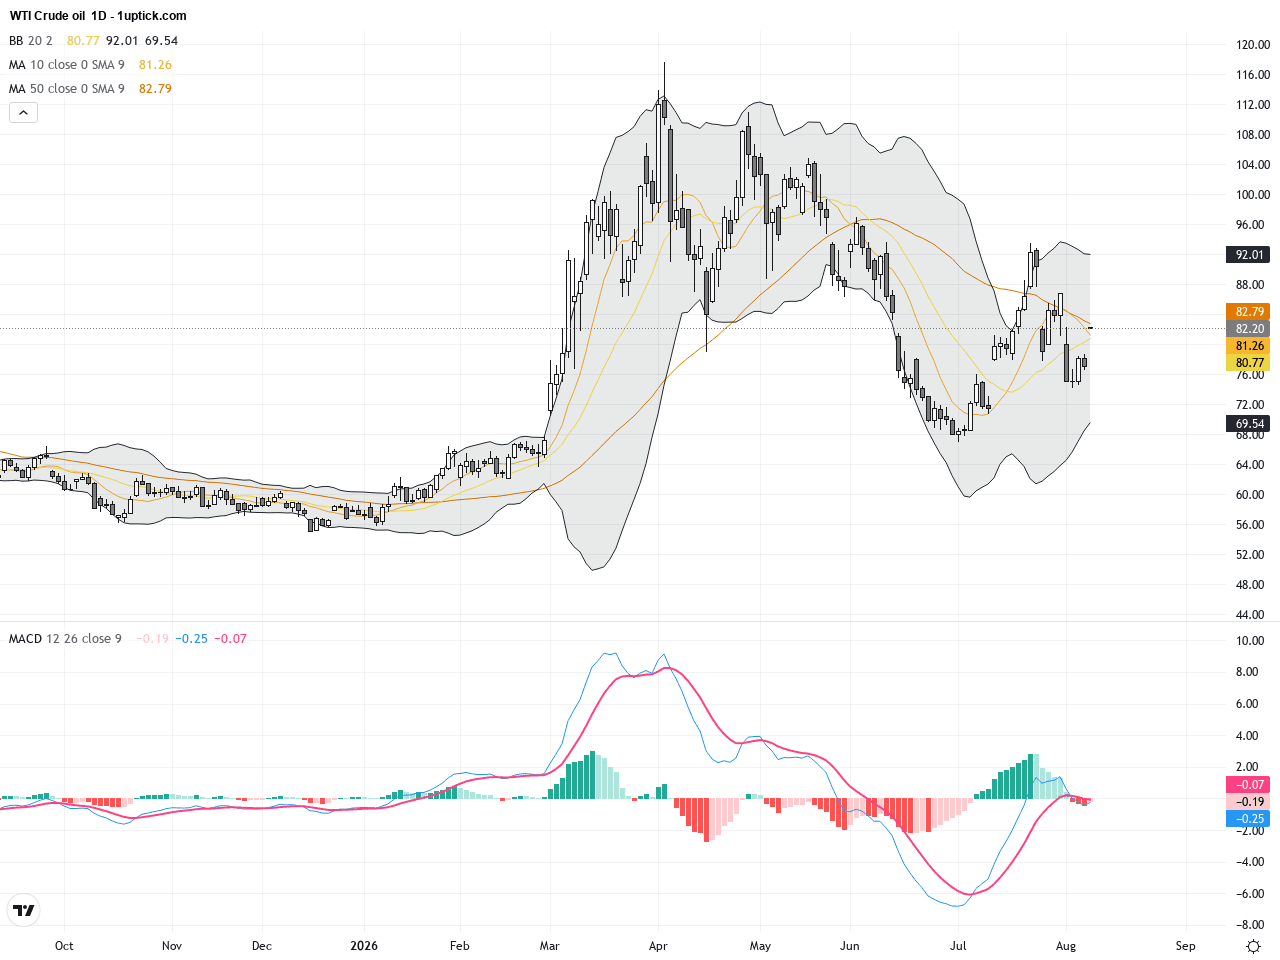
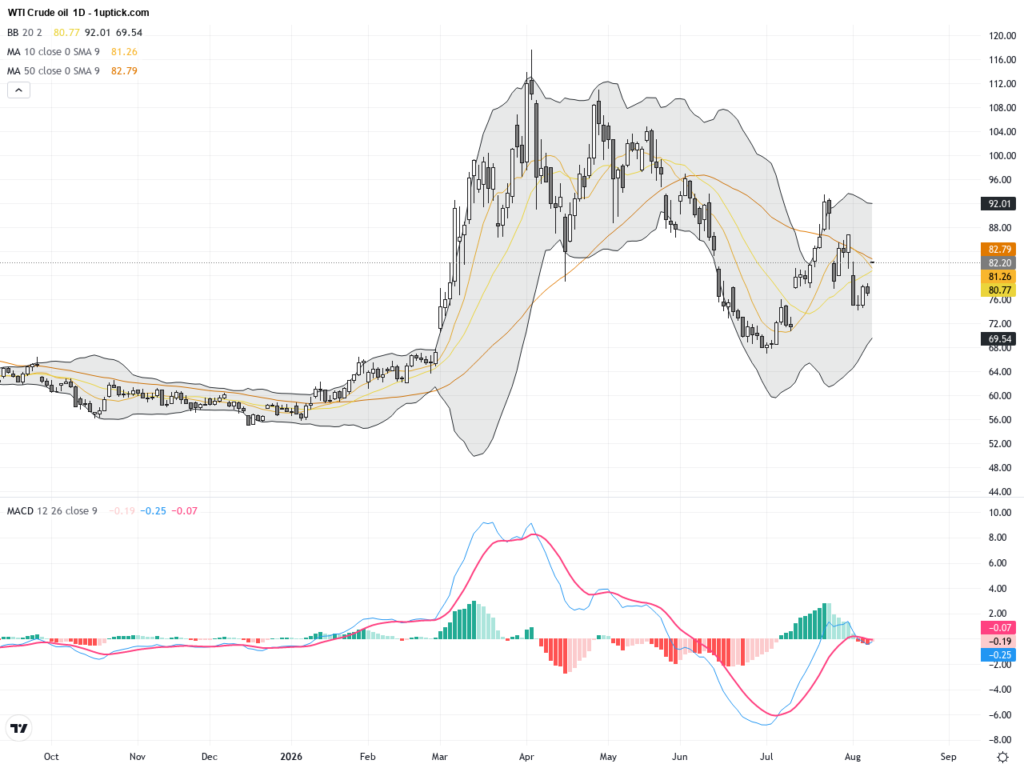
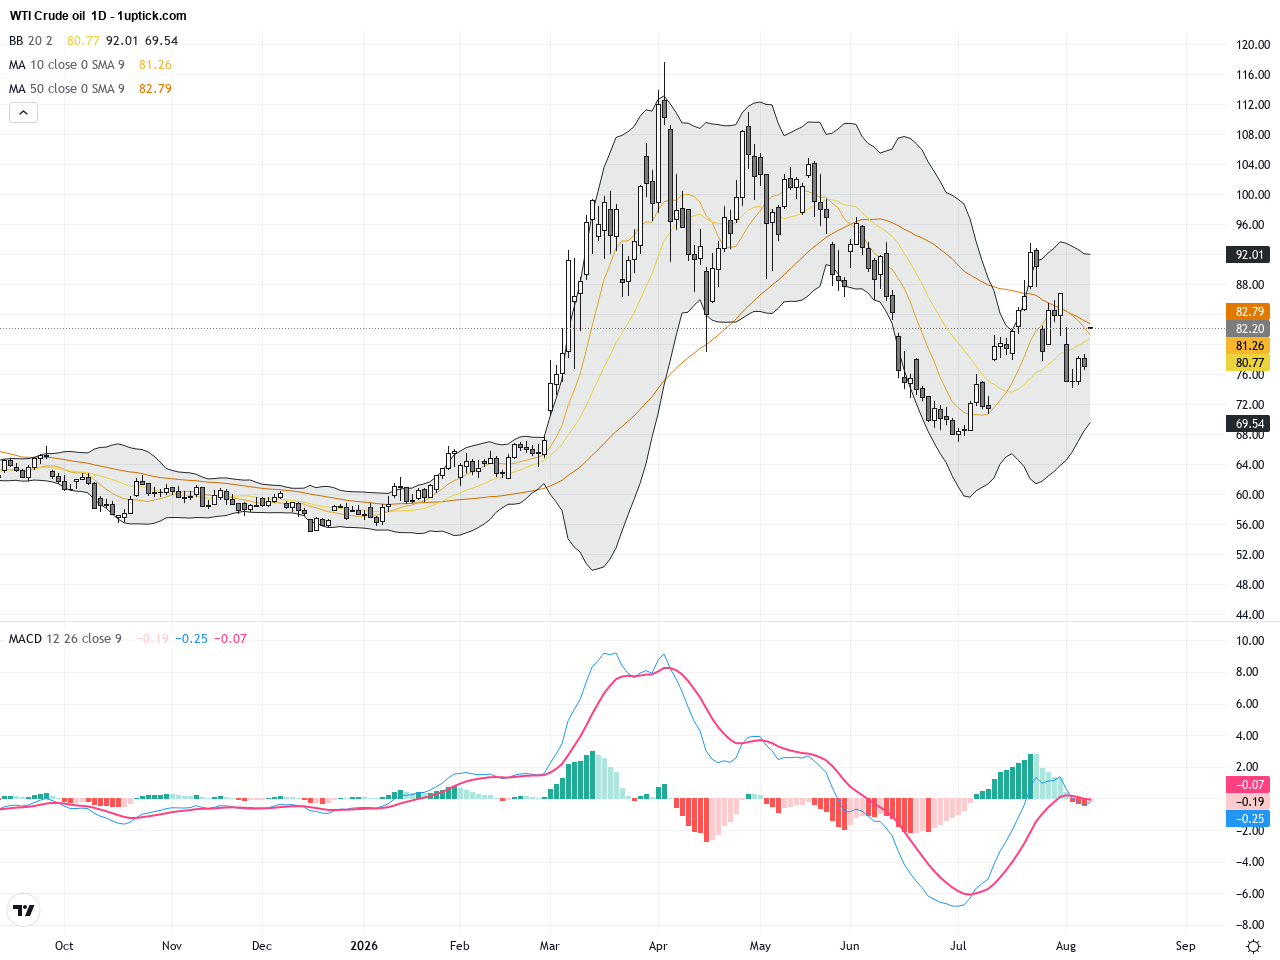
The daily chart of WTI Crude Oil depicts a clear uptrend, moving from a low near 75 USD late July to above 82 USD yesterday. The price has decisively crossed above the 50-day moving average and is testing recent highs. Bollinger Bands are widening indicating increased volatility and strength. The MACD remains positive with the signal line crossover supporting sustained bullish momentum. Overall, the daily technical setup favors a continuation of the upward trend in the medium term.
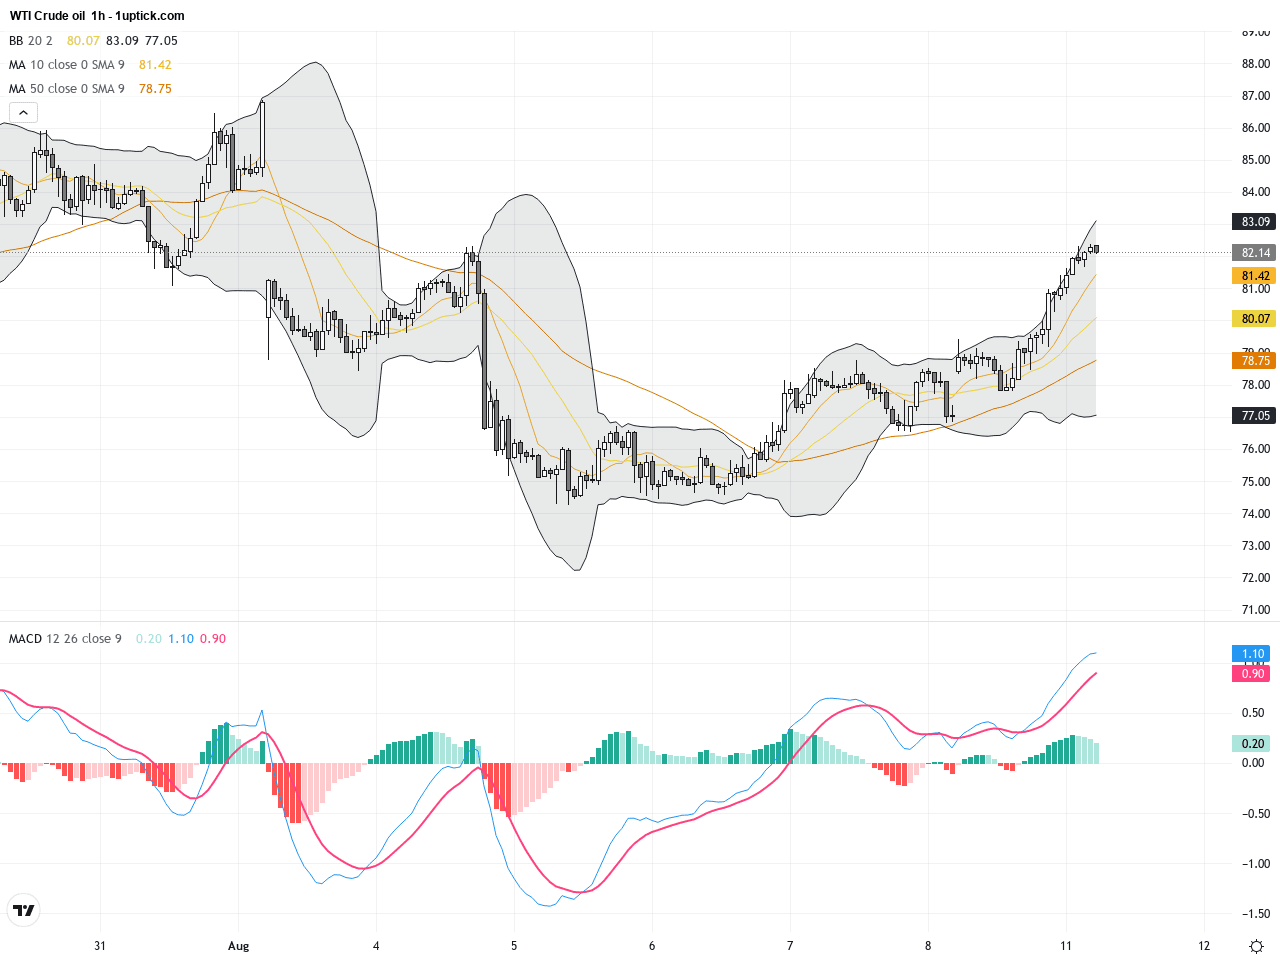
On the hourly chart over the past 3-5 days, WTI Crude Oil has formed a strong bullish breakout pattern. Price has successfully defended support around 81 USD and surged above the Bollinger Band midline. The MACD shows a bullish crossover supported by RSI levels above 60, signaling strong short-term momentum. A bull flag consolidation pattern emerged recently, suggesting potential for further upside targeting the 84 USD resistance area.
Technical Trend: WTI Crude Oil’s current trend is decisively bullish, supported by strong market risk appetite and geopolitical supply concerns. The momentum is favoring the upside in both short and medium terms.
Technical analysis indicates WTI Crude Oil is in a critical bullish breakout phase backed by positive fundamentals. The daily MACD golden cross confirms a mid-term bullish trend, while Bollinger Band expansion supports increased price volatility. Hourly bull flag formation points to a potential continuation of the short-term uptrend. Volume increase accompanying the rise validates the strength of bulls. Ideal entry zones could be on pullbacks to the 81-82 USD support range.Today’s GMT+1 economic calendar shows no significant events directly affecting WTI Crude Oil. Therefore, price movements are expected to be primarily influenced by fundamentals and technical factors rather than macroeconomic releases.
Resistance & Support

Run Live WTI Crude Oil Analysis
The above financial market data, quotes, charts, statistics, exchange rates, news, research, analysis, buy or sell ratings, financial education, and other information are for reference only. Before making any trades based on this information, you should consult independent professional advice to verify pricing data or obtain more detailed market information. 1uptick.com should not be regarded as soliciting any subscriber or visitor to execute any trade. You are solely responsible for all of your own trading decisions.