

 |
| Gold V.1.3.1 signal Telegram Channel (English) |
WTI Crude Oil: Inventory Surge Meets Supply Fears, Key Technical Levels in Play, August 13, 2026
2026-08-13 @ 06:03
Over the past 24 to 48 hours, WTI crude oil prices have fluctuated significantly, reflecting sharp shifts in both supply and demand factors. After closing at $83.27 per barrel on August 12, 2026, crude oil prices initially faced downward pressure following a surprising EIA report showing U.S. crude inventories surged by over 17.4 million barrels. Such a large inventory build typically signals oversupply, weighing on prices.
However, this decline was quickly offset by escalating tensions around the Strait of Hormuz in the Middle East. With U.S.-Iran peace deal talks stalled and recent attacks on vessels in the Red Sea and Gulf of Oman heightening fears over supply disruptions, geopolitical risks pushed oil prices higher. This lifted WTI crude for the fifth consecutive day, pushing prices close to $84 per barrel.
For the average investor, this scenario looks like suppliers have suddenly stockpiled crude, which should lower prices, yet instability in key shipping routes and escalating geopolitical risks sparked supply concerns that kept prices elevated or rising. This contradiction makes trading oil more volatile and uncertain, underscoring how swiftly global politics can impact market movements.
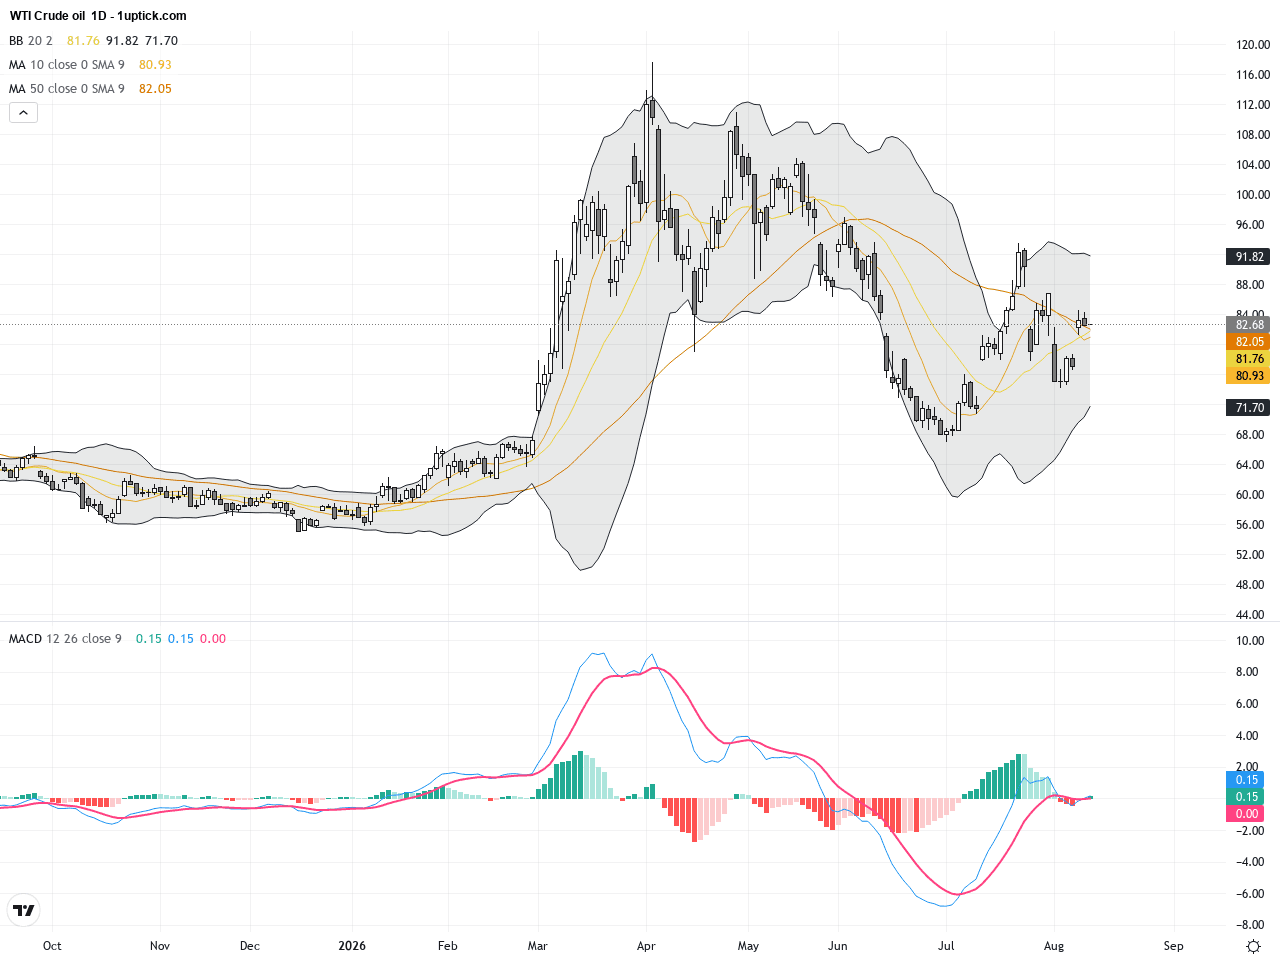
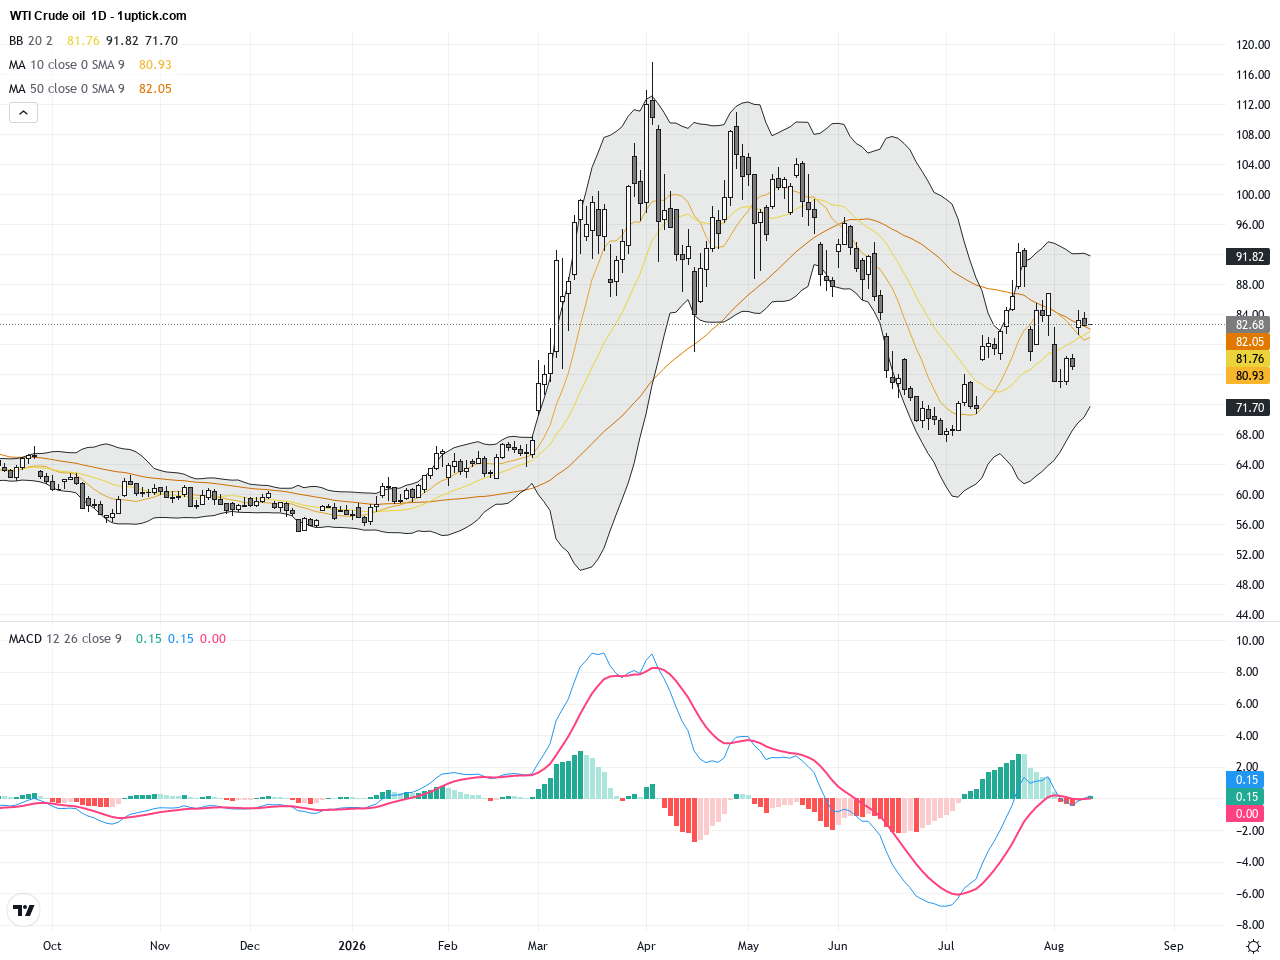
On the daily chart, WTI crude price shows a clear upward channel, steadily climbing from the $78 level to recent highs near $84. The 20-day and 50-day moving averages are forming a golden cross, indicating strengthening medium-term bullish momentum. Bollinger Bands suggest price is repeatedly testing the upper band with intermittent pullbacks, signaling short-term overextension. However, the MACD histogram is shrinking, hinting at a possible slowing in bullish momentum. Overall, the daily trend remains bullish with solid support, but a decisive break above $84 resistance is needed to confirm further gains.
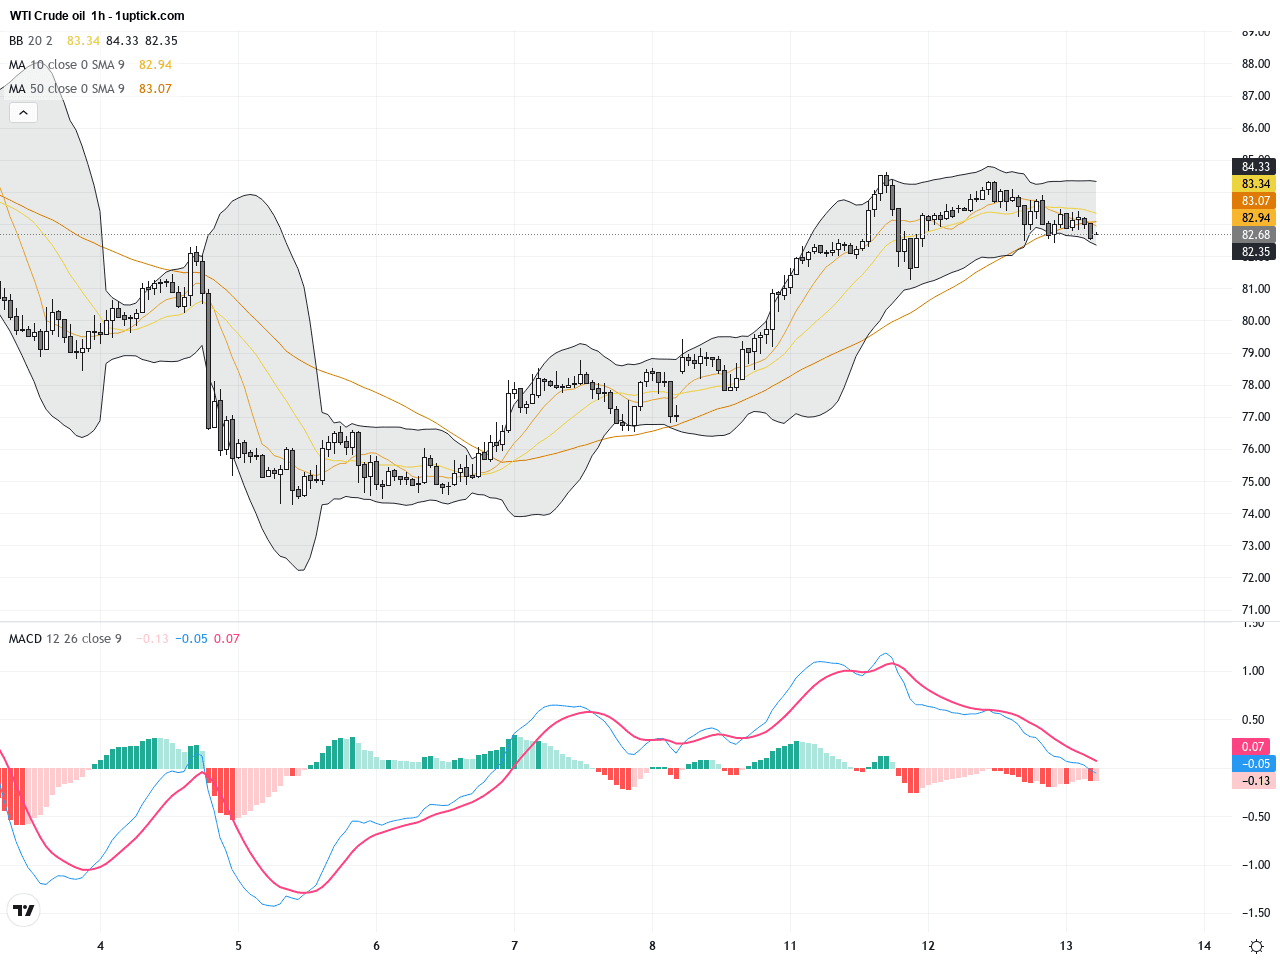
In the past 3-5 days’ hourly chart, price action has been choppy within a tight range near the $83.5-$84 resistance zone. Several candlestick patterns such as doji and inverted hammers signal indecision. The short-term moving averages have converged, and Bollinger Bands are narrowing, indicating consolidation and a potential breakout soon. The MACD oscillates around the zero line, reflecting momentum ambiguity. Monitoring a break above $84 is critical as it could trigger renewed buying interest.
Technical Trend: WTI crude oil currently exhibits a cautiously bullish trend, blending short-term consolidation within a medium-term upward channel.
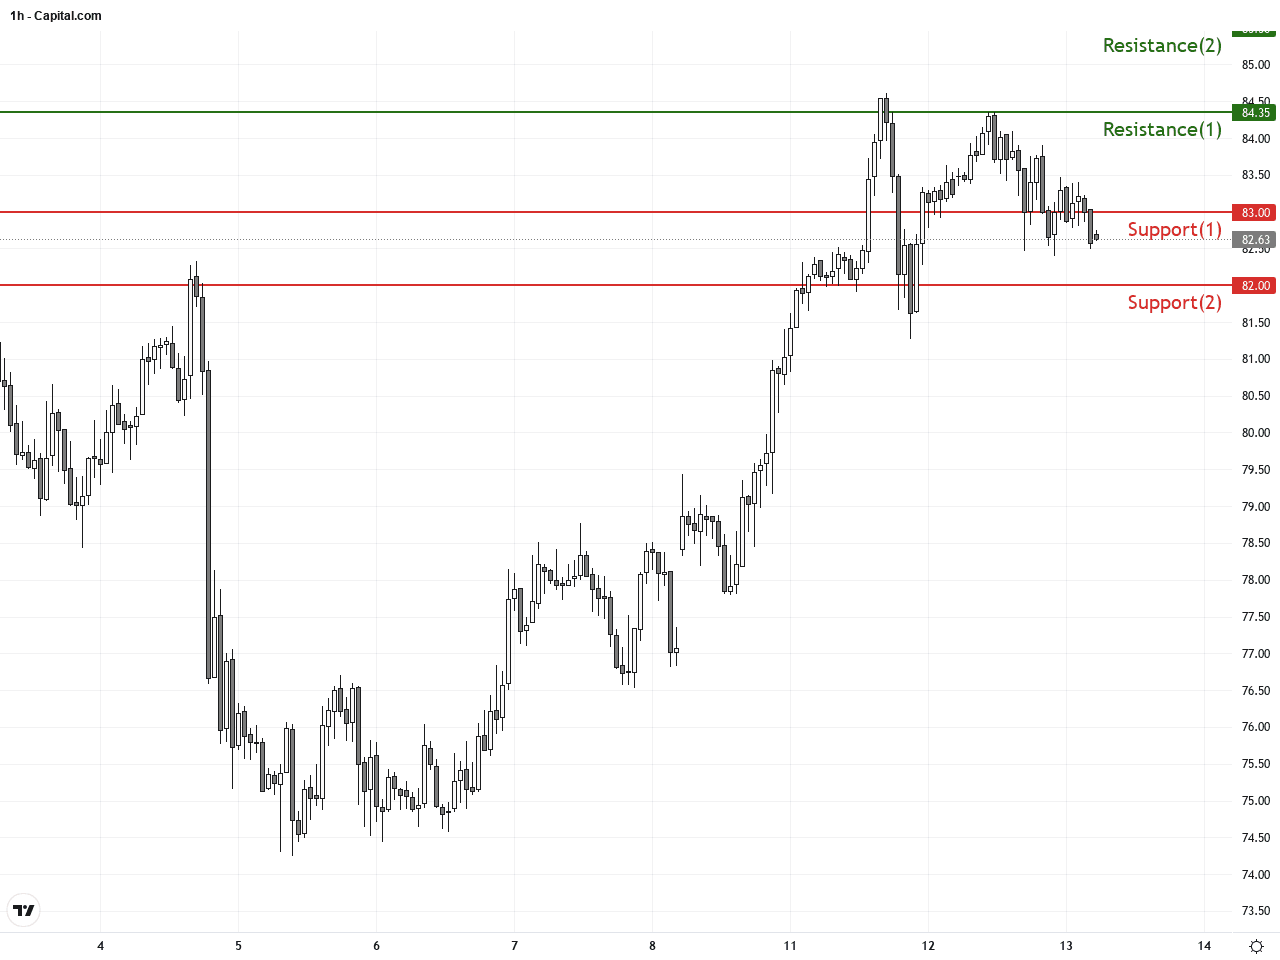
Technically, WTI shows a cautiously bullish profile with momentum signs fading. The inventory build poses short-term downside risk, but geopolitical tensions continue to support the price. The daily golden cross and upper Bollinger Band cap upside for now, while the hourly chart’s consolidation may precede a directional move. Key action in the next 24 hours hinges on maintaining support near $83 and challenging resistance at $84, with a break out potentially attracting fresh buying interest.There are no significant or directly relevant economic events scheduled today that would impact WTI crude oil prices. Therefore, price movements are expected to be driven more by fundamental supply news and technical factors.
Resistance & Support
Run Live WTI Crude Oil Analysis
The above financial market data, quotes, charts, statistics, exchange rates, news, research, analysis, buy or sell ratings, financial education, and other information are for reference only. Before making any trades based on this information, you should consult independent professional advice to verify pricing data or obtain more detailed market information. 1uptick.com should not be regarded as soliciting any subscriber or visitor to execute any trade. You are solely responsible for all of your own trading decisions.