








 |
| Gold V.1.3.1 signal Telegram Channel (English) |
XAUUSD: Gold Tests Two-Month Highs Amid Key CPI Data – Trading Outlook & Technical Levels, August 13, 2026
2026-08-13 @ 05:04
Over the past 24 to 48 hours, gold (XAUUSD) experienced notable volatility, testing two-month highs and moving beyond yesterday’s closing price of $4408.27 per ounce. Market attention centered on the latest U.S. Consumer Price Index (CPI) report, which revealed a slight inflation decrease to 3.4% in July from 3.5% in June, matching analyst expectations. This data boosted gold’s appeal as an inflation hedge in the short term.
Moreover, ongoing geopolitical developments involving Iran and the U.S. nuclear deal talks added upward pressure on gold prices as investors sought refuge in safe-haven assets. These factors contributed to gold breaking its recent resistance level, climbing above $4395—its highest since early June.
For the average investor, this gold price surge signals a landscape of economic uncertainty coupled with inflation easing. With inflation stabilizing and geopolitical risks remaining, gold’s safety premium is underscored, explaining the strong buying momentum witnessed over the last two days.
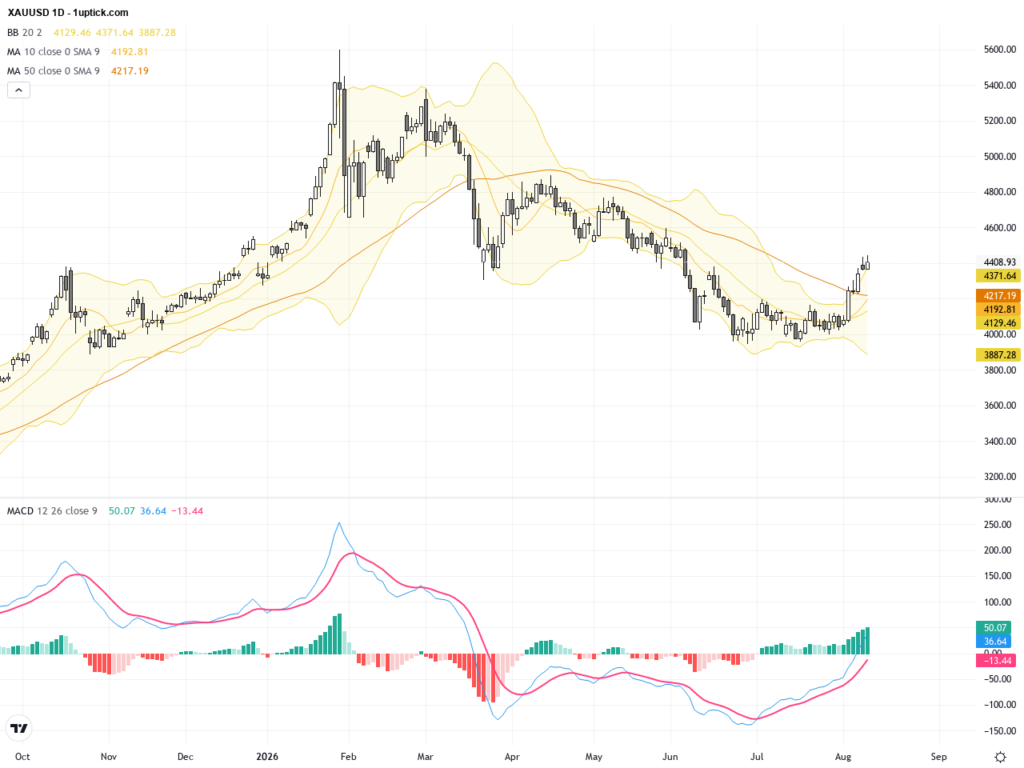
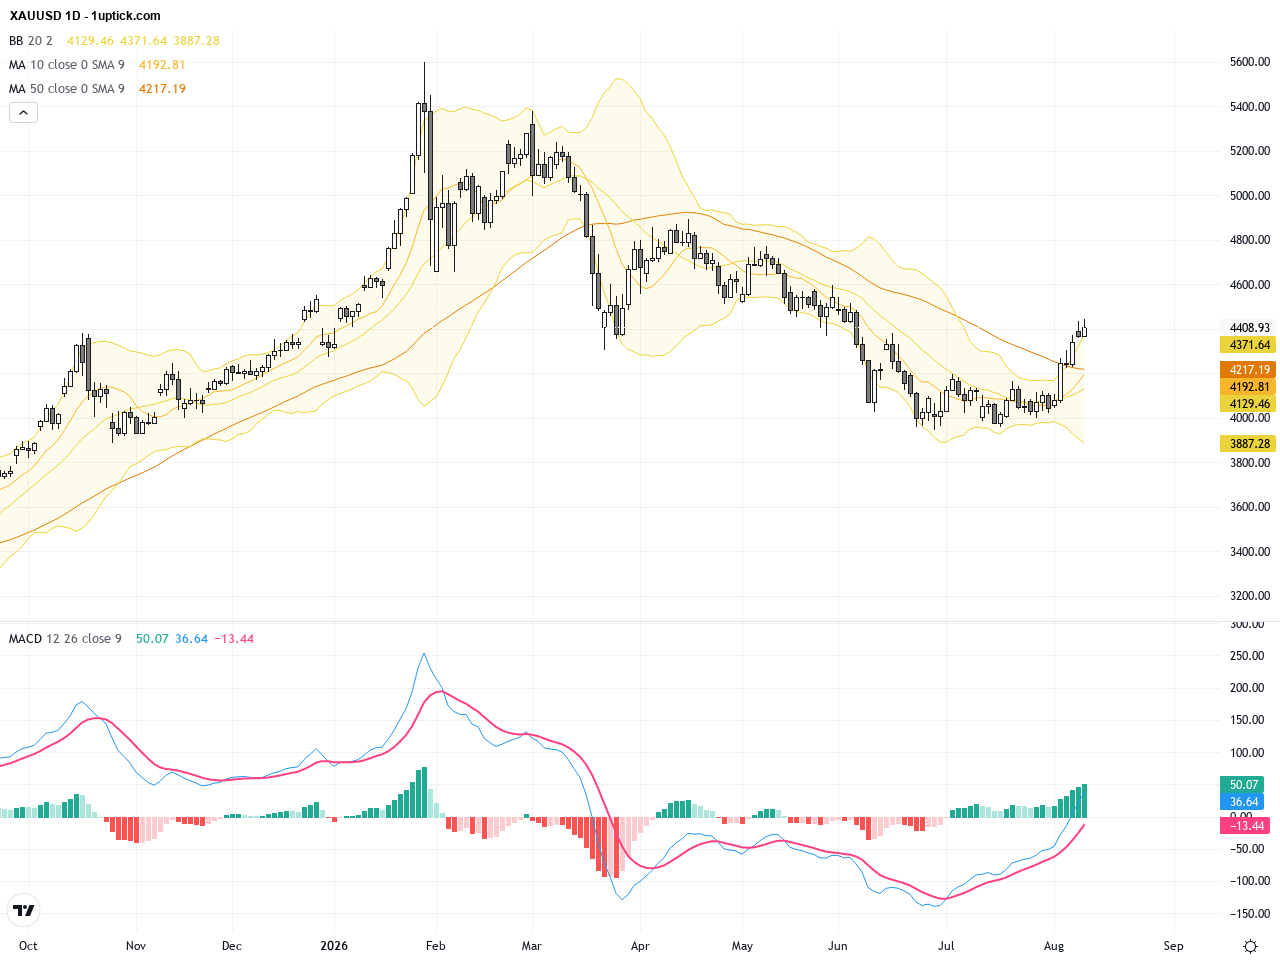
The daily chart reveals a clear upward trend originating near 4360, with three consecutive bullish closes confirming sustained buying interest. The price has notably reclaimed and held above the 100-day moving average, signaling a mid-term bullish bias. Bollinger Bands show initial contraction followed by a widening channel upwards, suggesting increasing volatility and momentum. The MACD indicator confirms rising bullish momentum with an expanding gap between signal and MACD lines. Additionally, a potential bullish flag pattern is emerging, indicating possible continuation of the rally.
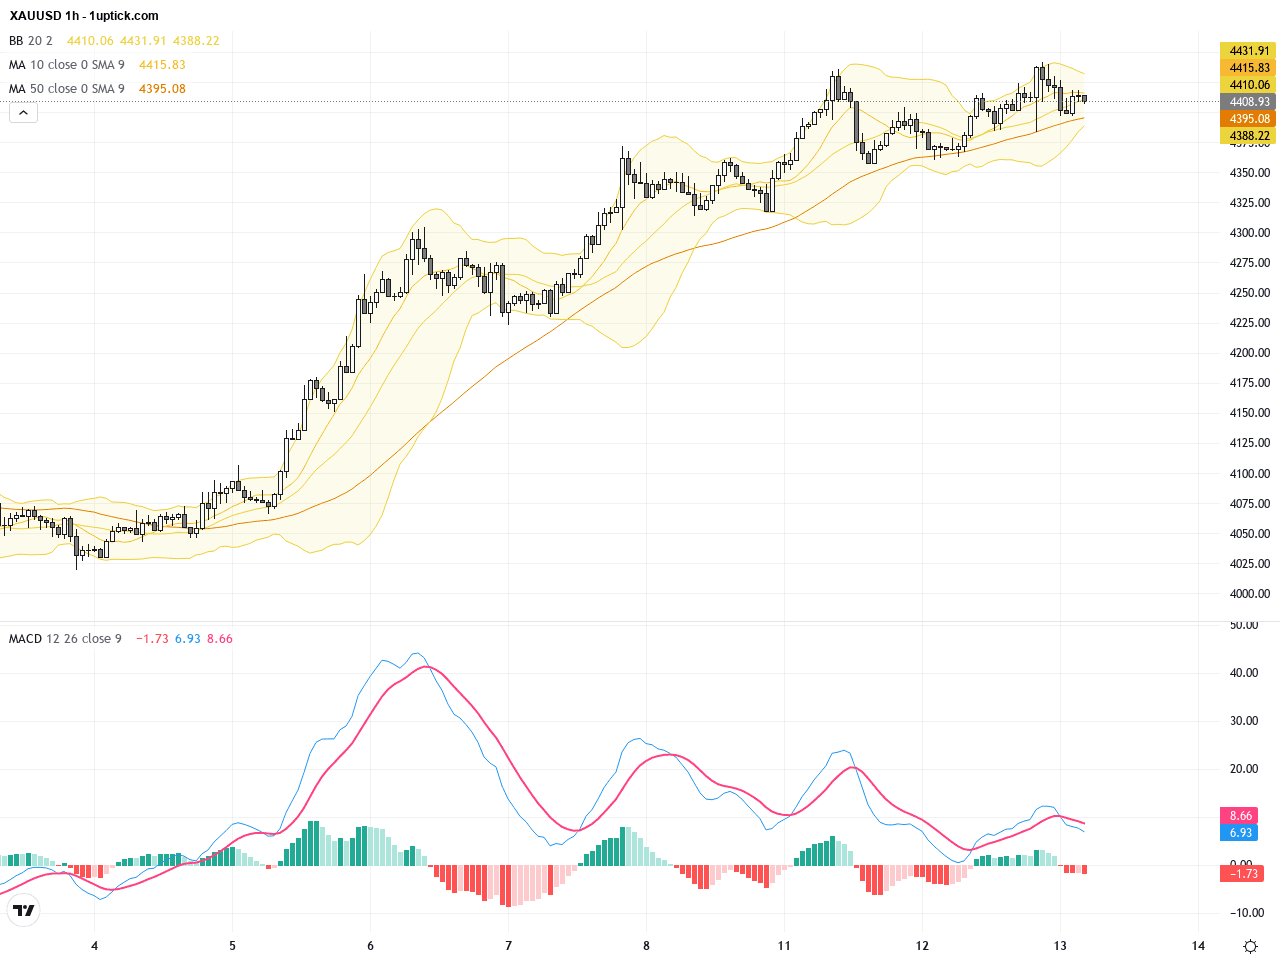
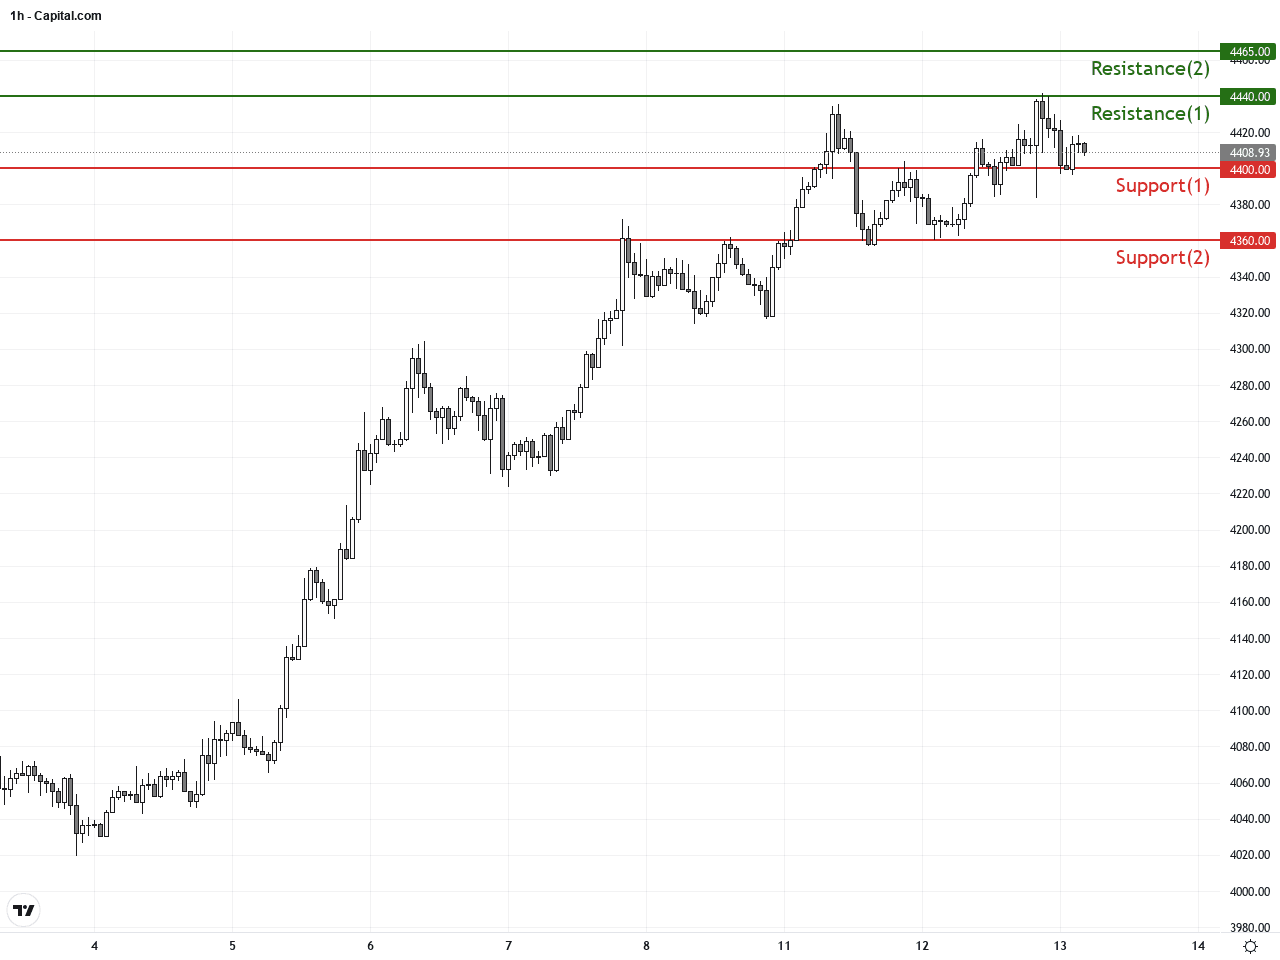
On the hourly chart, XAUUSD has maintained a strong uptrend over the past 3-5 days, with short-term moving averages aligned bullishly. Price action has repeatedly tested resistance near 4440 without yet firm breakout, indicating a key zone to watch. Recently, a hammer candlestick formed signaling a potential short-term pullback, though broader trend remains intact. Bollinger Bands remain expanded with price near the upper band, and MACD fast line stays above signal line, reinforcing short-term bullish momentum.
Technical Trend: Cautiously Bullish
From a technical perspective, XAUUSD’s recent breakout above the 100-day moving average combined with a bullish MACD crossover confirms solid upside potential. The hammer candlestick on the hourly chart hints at near-term profit-taking or small retracement without reversing the prevailing uptrend. Traders should monitor the critical resistance around 4440 for potential breakout confirmation, supported by volume expansion. This confluence of technical signals alongside supportive fundamental context suggests a cautiously bullish stance, with opportunities for high-probability trades.Today’s GMT+1 economic calendar features key CPI releases from Germany, Italy, and the US. German and Italian CPI figures for July came in at or slightly above forecasts, while the US CPI and core CPI data align with market expectations at 3.4% annual inflation and slight monthly gains. These results support steady inflation outlook and, consequently, steady demand for gold as a hedge. A CPI reading at or below forecast is likely to weigh on the USD and bolster gold prices, while an upside surprise might dampen gold’s momentum. Overall, no drastic market moves are expected immediately from today’s releases.
Resistance & Support
The above financial market data, quotes, charts, statistics, exchange rates, news, research, analysis, buy or sell ratings, financial education, and other information are for reference only. Before making any trades based on this information, you should consult independent professional advice to verify pricing data or obtain more detailed market information. 1uptick.com should not be regarded as soliciting any subscriber or visitor to execute any trade. You are solely responsible for all of your own trading decisions.