









 |
| Gold V.1.3.1 signal Telegram Channel (English) |
XAUUSD Technical & Fundamental Analysis: Gold Faces Profit Taking Near $4,300 Support, August 14, 2026
2026-08-14 @ 05:04
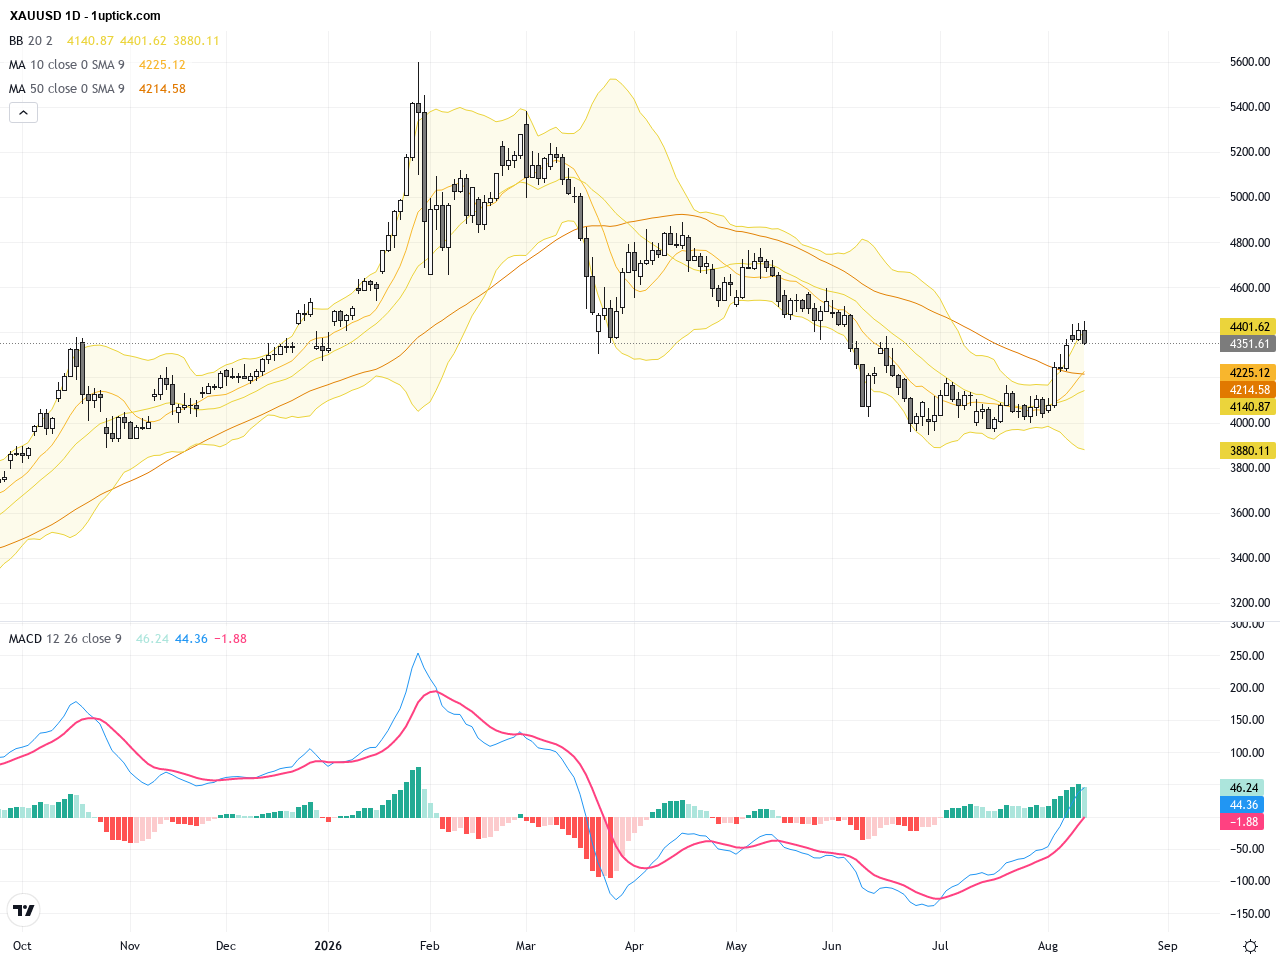
Over the past 24 to 48 hours, the gold (XAUUSD) market has shown a clear pullback. The closing price yesterday was $4350.88, down from $4408.525 the day before. Despite the ongoing decline in U.S. Treasury yields which would typically support gold prices, traders rushed to take profits after a strong rebound, causing a significant drop in gold price. According to the latest market news, gold quickly gave back profits following a robust rally from multi-month lows. While softer CPI and PPI economic data pointed to easing rate hike pressures, the U.S. dollar remained firm, limiting gold’s potential upside.
For the average investor, this price action resembles a brief market pause. Like a leading runner slowing down to catch their breath, creating an opening for others to catch up. The gold price pullback is not a sign of deteriorating fundamentals but a normal profit-taking move as market participants adjust their risk exposure. Should the dollar weaken or economic data continue to soften, gold may regain momentum and attract renewed buying interest.
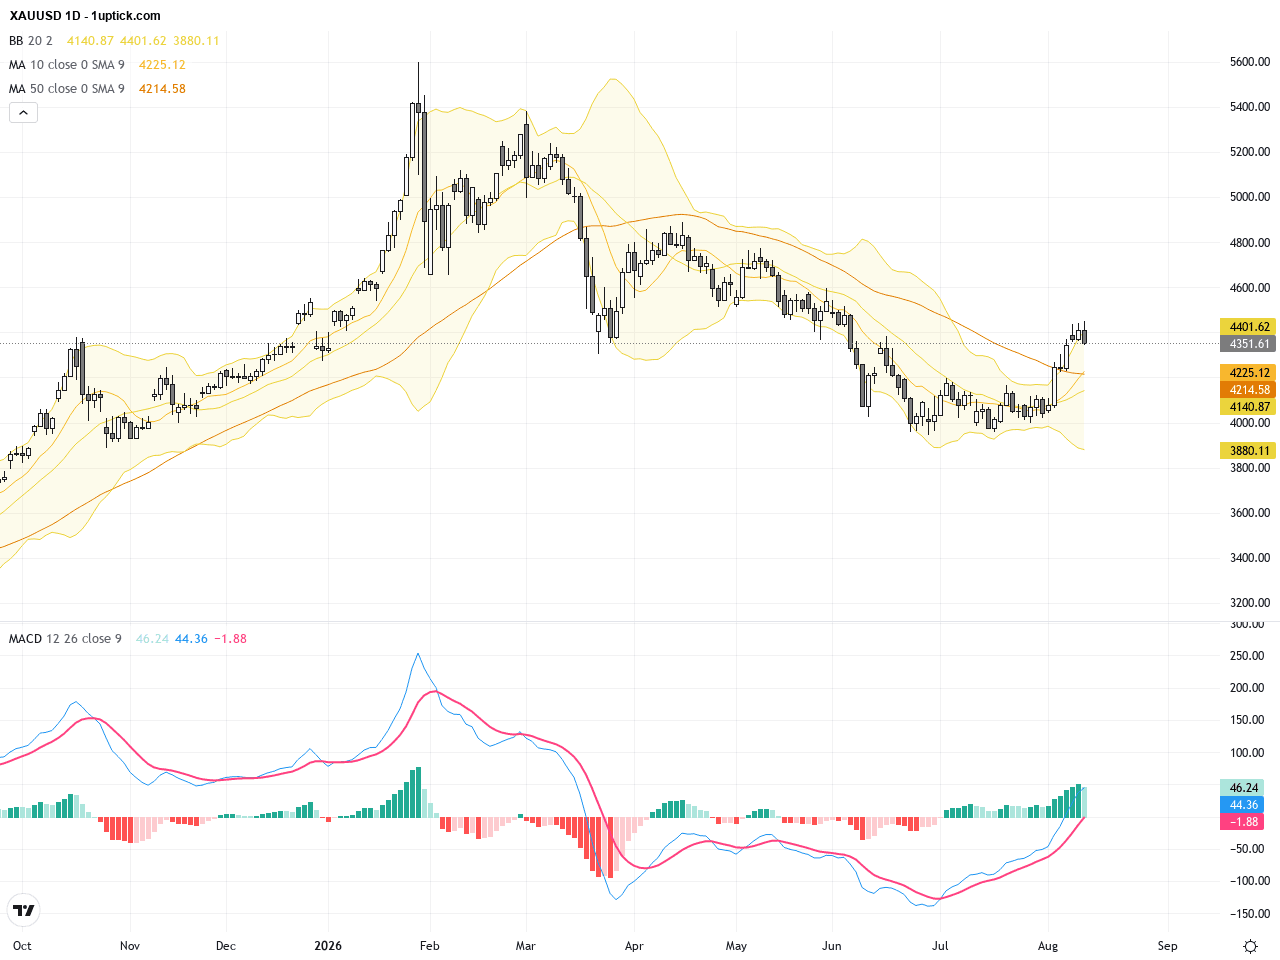
The daily chart shows that since late July, XAUUSD has trended upward from around $4,030 to above $4,450 before beginning a notable pullback recently. The price has repeatedly been capped near the upper Bollinger Band, indicating weakening bullish momentum. The 50-day and 100-day moving averages remain bullish, but a MACD bearish crossover is emerging, suggesting short-term correction pressure. Overall, the daily trend remains in consolidation, and a break below key support would likely accelerate losses.
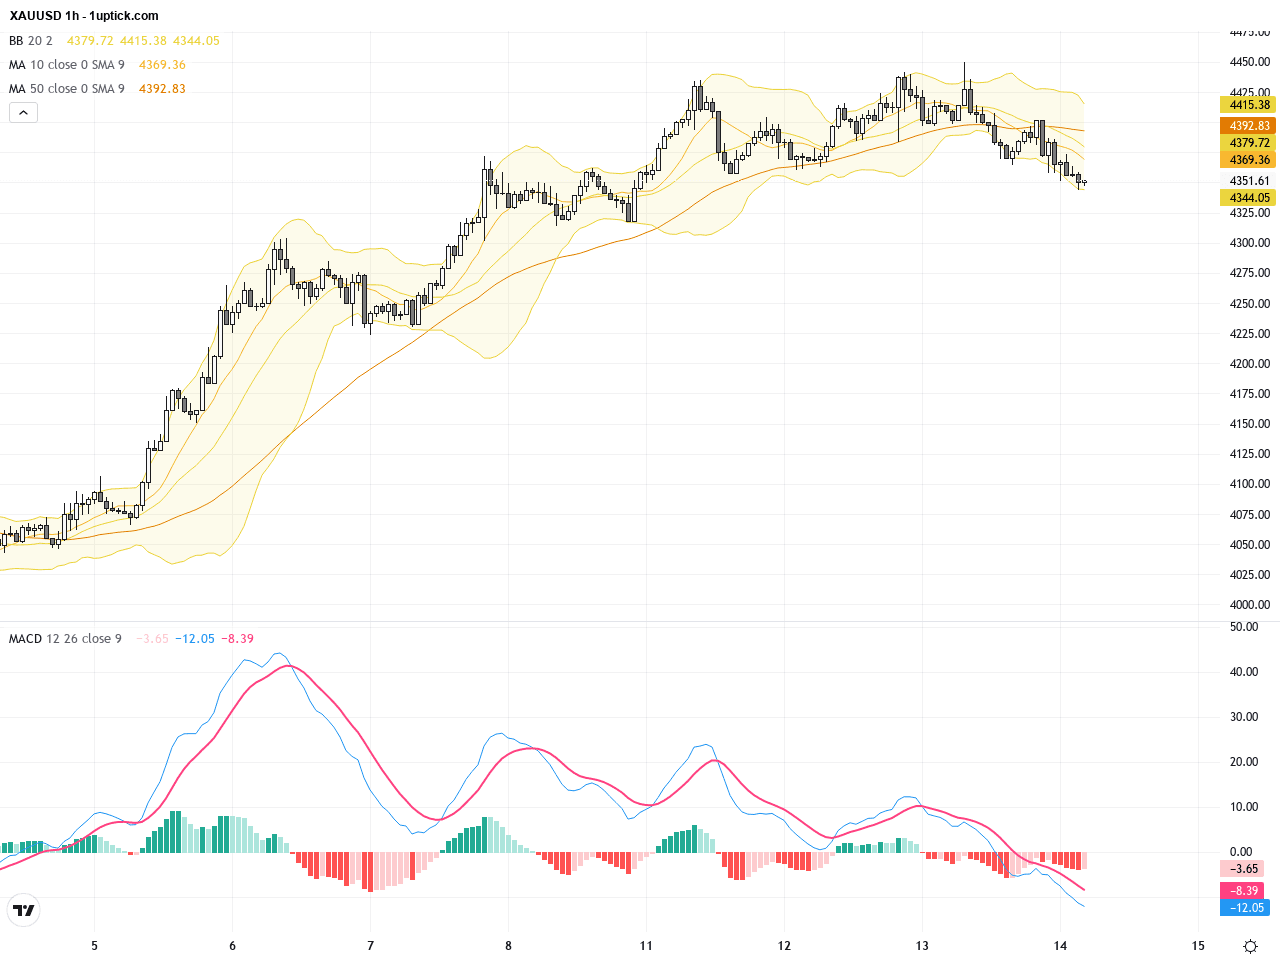
In the past 3-5 days, the hourly chart reveals a V-shaped reversal pattern: swift decline from highs toward $4,340 support followed by a rebound, yet resistance near $4,400 remains firm. Short-term moving averages have flattened, Bollinger Bands narrowed, reflecting reduced volatility. The MACD histogram is shrinking near the zero line, signaling lack of momentum, with likely sideway trading within the support-resistance range in the near term.
Technical Trend: Short-term trend is cautiously sideways with bearish undertones, as the market balances between profit-taking and support testing.
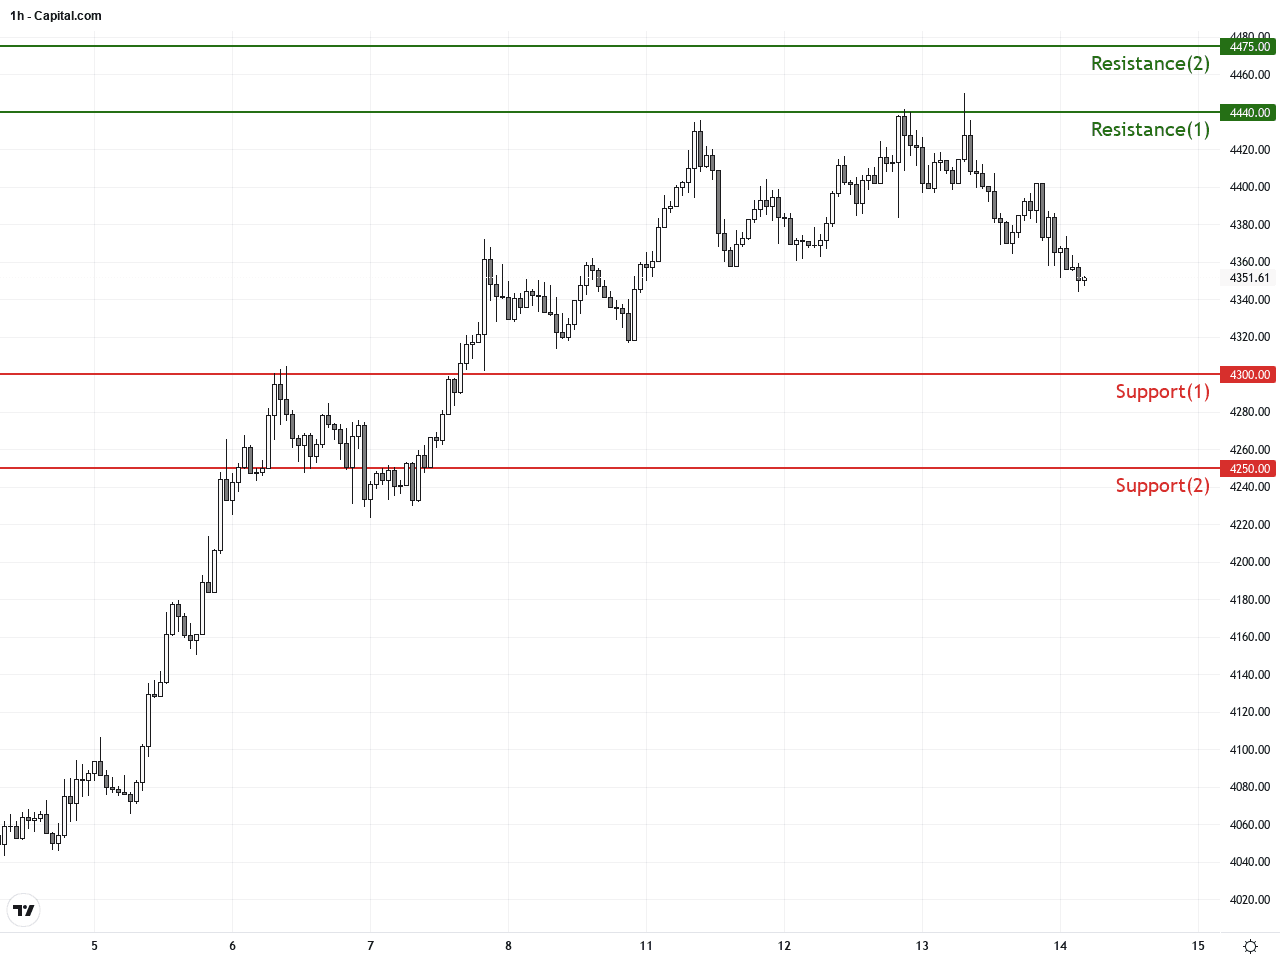
Technically, XAUUSD is showing an early Head and Shoulders pattern on the daily chart, with the left shoulder formed in late July, the head formed in early August near $4,450, and the right shoulder currently developing. A breach below the neckline near $4,300 could trigger further downside. Increasing volume and MACD bearish crossover reinforce the bearish bias. On the hourly chart, recent candlesticks exhibit a spinning top, reflecting market indecision following profit taking. Traders should watch the key support and resistance levels closely for potential breakout triggers.Today’s economic calendar features the US Producer Price Index at 14:30 GMT+1, with year-over-year growth at 4.7%, slightly below the forecast of 4.9%, and a flat month-over-month reading, indicating softer inflation pressures. Core PPI results align with expectations. Weekly jobless claims slightly exceed forecasts. These data points could mildly weaken the US dollar, providing limited support to gold prices in the short term. However, market interpretation of these releases and Federal Reserve guidance remain key drivers.
Resistance & Support
The above financial market data, quotes, charts, statistics, exchange rates, news, research, analysis, buy or sell ratings, financial education, and other information are for reference only. Before making any trades based on this information, you should consult independent professional advice to verify pricing data or obtain more detailed market information. 1uptick.com should not be regarded as soliciting any subscriber or visitor to execute any trade. You are solely responsible for all of your own trading decisions.