








 |
| Gold V.1.3.1 signal Telegram Channel (English) |
USDCAD: Bearish Momentum Nears Key Support at 1.3817 Amid Weakening USD, August 18, 2026
2026-08-18 @ 13:01
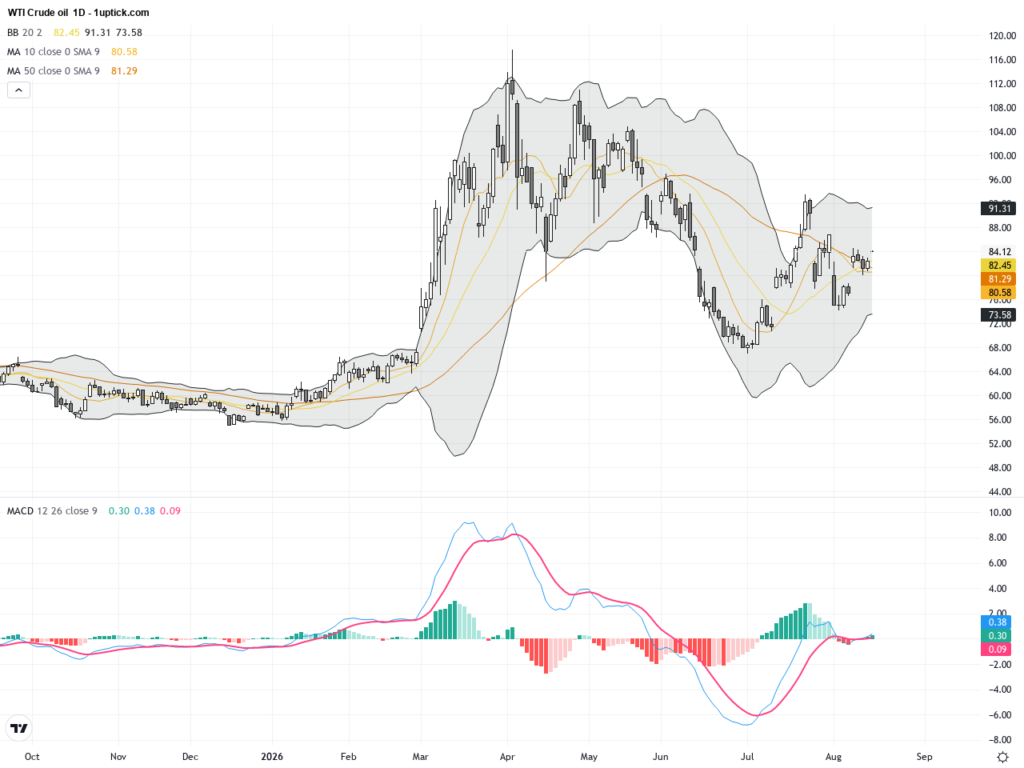
Over the past 24 to 48 hours, the USD/CAD pair has notably declined, hitting a two-week low, with yesterday’s closing price near 1.3872. This downward movement was primarily driven by stronger-than-expected U.S. inflation data, which put pressure on the U.S. dollar. Meanwhile, positive economic data from Canada, including rising factory sales and higher oil prices, boosted the Canadian dollar’s performance.
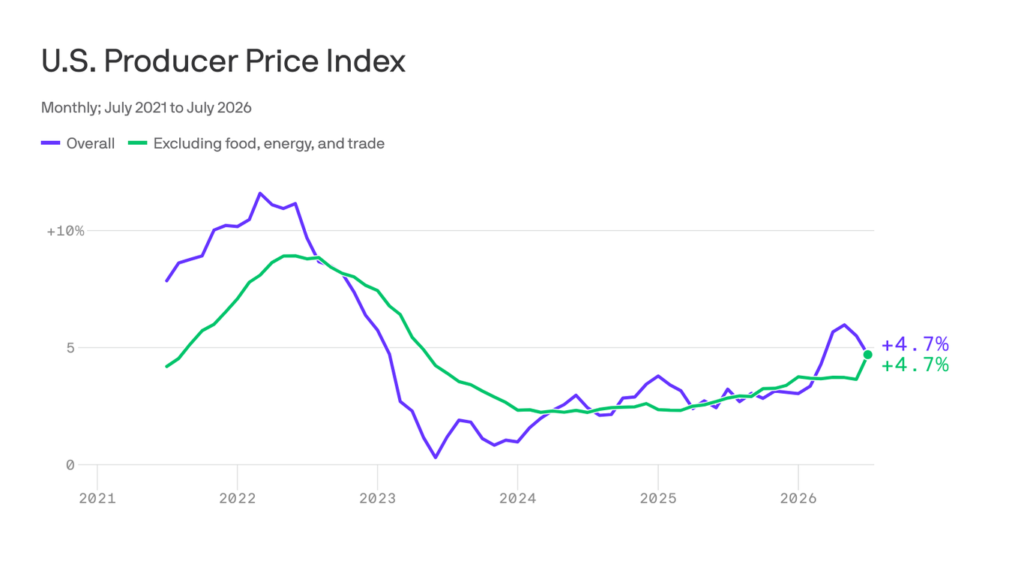
Market participants have increasingly reduced their bets on a Federal Reserve rate hike in September, expecting the federal funds rate to remain unchanged. This shift dampened the U.S. dollar’s appeal. Additionally, the U.S. Producer Price Index (PPI) report indicated a decline in inflation pressures, further weakening the dollar. Investors can view this as a market consensus betting on a more dovish Fed stance, leading to a weaker USD and a stronger CAD supported by rising energy prices and domestic economic strength.
From the perspective of average investors, this price movement highlights how exchange rates are often influenced by fundamental economic data and central bank policy expectations. The U.S. dollar has been pressured in the short term by higher domestic inflation figures but faces medium-term pressure due to dovish market outlooks. The Canadian dollar, bolstered by increasing global oil prices and positive domestic data, has strengthened. Investors should keep a close eye on evolving Fed rate hike expectations and energy market trends, as these will continue to shape the USD/CAD trajectory.
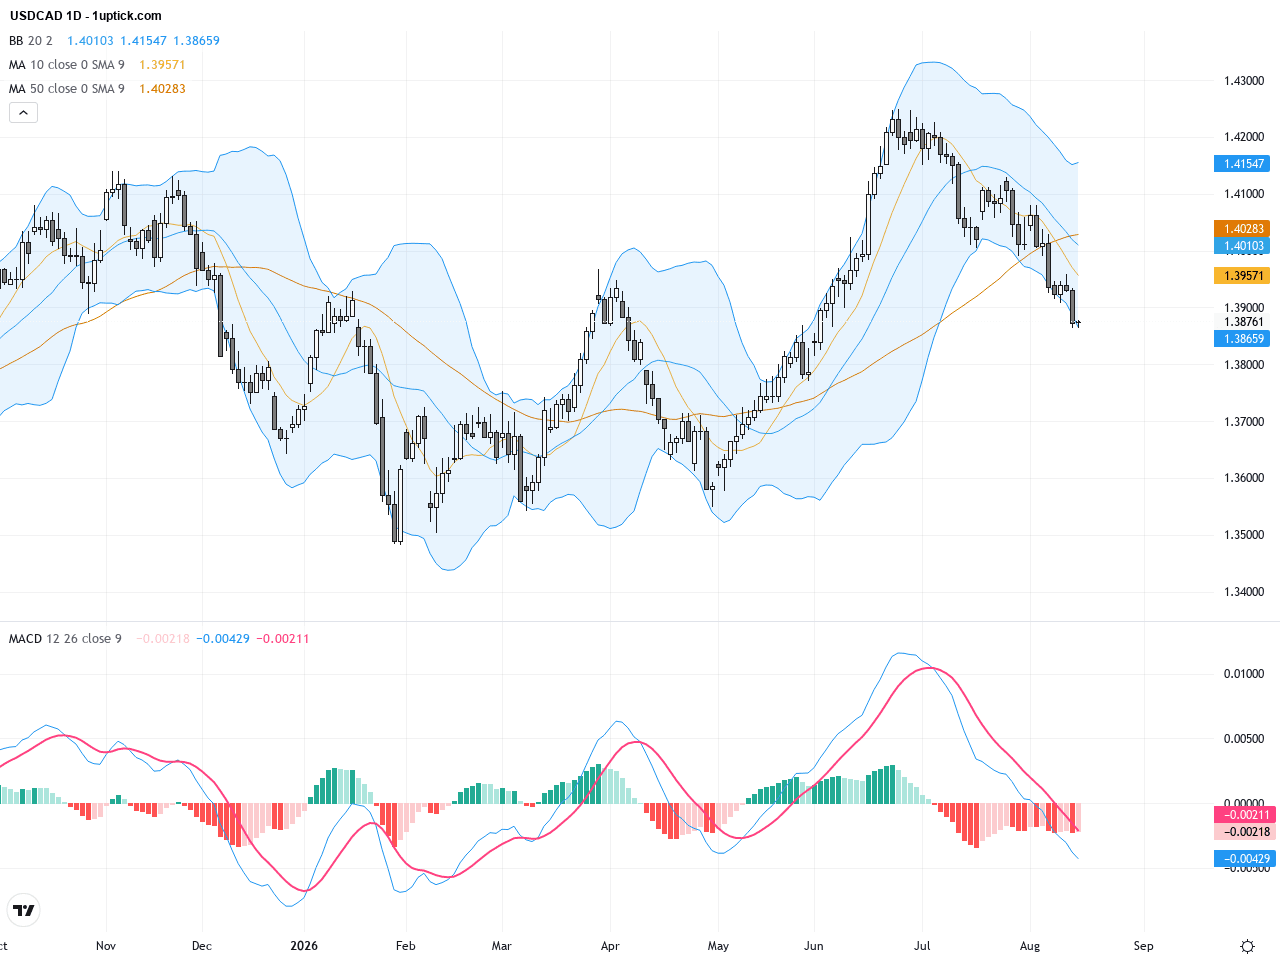
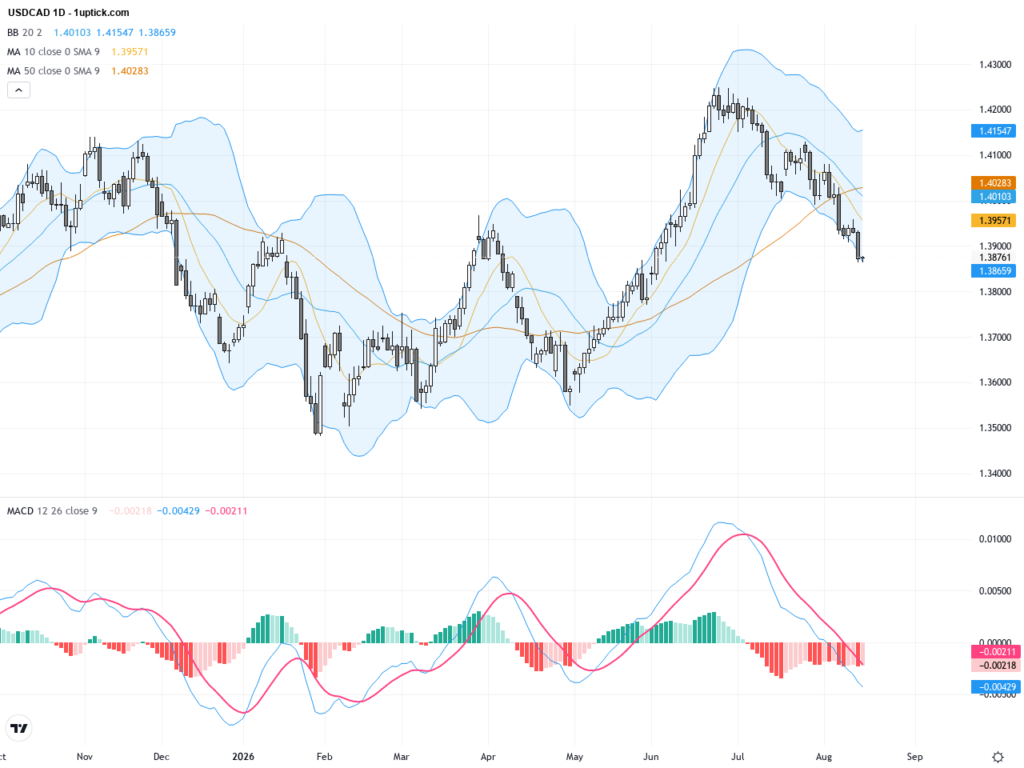
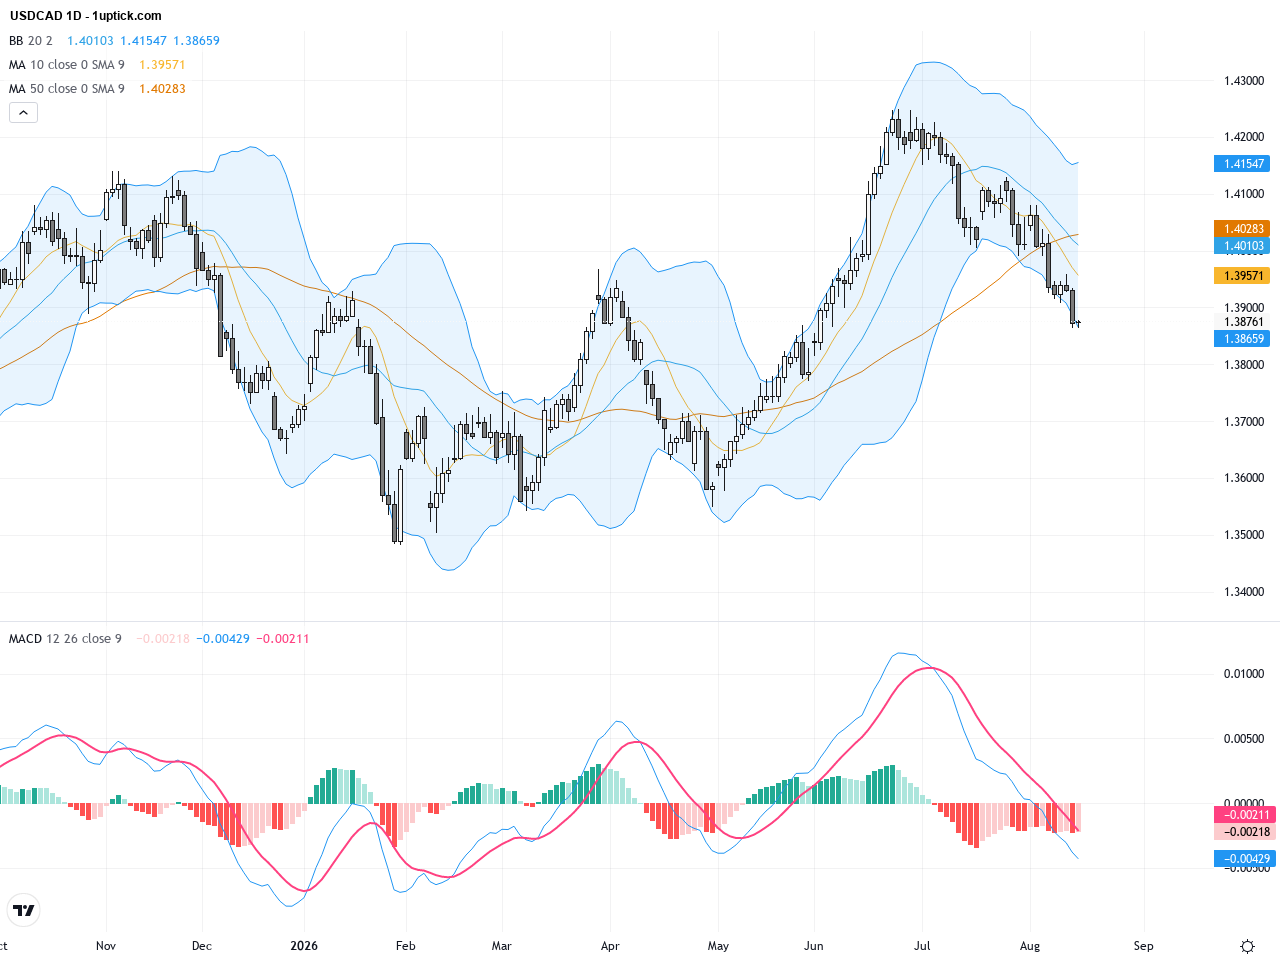
The daily chart reveals a clear downtrend channel for USDCAD since early August’s peak near 1.42. The 200-day moving average at roughly 1.38 acts as a critical long-term support level, with price recently testing this area. Short-term moving averages slope downwards and Bollinger Bands show contracting price range around the middle band. The MACD remains in negative territory, confirming weak momentum and a predominantly bearish longer-term trend that suggests sellers remain in control.
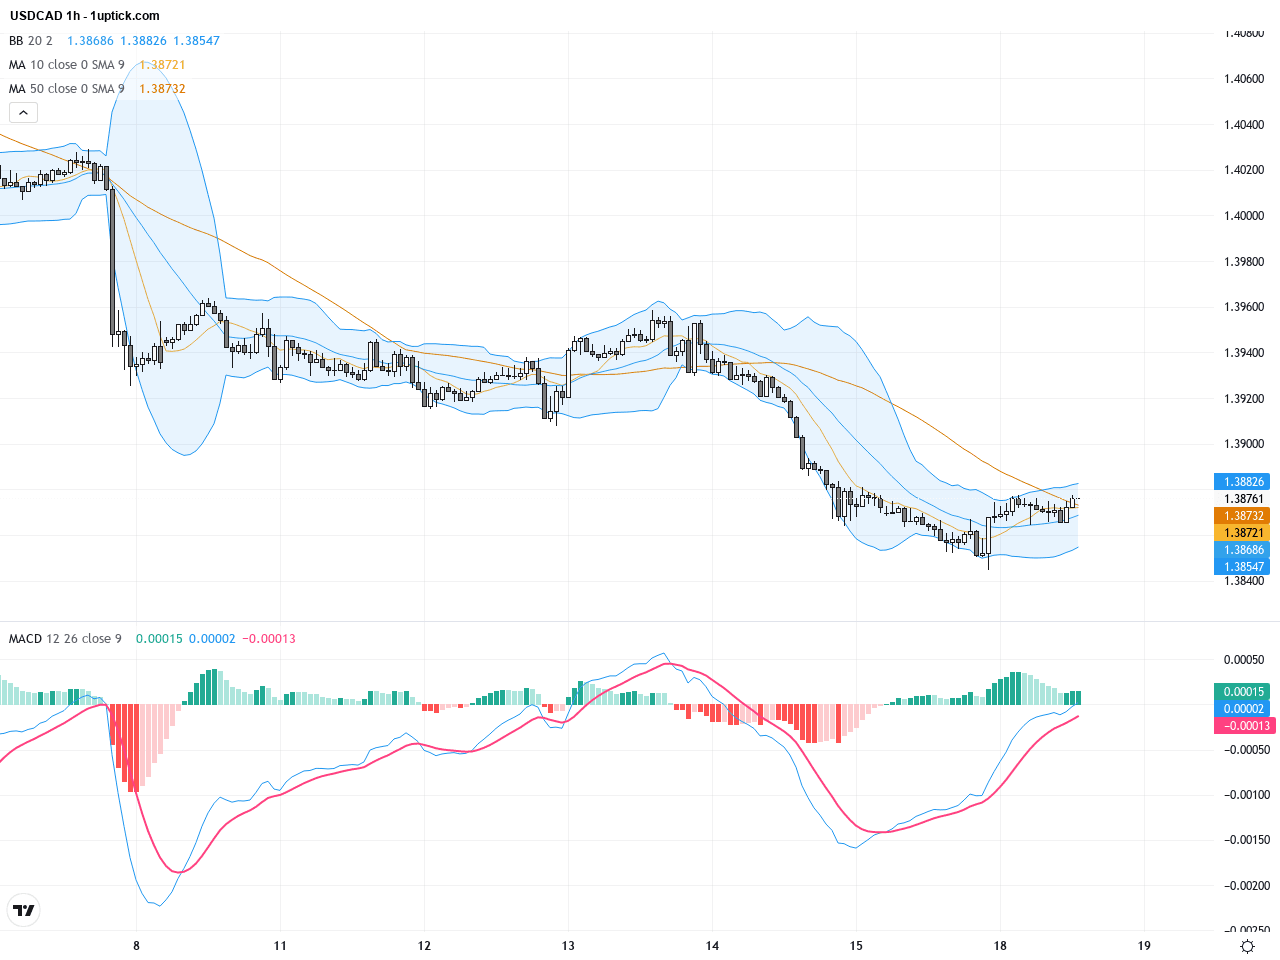
The hourly chart over the past 3 to 5 days displays sustained downward momentum, with price breaking several short-term support zones. Short-term moving averages have formed bearish crosses, while expanding Bollinger Bands indicate increasing volatility with bias to the downside. A recent bearish engulfing candlestick pattern signals further near-term weakness. The MACD line staying below its signal line confirms ongoing bearish pressure. Failure to hold above 1.3817 support could prompt a move toward 1.3760 support levels.
Technical Trend: Cautiously Bearish – The trend is firmly downward in the short to medium term with notable selling pressure.
Technically, USDCAD is forming a descending triangle pattern initiated earlier this month, typically signaling a bearish breakout probability. Both daily MACD and RSI indicators are increasingly weak, reflecting strong bearish momentum. On the hourly chart, bearish engulfing patterns accompanied by a death cross of moving averages further support the downside bias. Breach of the 1.3817 support would open the way for deeper declines toward 1.3760 and possibly 1.3700, indicating heightened downside risk.Today’s economic calendar in the GMT+1 timezone shows no major or directly impactful releases for USDCAD. However, multiple US data points such as export/import prices and building permits will be released around 14:30 GMT+1, which might cause short-term USD volatility. Canadian July housing starts data at 14:15 GMT+1 may provide modest support to CAD if results beat expectations. Overall, market attention remains focused on US inflation and Fed policy cues as key drivers.
Resistance & Support

The above financial market data, quotes, charts, statistics, exchange rates, news, research, analysis, buy or sell ratings, financial education, and other information are for reference only. Before making any trades based on this information, you should consult independent professional advice to verify pricing data or obtain more detailed market information. 1uptick.com should not be regarded as soliciting any subscriber or visitor to execute any trade. You are solely responsible for all of your own trading decisions.