

 |
| Gold V.1.3.1 signal Telegram Channel (English) |
XAUUSD Technical Breakout: Gold Surges Above 100-Day Moving Average with Clear Trading Outlook, August 18, 2026
2026-08-18 @ 05:04
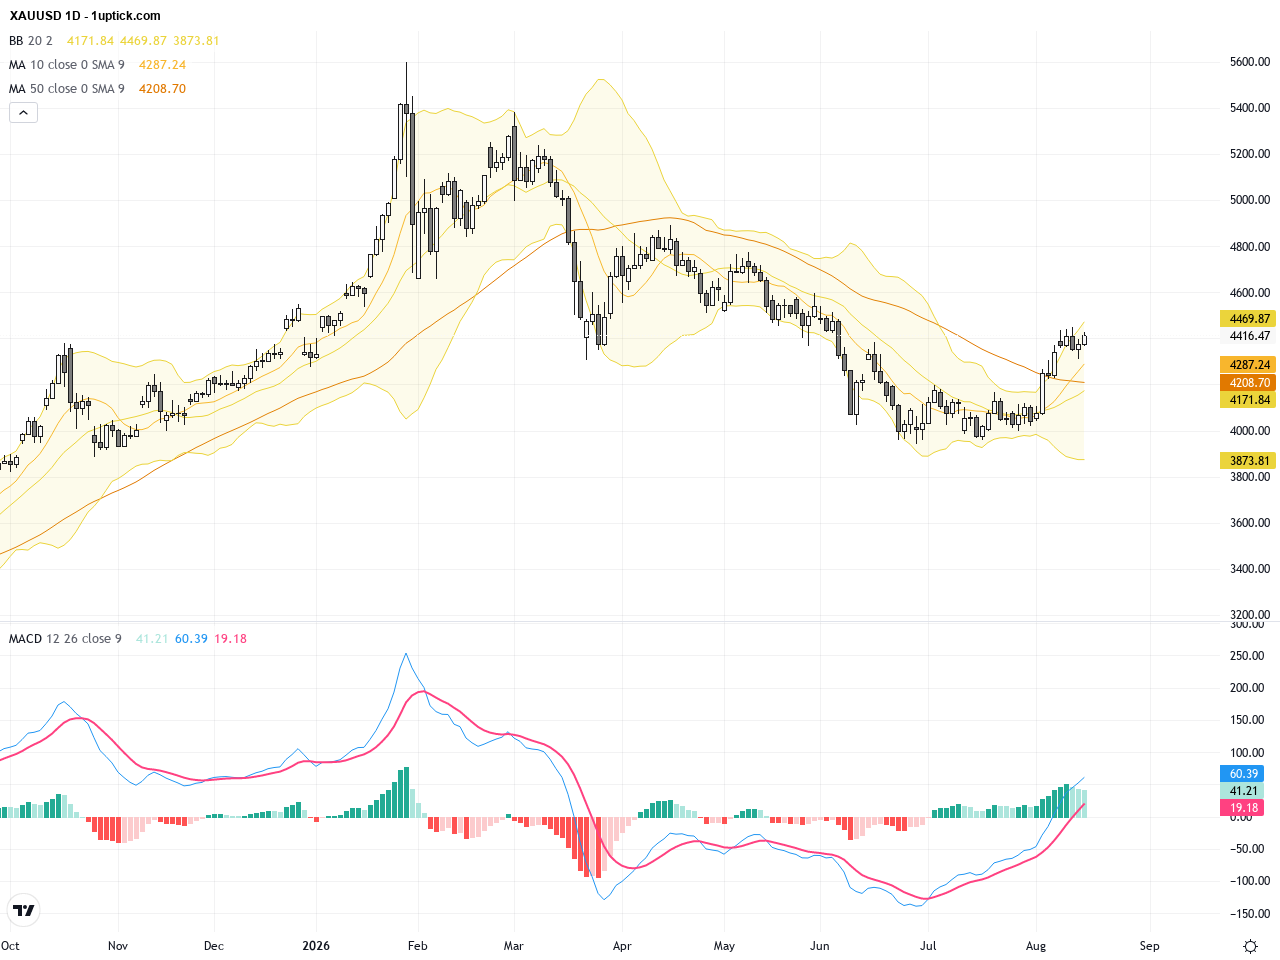
Over the past 24 to 48 hours, the gold (XAUUSD) market has staged a strong rebound, with prices climbing close to the $4395-$4400 level in early trading on August 18, 2026, nearly reaching a two-month high since yesterday’s close at $4415.715 per ounce. This surge was largely driven by the US dollar marking 55 years as a fiat currency, which strengthened gold’s appeal as a safe haven and attracted a fresh wave of investor interest.
While silver and natural gas futures have moved differently due to their own market drivers—silver grappling with risk appetite uncertainty and natural gas facing supply surplus—gold has benefited from strategic adjustments by prominent institutional holders. Reports highlight that some trillionaire-level investors are gradually reducing their gold holdings rather than exiting abruptly, which has altered liquidity dynamics and supported upward price momentum. Additionally, spot gold’s break above its 100-day moving average underscores renewed buying enthusiasm.
For the average investor, this recent gold price rally signals market caution amid ongoing geopolitical tensions and monetary policy unpredictability. Despite the US dollar’s firm position as the global reserve currency, gold’s traditional role as a store of value remains a vital shield. The current market movement suggests that holding gold continues to provide substantial defensive benefits in today’s volatile economic landscape.
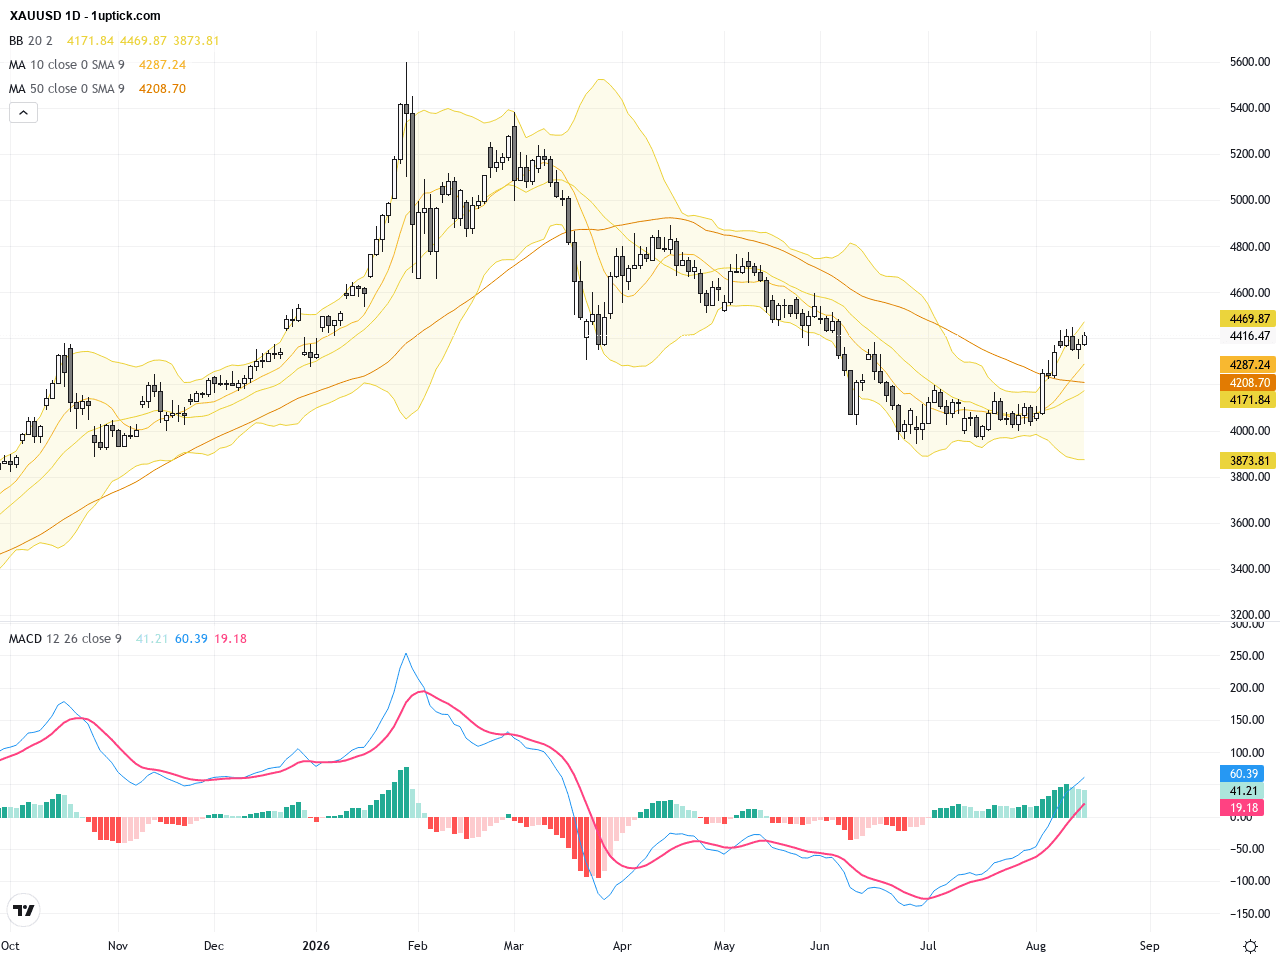
The daily chart reveals that XAUUSD has been steadily rising from lows near 4300 USD and recently broke above its 100-day moving average, marking a bullish breakout. Bollinger Bands are expanding, suggesting increasing volatility, while the MACD indicator has formed a bullish crossover above zero, reinforcing upward momentum. Overall, the longer-term trend shows strengthening bullish forces.
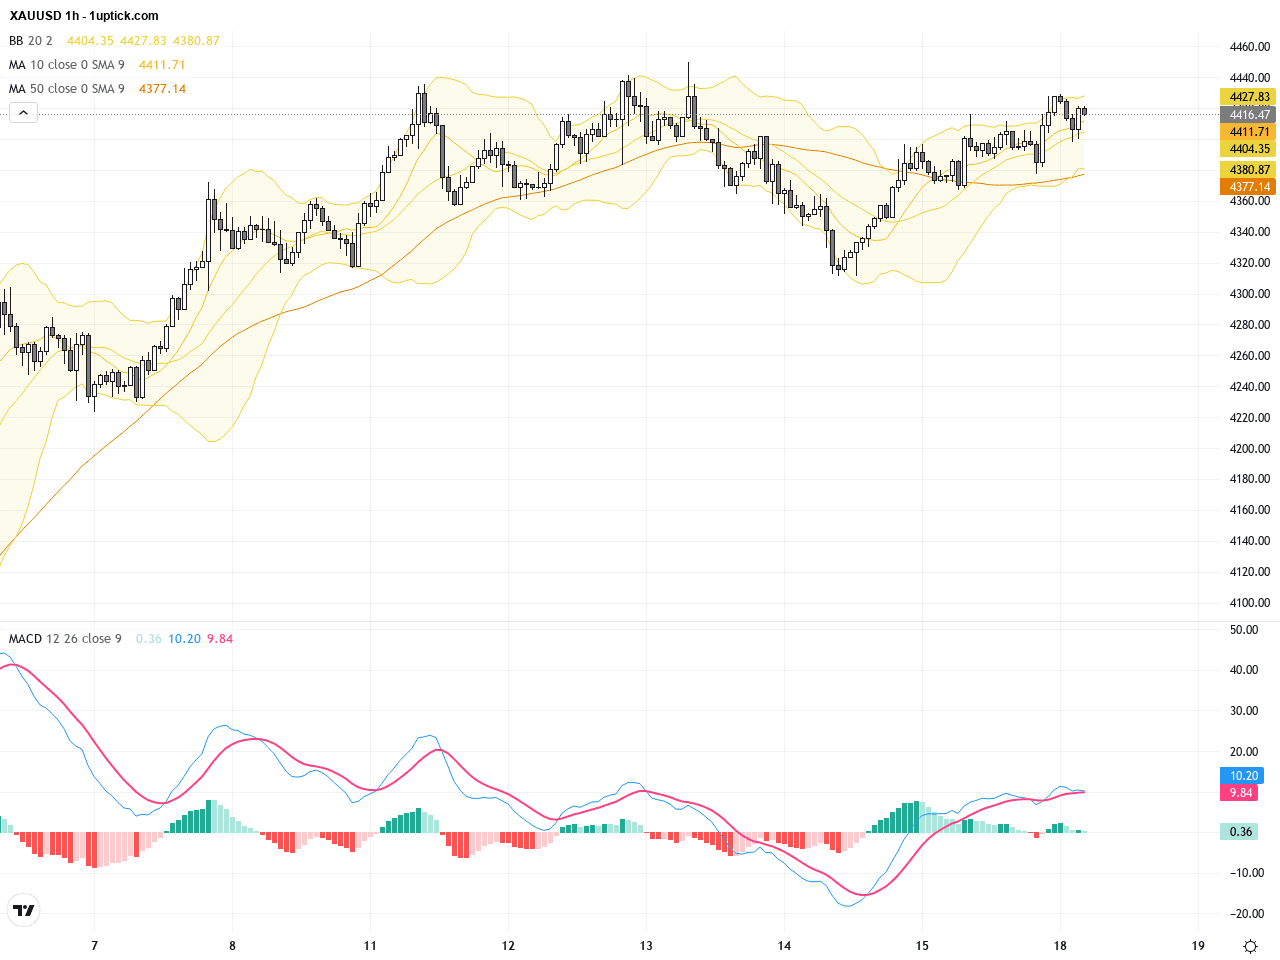
Analyzing the hourly chart over the last 5 days, price action has faced resistance around 4410 USD with oscillations. Short-term moving averages (20 and 50 EMA) show bullish alignment, yet the 4400 USD psychological level remains a challenge. A small triangle consolidation is visible alongside a recent bullish engulfing candlestick pattern, indicating buying pressure that could push prices toward recent highs. Volume is gradually increasing, setting the stage for potential breakout momentum.
Technical Trend: Strong bullish momentum with clear upward short-term technical trend, reflecting an optimistic trading outlook.
Technically, XAUUSD is at a critical juncture in its bullish trend. The MACD bullish crossover combined with expanding Bollinger Bands signal increased momentum, with the 100-day moving average acting as key support confirmation. Short-term hourly chart patterns like the triangle consolidation and bullish engulfing candlestick suggest a likely bullish breakout. Traders should watch for volume surges and breakthroughs of key resistance levels to seize high-probability trade setups.Today’s economic calendar includes Japanese GDP and industrial production data, which showed a moderate recovery but no direct major impact on gold. Notably, Canada’s core CPI and consumer price index slightly exceeded forecasts, potentially causing minor USD fluctuations and indirectly affecting XAUUSD. Overall, there are no major economic events directly triggering large gold price moves today. Market focus remains on the USD trends and safe-haven demand.
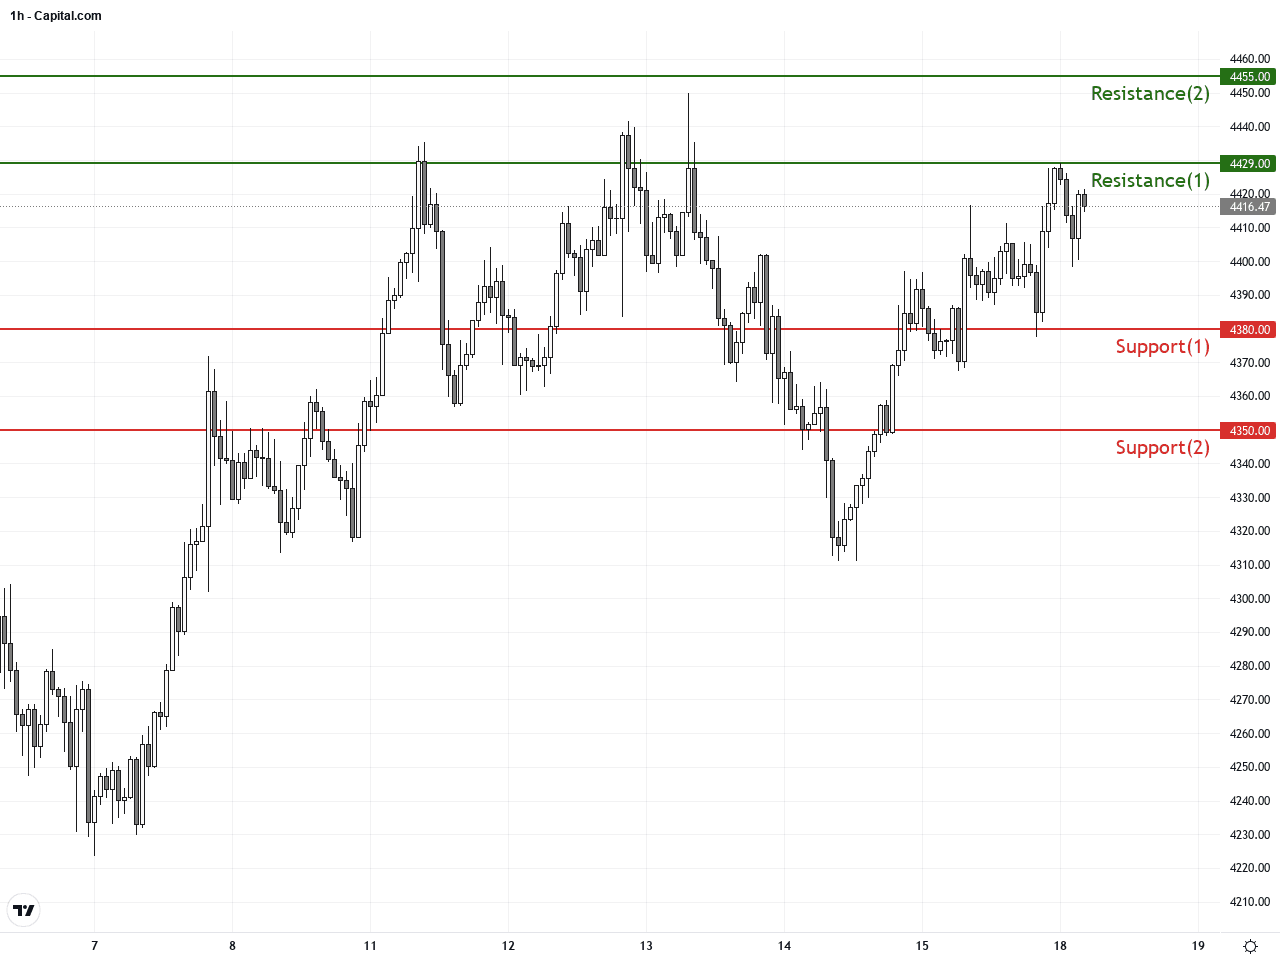
Resistance & Support
The above financial market data, quotes, charts, statistics, exchange rates, news, research, analysis, buy or sell ratings, financial education, and other information are for reference only. Before making any trades based on this information, you should consult independent professional advice to verify pricing data or obtain more detailed market information. 1uptick.com should not be regarded as soliciting any subscriber or visitor to execute any trade. You are solely responsible for all of your own trading decisions.