









 |
| Gold V.1.3.1 signal Telegram Channel (English) |
WTI Crude Oil: Middle East Tensions Propel Prices Higher with Technical Patterns Signaling Continued Momentum, August 20, 2026
2026-08-20 @ 06:03
Over the past 24 to 48 hours, WTI Crude Oil prices saw notable volatility, edging up slightly from yesterday’s closing price of $84.39. The market’s focus has been on escalating tensions in the Middle East, particularly the standoff between the US and Iran, which has heightened supply risks and pushed oil prices to a three-week high.
Recent reports indicated that Iran fired ballistic missiles toward the Strait of Hormuz, a key oil shipping route, sparking fears of potential supply disruptions. This risk premium has driven oil futures higher and encouraged investors to seek capital-efficient, leveraged exposure tools like UCO to capitalize on the upward momentum in oil prices.
Additionally, the weakening US dollar has further supported crude prices, as a softer dollar tends to make dollar-denominated commodities more attractive to buyers using other currencies. For the average investor, this means that regional geopolitical uncertainties combined with currency factors are currently driving oil market prices higher, making energy assets a focal point of interest.
In summary, WTI crude oil has demonstrated robust upward momentum in the short term, fueled by rising geopolitical risks and growing risk-off sentiment, reflecting strong market participation and energy demand concerns.
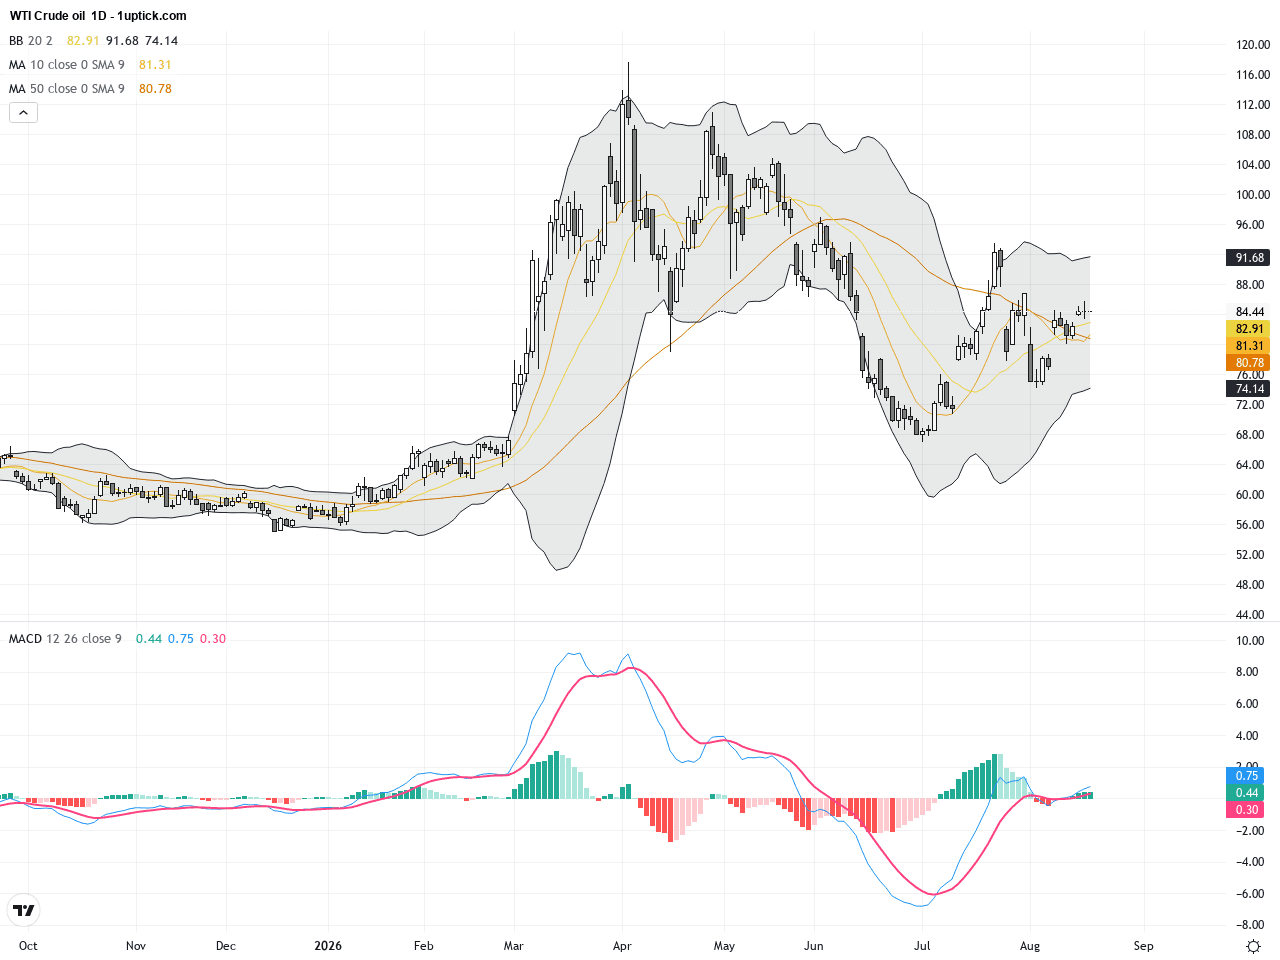
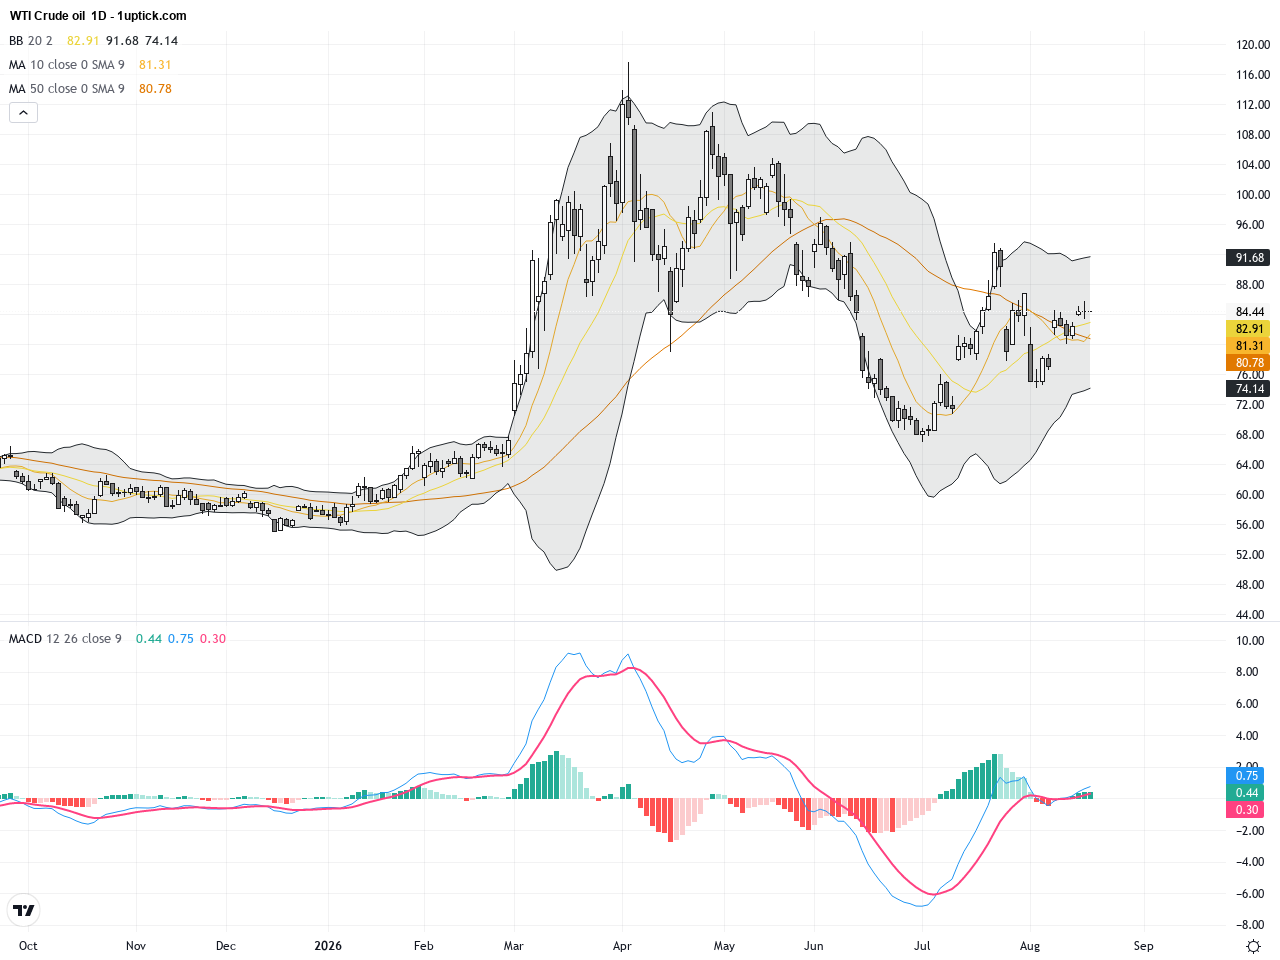
The daily chart reveals an upward trend for WTI crude oil, rebounding from lows near $82 to highs above $85 recently. Bollinger Bands are contracting with prices mainly trading between the middle and upper bands, indicating bullish control. The MACD remains in positive territory, confirming steady trend momentum. The 50-day moving average is sloping upwards, supporting sustained bullishness over a longer-term horizon. A dominant ascending flag pattern appears to have formed since August 13, signaling potential further breakout above resistance levels.
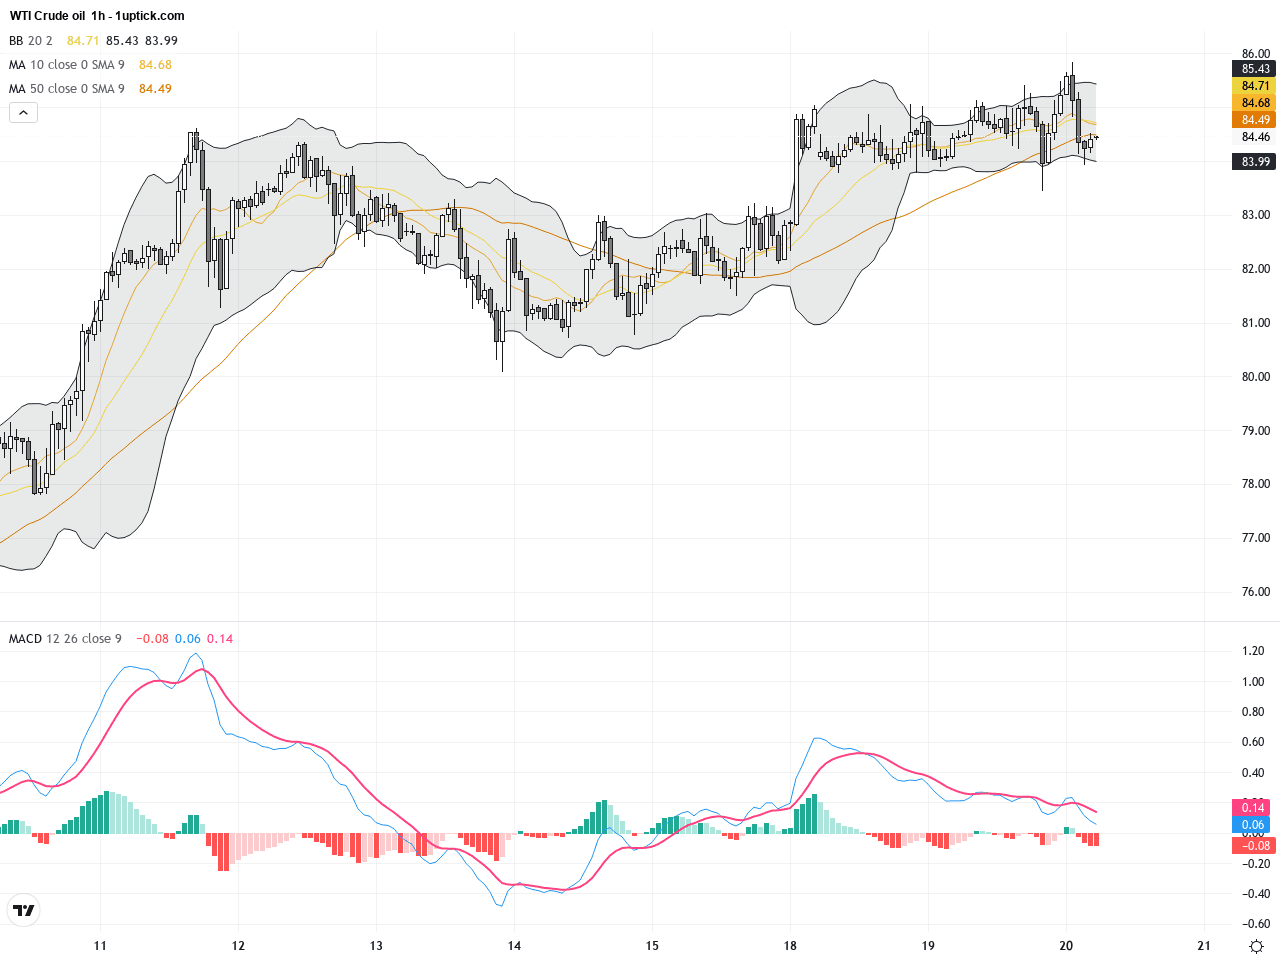
On the hourly chart, WTI oil exhibited several swings between $83.45 and $85.84 over the last 3-5 days. Prices oscillate near the 20 and 50 EMAs indicating a mild bullish consolidation. A recent bullish engulfing candlestick pattern suggests possible continuation of the rebound in the next 24 hours. Bollinger Bands are expanding, indicating increasing volatility ahead.
Technical Trend: WTI crude oil currently exhibits a cautiously bullish trend, consolidating near highs while searching for a breakout.
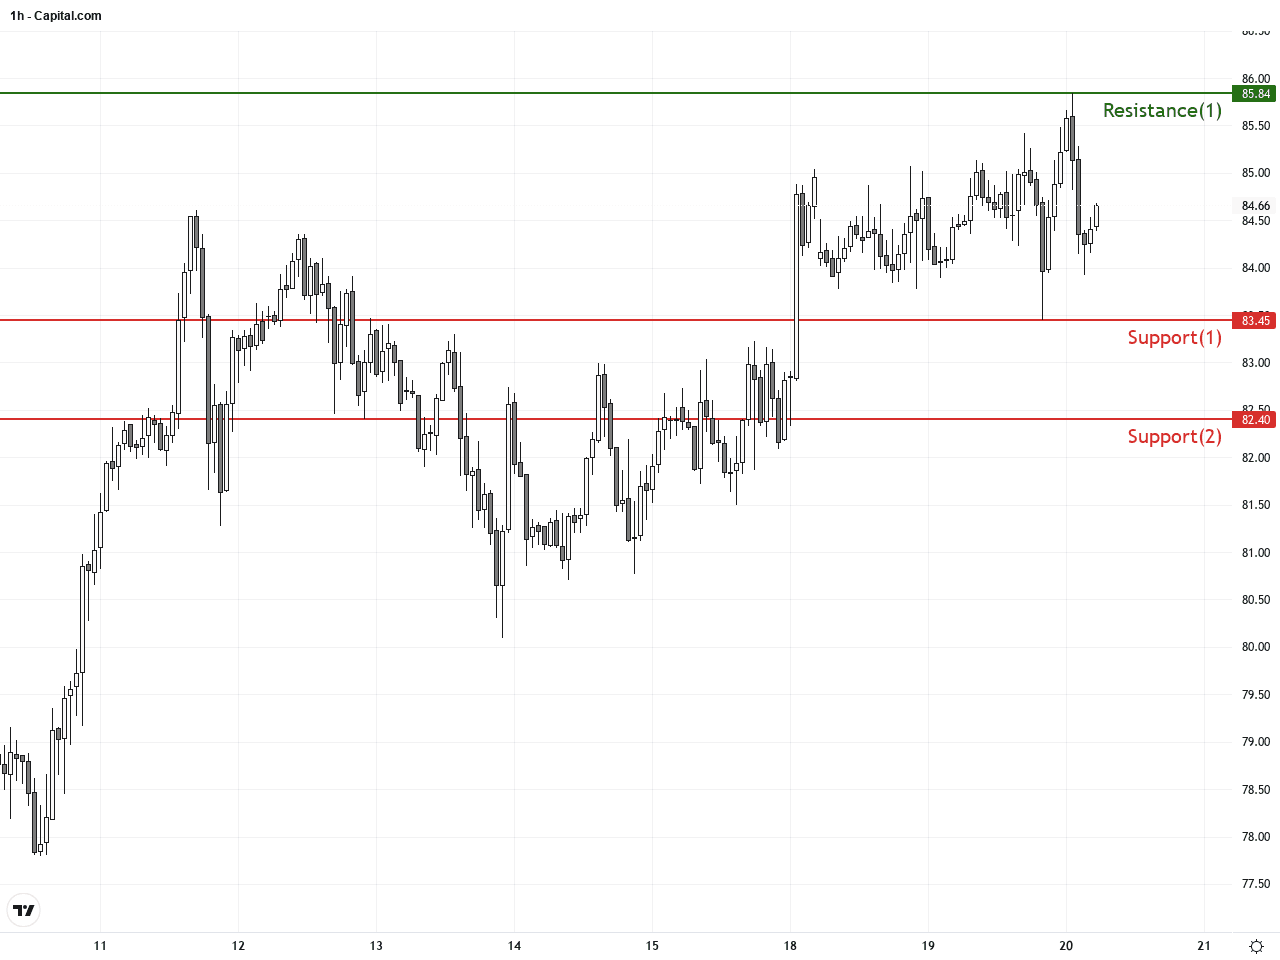
Technical analysis shows a strong MACD bullish crossover and robust daily trend momentum supporting upward movement. The bullish engulfing candlestick on the hourly chart signals potential short-term price appreciation. Solid moving average supports combined with elevated supply risk concerns create a bullish backdrop. Traders might watch for a breakout above $85.5 to capture possible further gains.There are no significant or directly relevant economic events impacting WTI crude oil scheduled for today. Traders should keep an eye on ongoing geopolitical developments in the Middle East and upcoming global economic data which may influence oil prices longer term.
Resistance & Support
Run Live WTI Crude Oil Analysis
The above financial market data, quotes, charts, statistics, exchange rates, news, research, analysis, buy or sell ratings, financial education, and other information are for reference only. Before making any trades based on this information, you should consult independent professional advice to verify pricing data or obtain more detailed market information. 1uptick.com should not be regarded as soliciting any subscriber or visitor to execute any trade. You are solely responsible for all of your own trading decisions.