









 |
| Gold V.1.3.1 signal Telegram Channel (English) |
AUDUSD Technical Rebound Breaks Key Resistance, Watch 0.7135 Level for Next Move, August 21, 2026
2026-08-21 @ 06:01
Over the past 24 to 48 hours, the AUD/USD currency pair experienced notable volatility with yesterday’s closing price at 0.71086 USD. After opening, the Australian Dollar initially dropped sharply following the release of a weak employment report, which shook investors’ confidence in Australia’s economic outlook. However, the AUD quickly recovered as the US Dollar broadly weakened, demonstrating some resilience.
Recent market news highlights that the Aussie’s rebound was largely due to the USD’s softness limiting further downside, while traders remain cautious ahead of the upcoming US Nonfarm Payroll data. The mixed Australian economic signals combined with global uncertainty—such as geopolitical tensions in the Middle East and central bank policy considerations—have created a complex environment for currency movements.
For the average investor, this situation is akin to dealing with a nation experiencing a slowdown whilst global risks keep markets on edge, leading to cautious capital flow. The fluctuations in AUD/USD serve as a reminder to weigh both domestic economic fundamentals and international factors carefully when making trading decisions, and to navigate short-term volatility prudently.
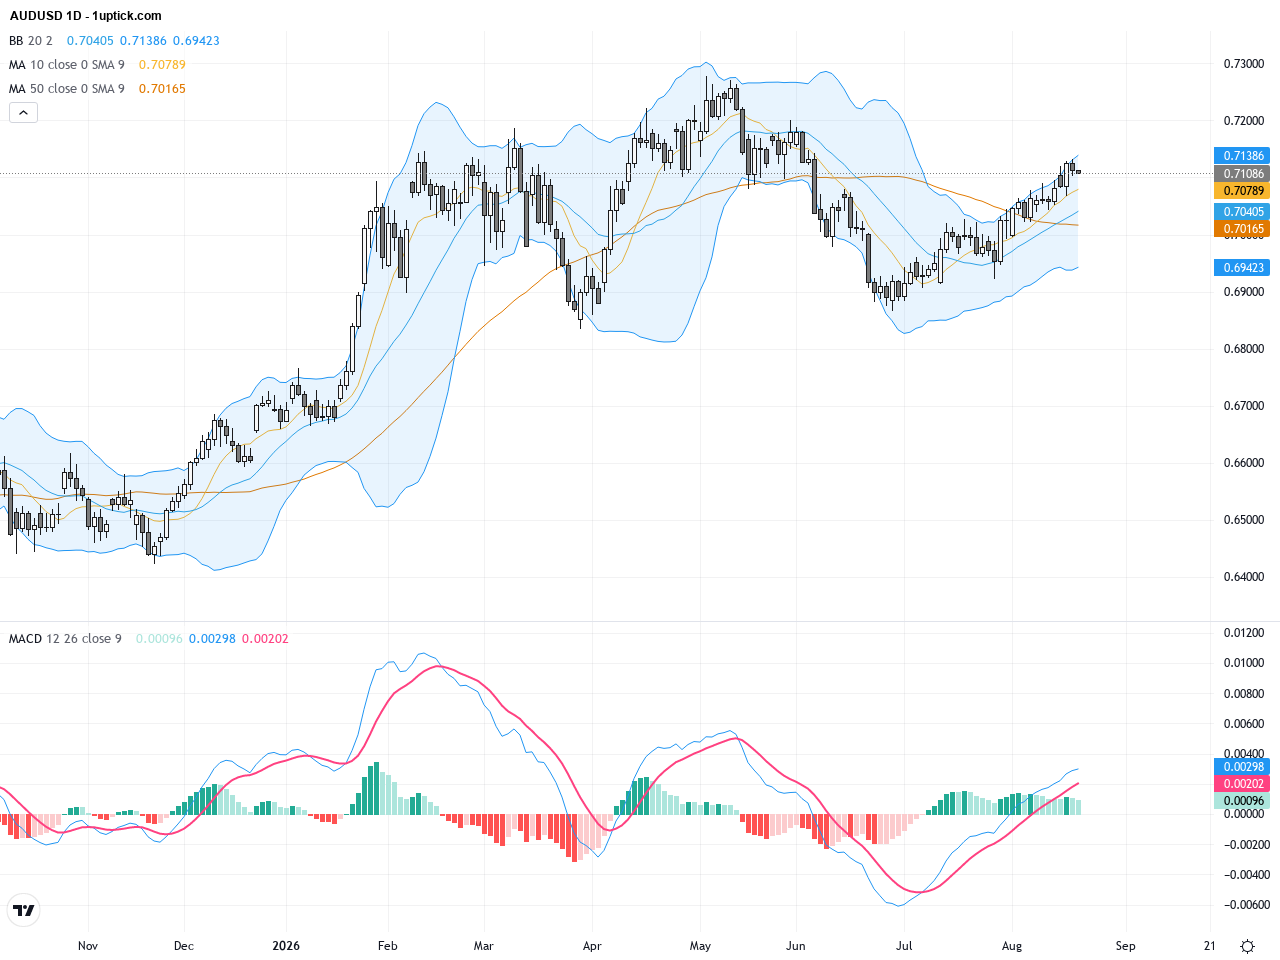
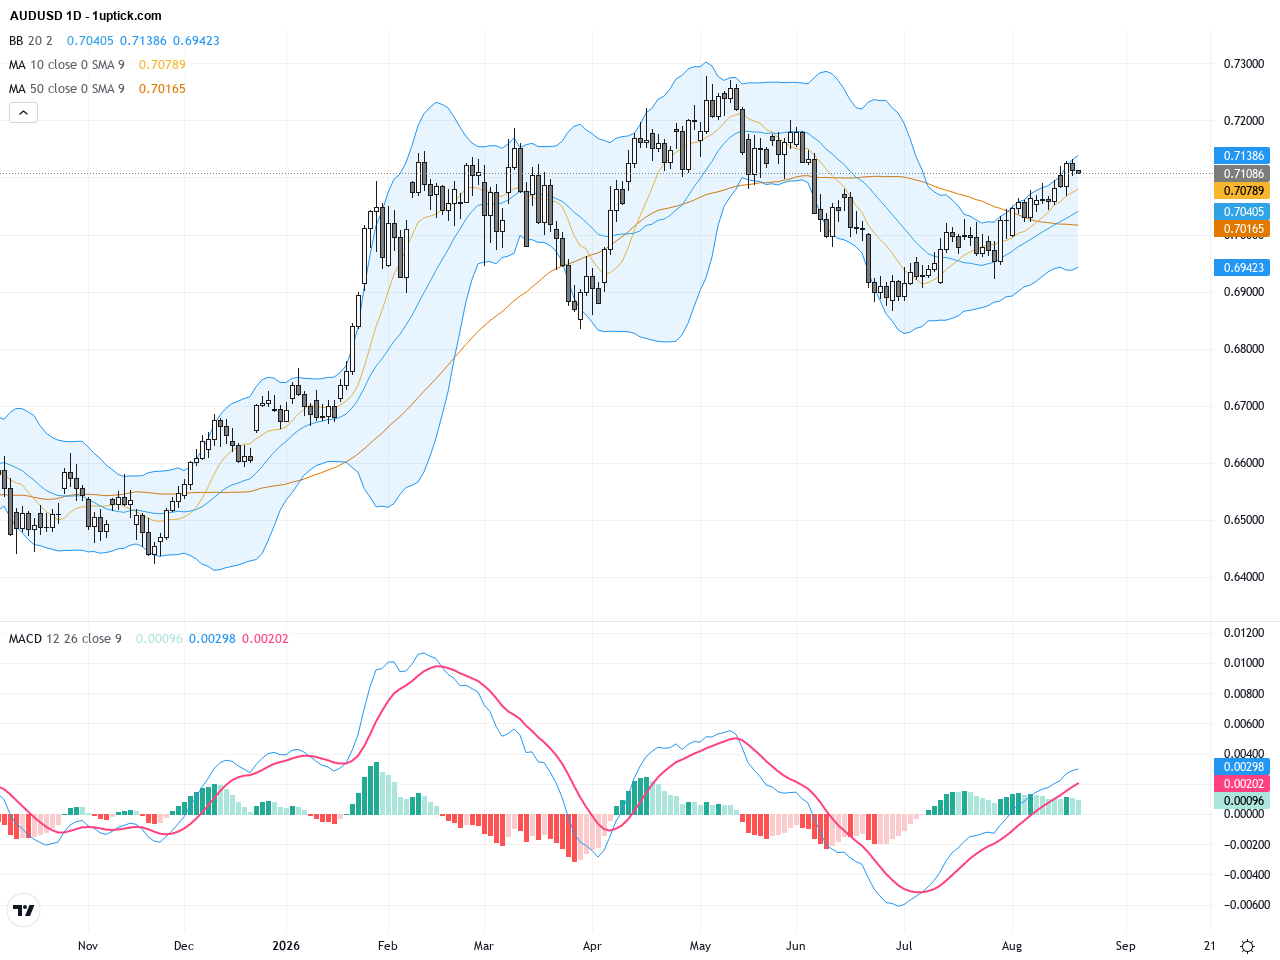
On the daily chart, AUDUSD has recently rebounded from a bottom and successfully broken above a significant descending trendline, indicating a return of bullish momentum. The price is well above the 200-day moving average around 0.6934, reinforcing a medium to long-term bullish bias. Bollinger Bands are contracting, suggesting reduced volatility and a possible forthcoming breakout. The MACD histogram is expanding with a bullish crossover forming, supporting continued upside in the coming days. Overall, the daily trend has shifted from bearish to bullish, resuming a positive medium-term outlook.
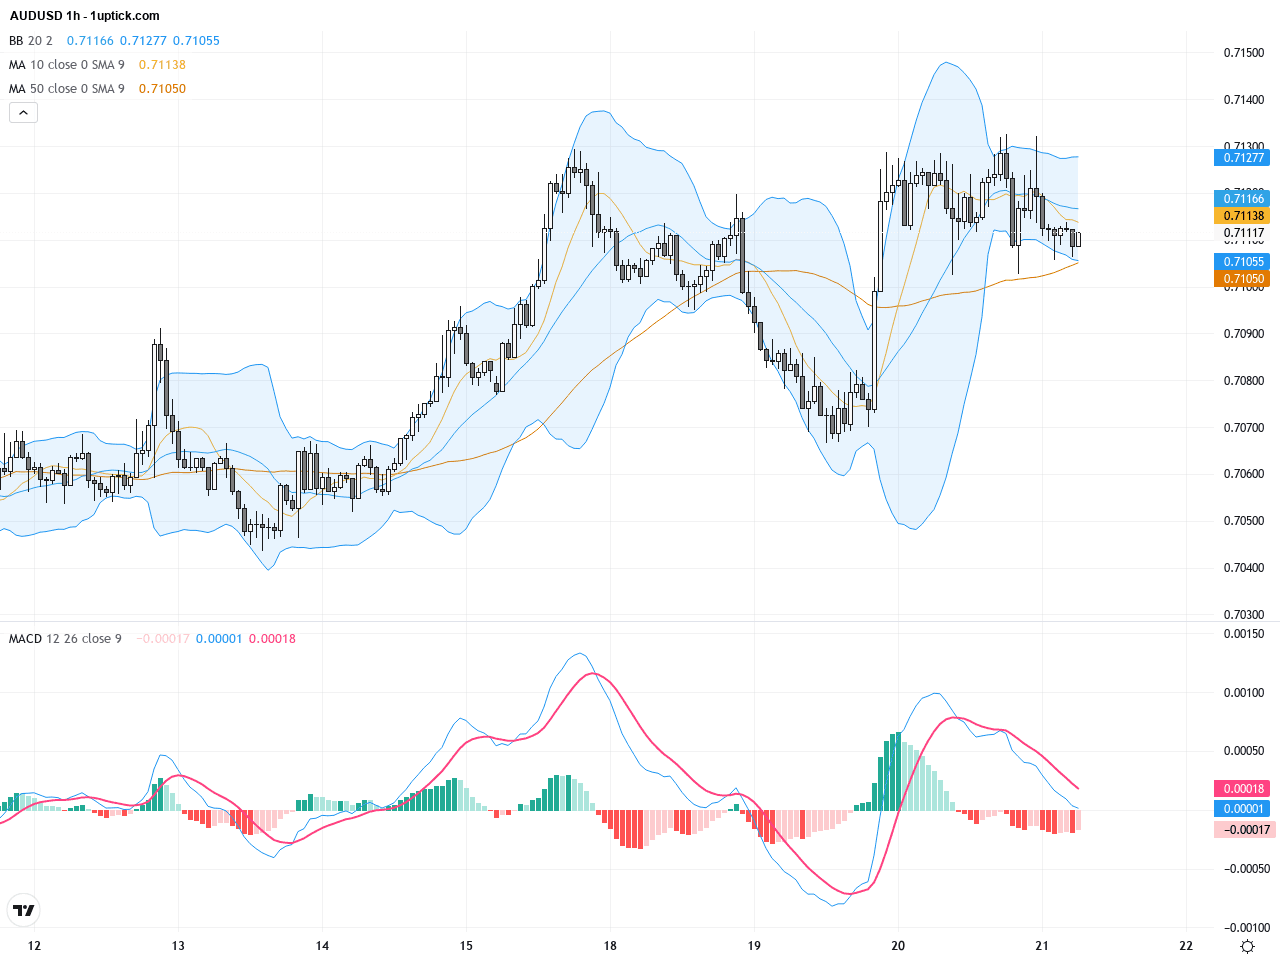
The hourly chart shows price oscillating between 0.7080 and 0.7135 over the past 3-5 days. Recently, the price broke above the 21-hour EMA and MACD lines are trending upward, indicating renewed short-term buying pressure. The middle line of the Bollinger Bands has provided support repeatedly, along with bullish engulfing candlestick formations, signaling strengthening momentum that could extend into the next trading day.
Technical Trend: Trend Assessment: Cautiously bullish with price consolidating and gradually moving upward.
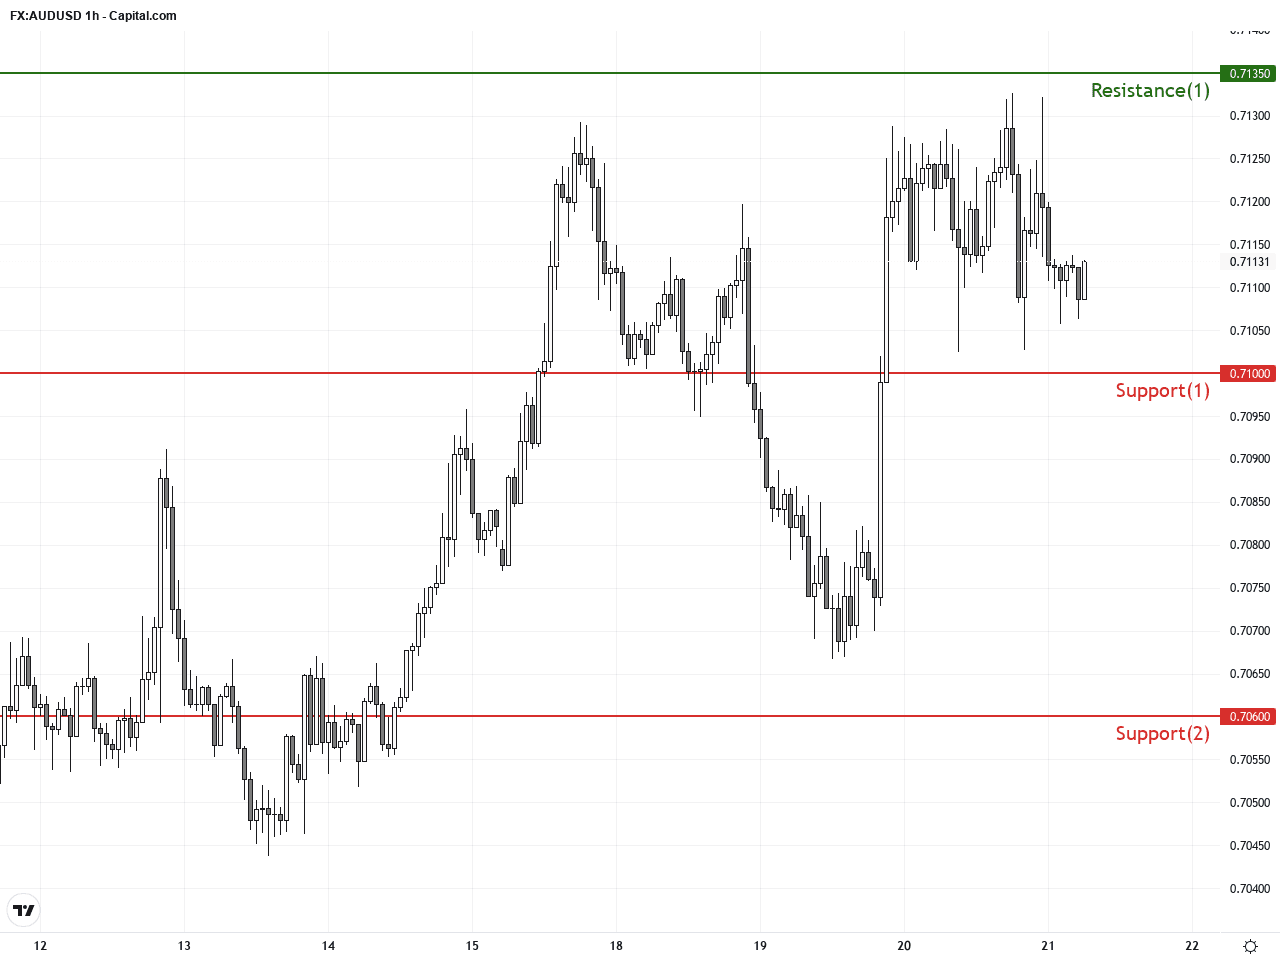
Technical indicators highlight a bullish MACD crossover on the daily chart combined with a confirmed break above the descending trendline, suggesting potential for further gains. On the hourly chart, recent bullish engulfing candles alongside rising MACD reinforce the positive momentum. The key resistance at 0.7135 stands as the next obstacle; a decisive break above could open the door for an extended rally. Traders should watch volume and momentum shifts closely to identify high-probability trade entries.Today’s economic calendar in GMT+1 has no major events directly impacting AUDUSD. Key Japanese CPI and Manufacturing PMI data will be released later, but these are unlikely to affect the Aussie Dollar significantly. Market focus remains on the upcoming US manufacturing and services PMI reports, which will be critical for the US Dollar and thus influence AUDUSD’s direction. In the absence of immediate major events, price action is likely to follow existing technical momentum.
Resistance & Support
The above financial market data, quotes, charts, statistics, exchange rates, news, research, analysis, buy or sell ratings, financial education, and other information are for reference only. Before making any trades based on this information, you should consult independent professional advice to verify pricing data or obtain more detailed market information. 1uptick.com should not be regarded as soliciting any subscriber or visitor to execute any trade. You are solely responsible for all of your own trading decisions.