








 |
| Gold V.1.3.1 signal Telegram Channel (English) |
GBPUSD Nears Six-Month High with Strong Technical Momentum and Upbeat Trading Outlook, August 21, 2026
2026-08-21 @ 13:01
Over the past 24 to 48 hours, the British Pound against the US Dollar (GBP/USD) has shown strength, reaching near 1.3650 in intraday trading, edging slightly higher than yesterday’s close of 1.36432. Market attention is firmly on the upcoming UK Retail Sales data, which investors are eagerly awaiting.
The US Dollar has been softening recently, serving as a key driver behind the pound’s lift. The Dollar Index (DXY) remains under pressure amid shifting market expectations around the Federal Reserve’s future rate hikes. Latest economic releases from the US, notably weaker retail and consumer data, have cooled bets on aggressive Fed tightening.
This week, the pair has been supported by a combination of surprise US fiscal moves and shifting inflation expectations, alongside a comparatively hawkish Bank of England stance. This divergence in monetary policies has sustained GBP/USD’s strength in recent trading sessions.
For everyday investors, this means the pound’s recent appreciation is not only a reflection of improving UK economic fundamentals but also shaped by uncertainties surrounding the US economy and adjustments in Fed rate hike expectations. Watching the upcoming UK Retail Sales report closely is crucial as it will guide the pound’s next directional moves and market volatility.
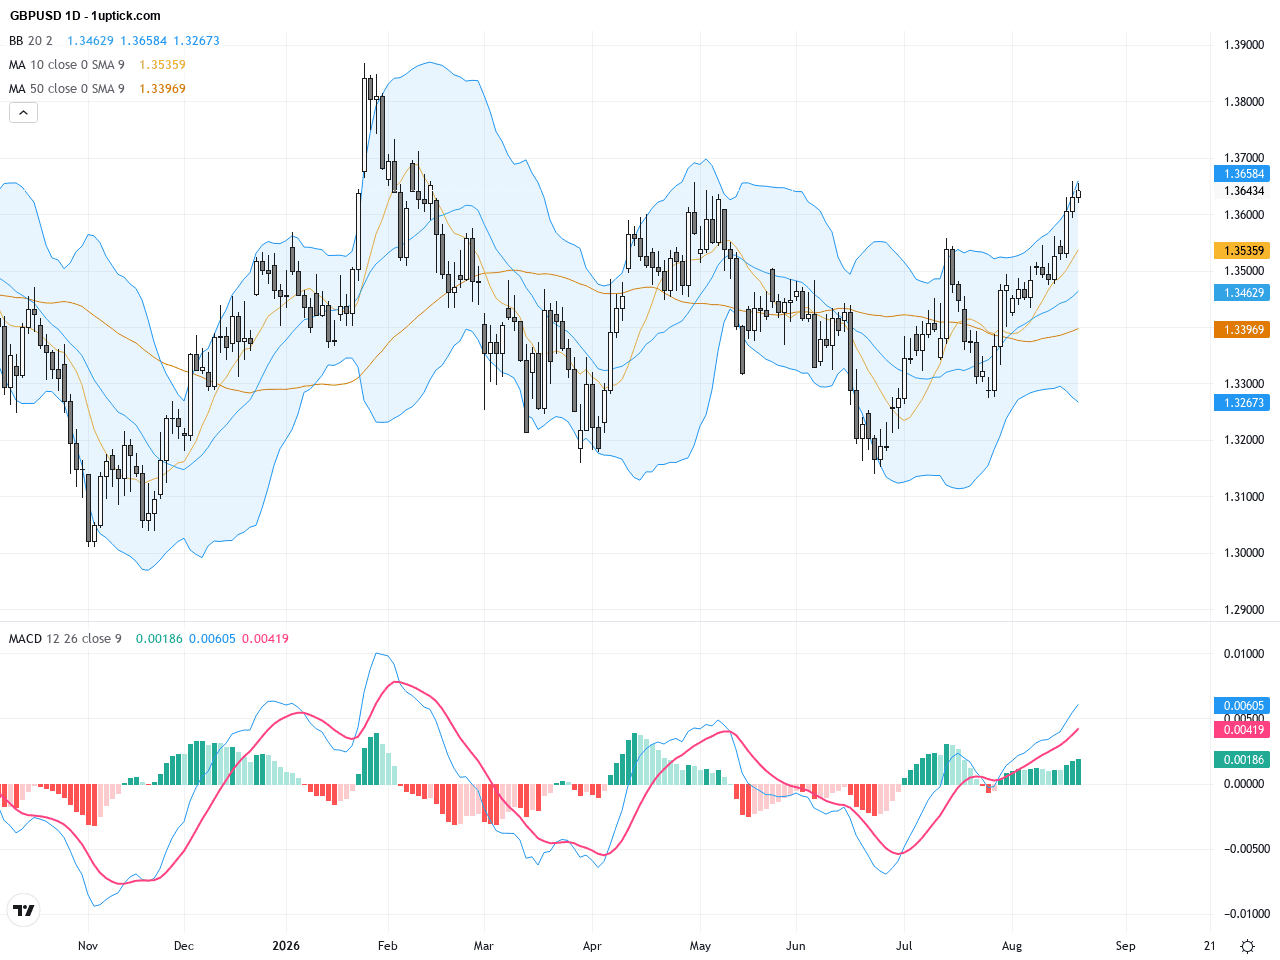
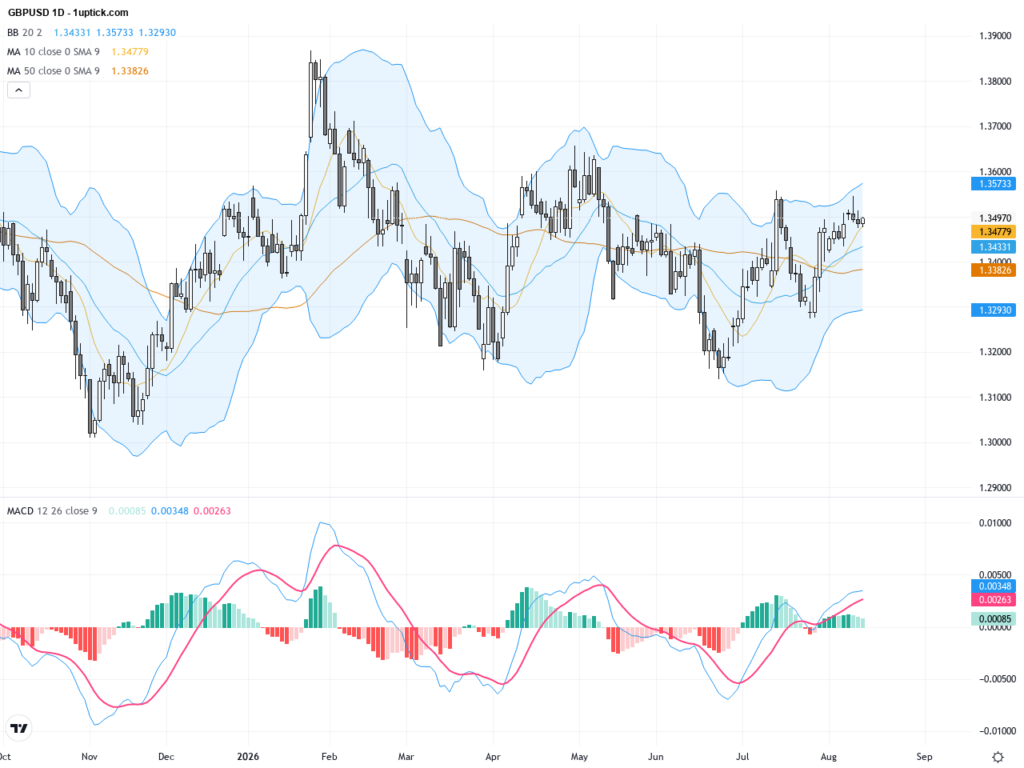
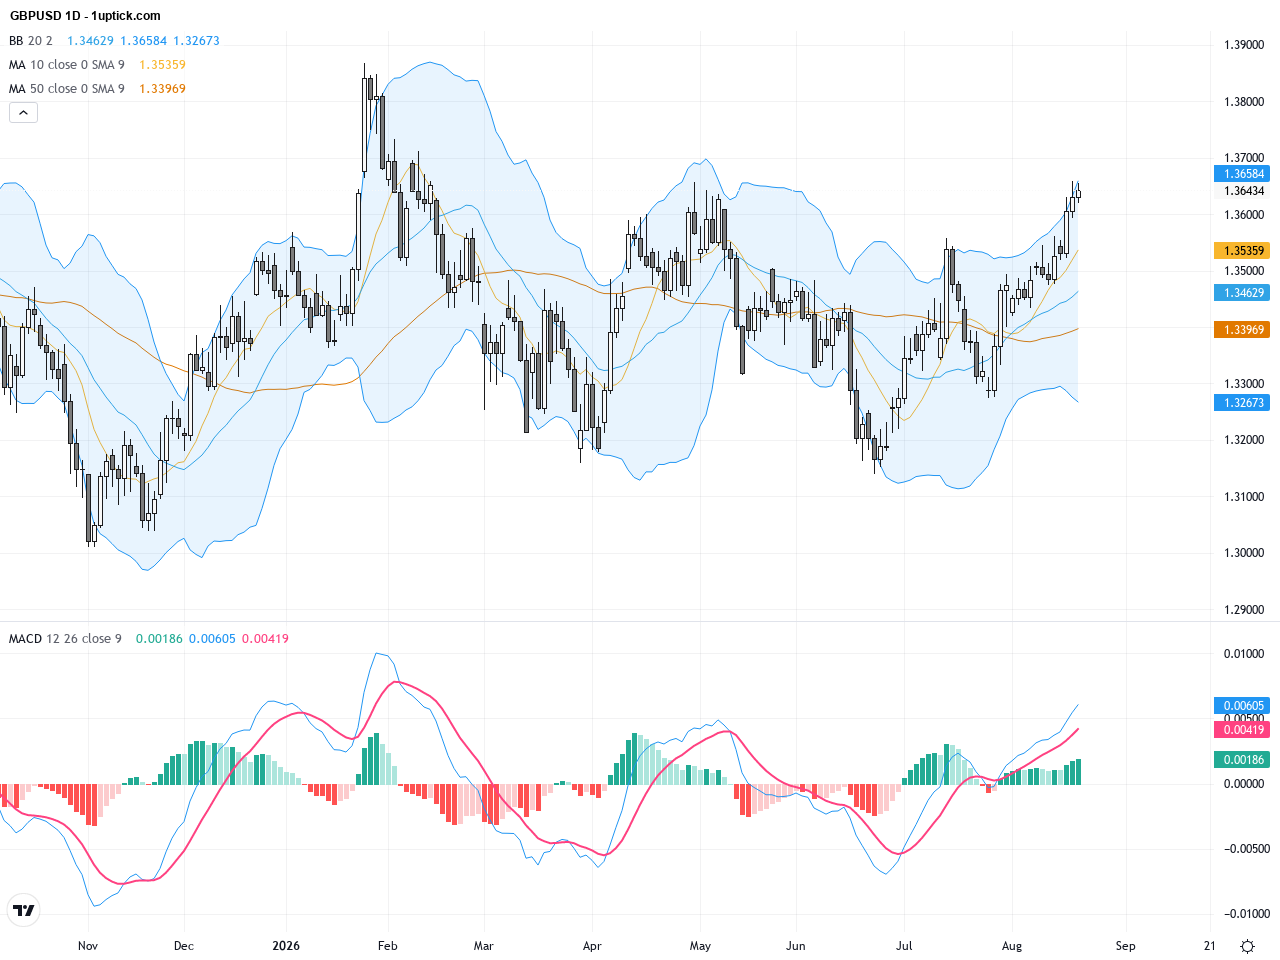
The daily chart shows a strong uptrend with GBPUSD trading above both the 50-day and 200-day moving averages, confirming medium to long-term bullish momentum. The Bollinger Bands are widening, signaling increased volatility. The MACD remains decisively above the zero line, endorsing the ongoing buying momentum. Overall, daily price action supports a confident bullish outlook with solid buyer control.
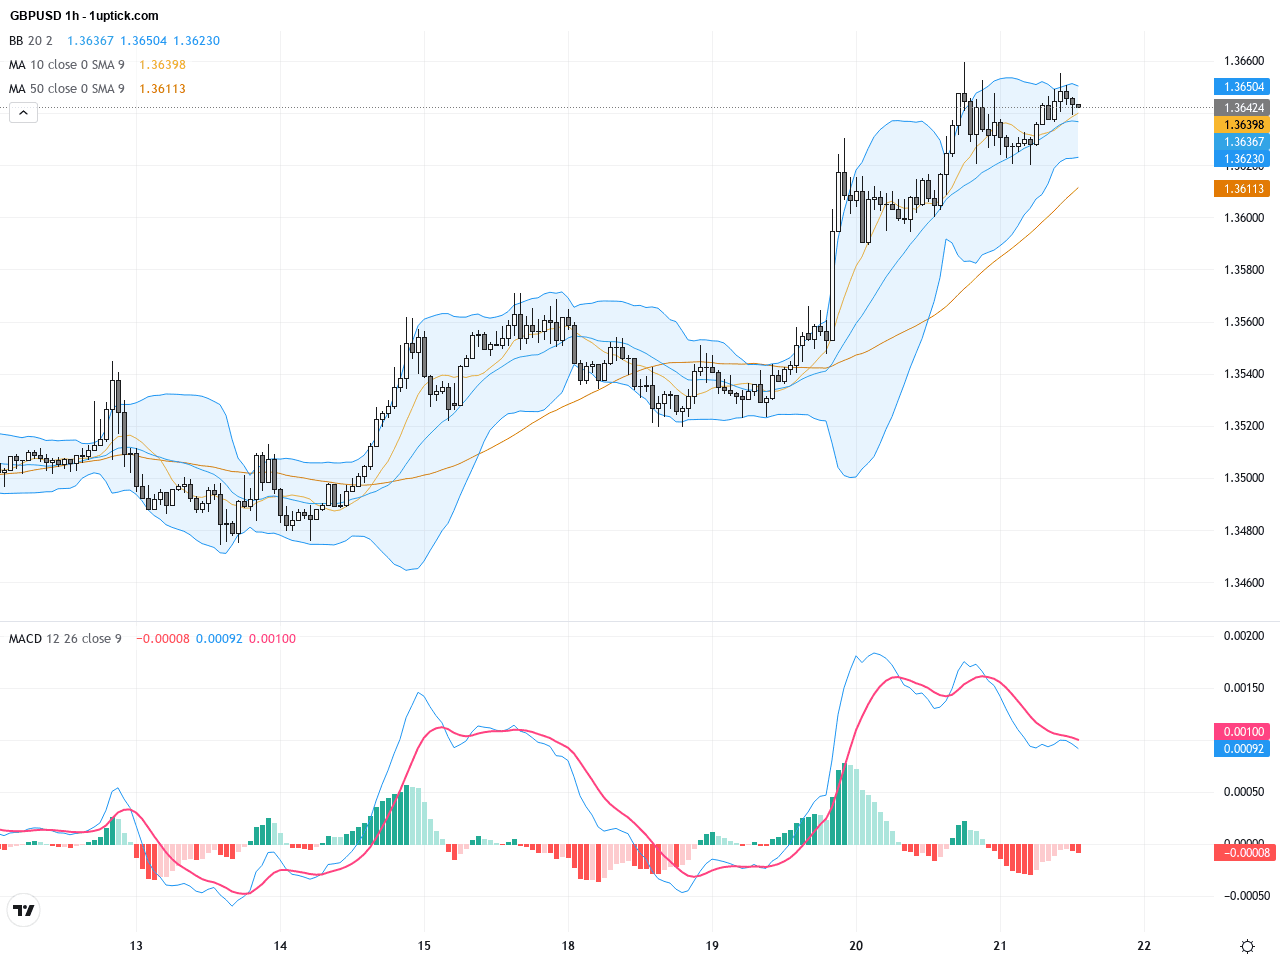
In the last 3-5 days on the hourly chart, GBPUSD has been consolidating with a gradual upward bias. Price action has repeatedly tested the resistance zone between 1.3640 and 1.3655, building potential for a breakout. The price currently sits above the middle Bollinger Band, with short-term moving averages showing a bullish crossover. A recent bullish engulfing candlestick pattern reinforces the likelihood of a near-term push higher.
Technical Trend: Strong Uptrend
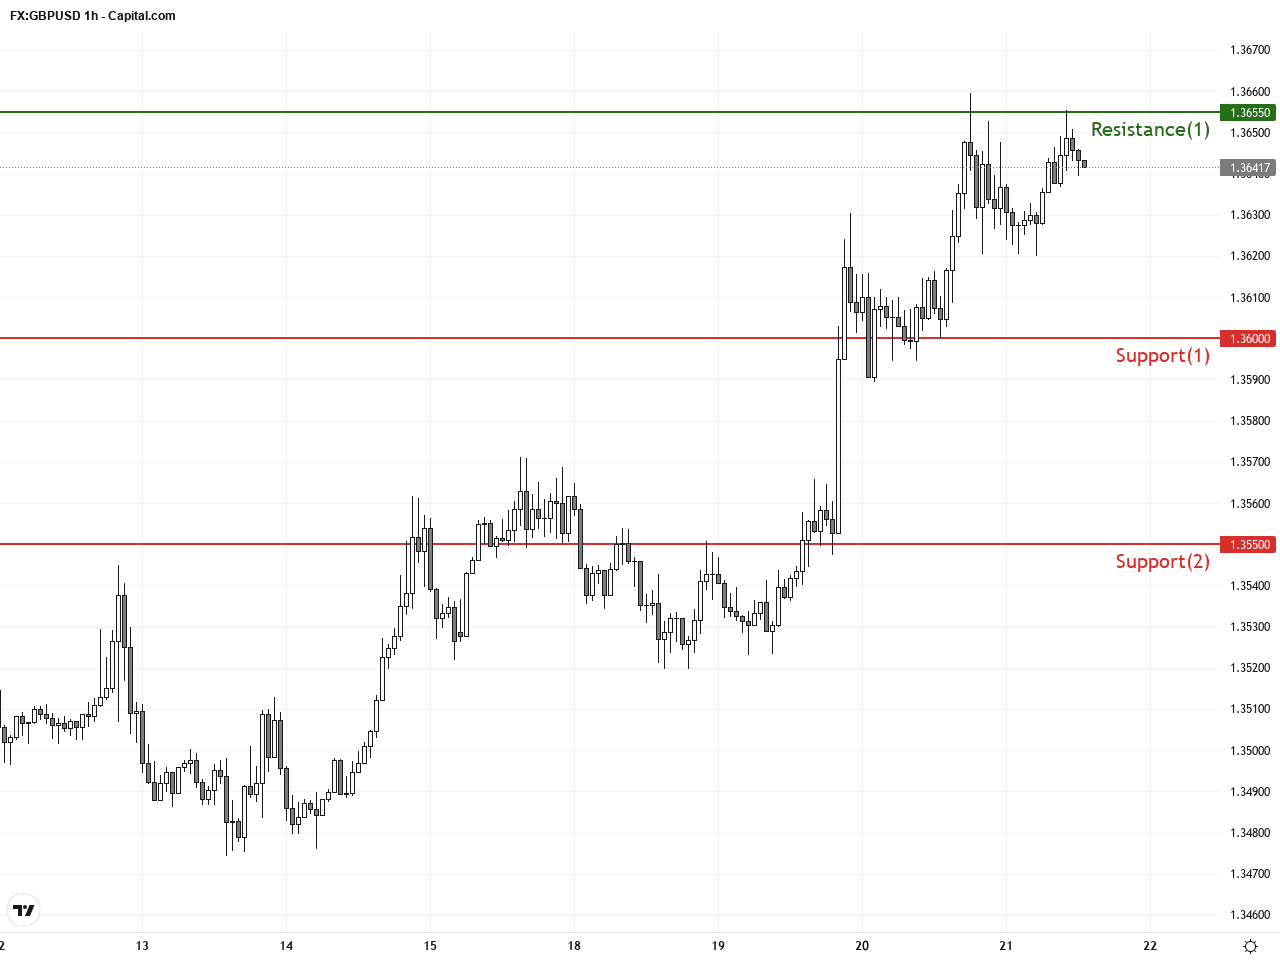
Technically, GBPUSD is firmly in an upward trend with the MACD showing sustained bullish momentum and RSI comfortably below overbought thresholds, allowing room for further gains. The confluence of bullish signals on daily and hourly charts, including the recent bullish engulfing candle, highlight a favorable setup for buyers. Traders should watch closely for a break above 1.3655 and the reaction to forthcoming UK retail sales data to confirm the next leg higher.Today’s GMT+1 calendar does not present any immediate UK or US major economic data releases. However, the upcoming UK July retail sales report remains pivotal for GBPUSD’s short-term movement. A stronger-than-expected reading would boost pound strength, while a weaker report could trigger pullbacks. Other releases such as Japan’s CPI and New Zealand’s trade balance are unlikely to impact GBPUSD materially.
Resistance & Support
The above financial market data, quotes, charts, statistics, exchange rates, news, research, analysis, buy or sell ratings, financial education, and other information are for reference only. Before making any trades based on this information, you should consult independent professional advice to verify pricing data or obtain more detailed market information. 1uptick.com should not be regarded as soliciting any subscriber or visitor to execute any trade. You are solely responsible for all of your own trading decisions.