

 |
| Gold V.1.3.1 signal Telegram Channel (English) |
XAUUSD Gold Technical & Fundamental Analysis: Focus on Two-Month High and Support Levels, August 21, 2026
2026-08-21 @ 05:04
Over the past 24 to 48 hours, the gold (XAUUSD) market has demonstrated clear strength, with prices steadily climbing to recent highs; yesterday’s closing price was $4518.535 per ounce. This bullish move was primarily driven by the US Treasury’s announcement to expand its buyback program for long-dated government bonds, prompting investors to adjust their portfolios and fueling a surge in safe-haven demand for gold.
According to the latest market news, gold and silver surged up to 15% over the last two weeks, driven by shifts in the global financial landscape, particularly declining interest rates and bond yields alongside a weaker US dollar. The Treasury’s action helped push long-term yields lower, enhancing gold’s appeal as a non-yielding asset becomes more attractive when returns on bonds diminish.
For the average investor, this price movement highlights increasing demand for safety and a shift in market sentiment. If concerns over stock volatility or dollar weakness arise, gold acts as a reliable portfolio diversifier and hedge. In simple terms, gold serves as a financial safe harbor during times of global uncertainty or US dollar softness, helping investors shield their wealth from steep market swings.
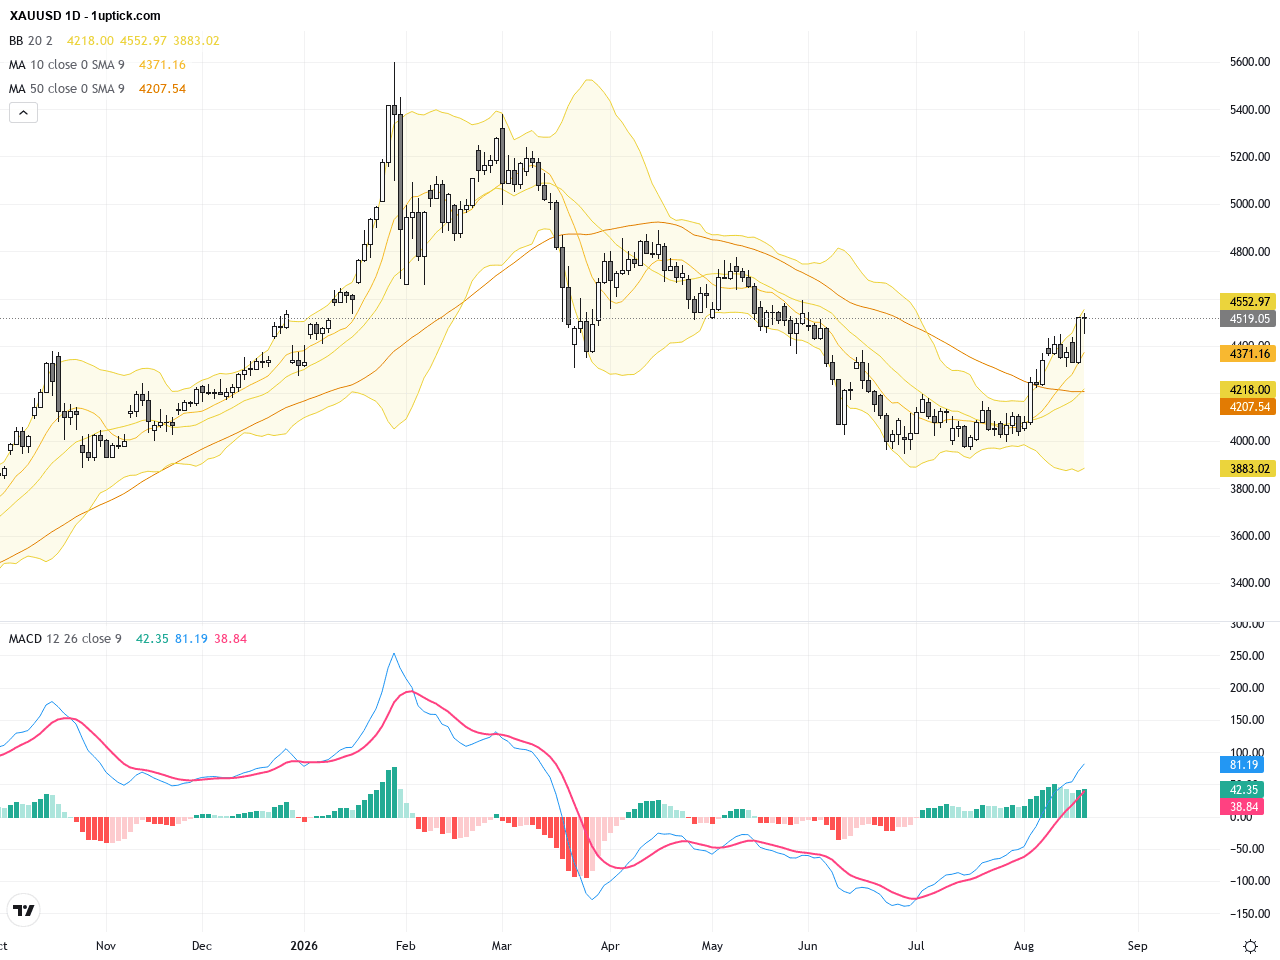
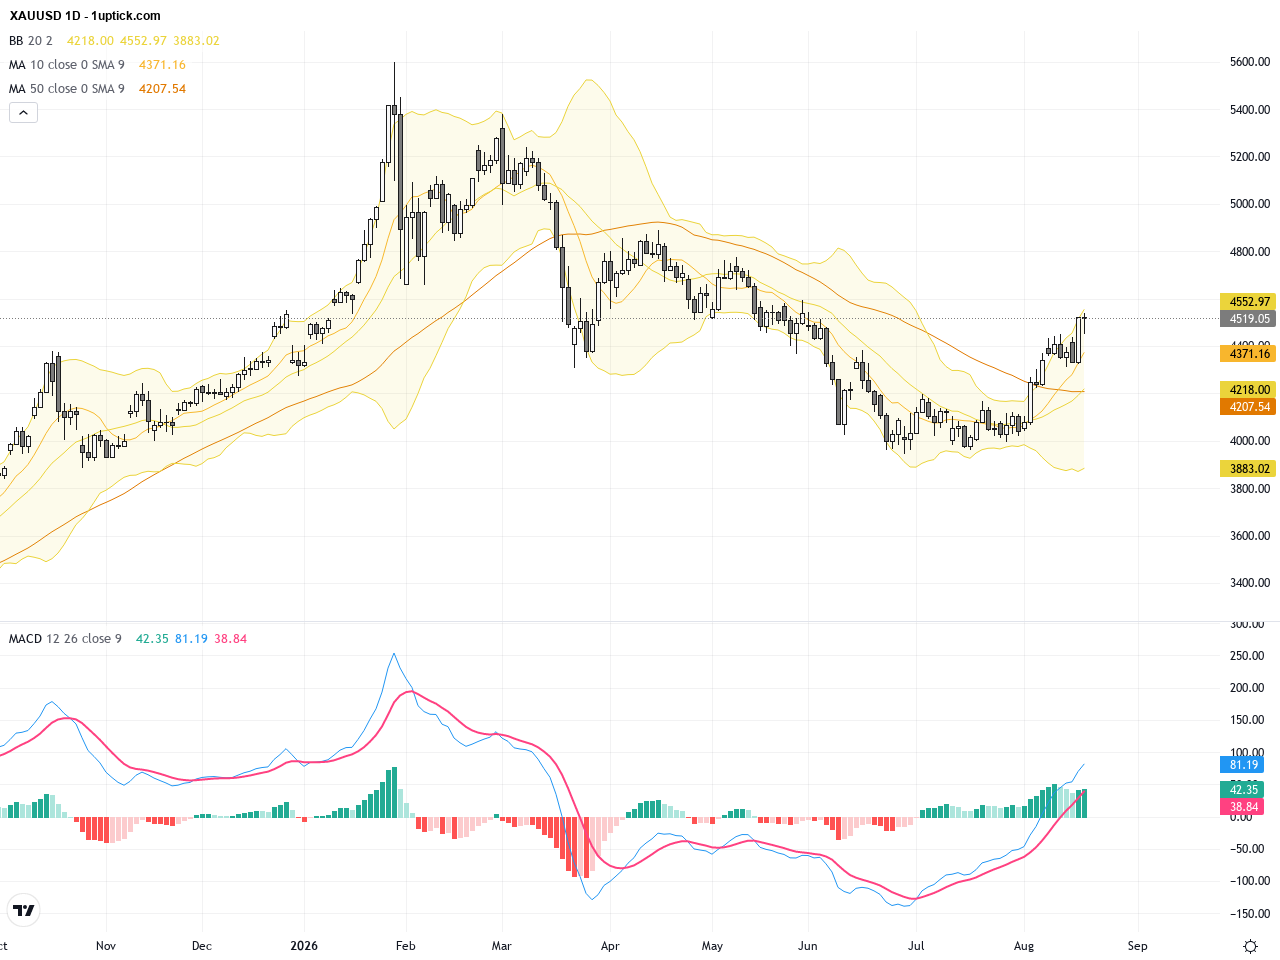
The daily chart of XAUUSD displays a sustained uptrend starting from around $4,000 early this month to above $4,500 currently. Price stays firmly above the 100-day moving average, with Bollinger Bands widening, indicating increased volatility. The MACD remains bullish but shows signs of momentum slowing. A minor ascending triangle pattern has formed since early August, suggesting a continued upward breakout potential while acknowledging possible corrective pressures.
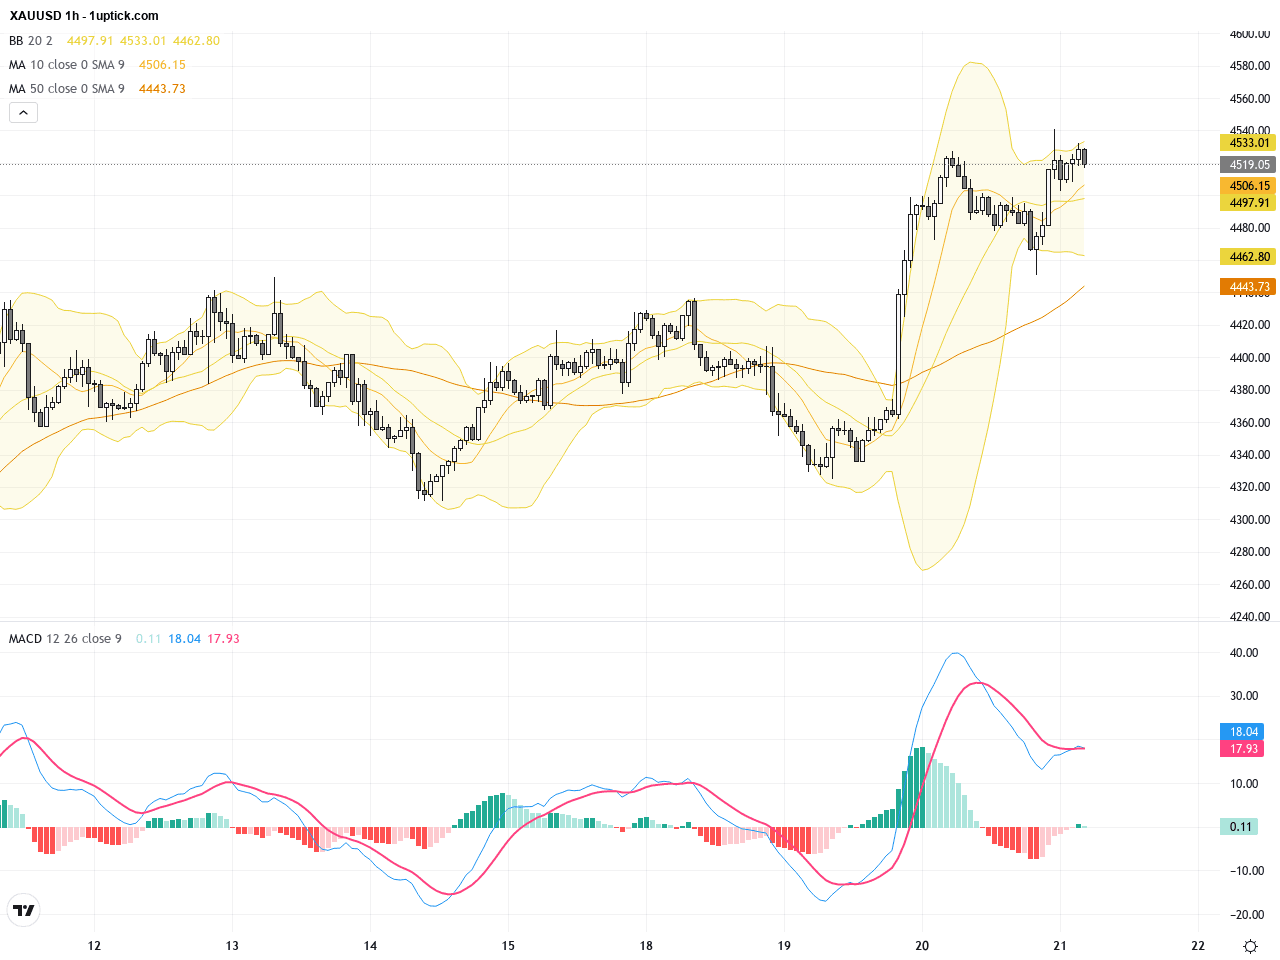
The hourly chart shows XAUUSD oscillating upward over the past 3 to 5 days, breaking recent resistance levels and holding above the Bollinger Bands’ midline. The MACD has generated a bullish crossover accompanied by a slight increase in volume, signaling strong short-term buying momentum. Recently formed bullish engulfing candlesticks suggest price could maintain upward momentum in the next 24 hours, though support levels must be watched to avoid a downside break.
Technical Trend: Decisively Bullish
Technically, XAUUSD remains decisively bullish with an ascending triangle pattern developing on the daily chart, increasing breakout prospects. The hourly MACD bullish crossover paired with bullish engulfing candles provides strong buy signals, indicating diminishing selling pressure and active buying interest. Volume is steady, supporting further price increases. Traders should monitor Bollinger Band support and the 200-day moving average to manage risk during possible corrections.Today’s economic calendar includes Japanese July trade balance, exports, and imports data, all beating expectations and likely supporting the JPY in the short term but with minimal direct effect on XAUUSD. Australian employment data shows job losses and a minor rise in unemployment, signaling economic strain and indirectly supporting gold as a safe haven. Key US economic data such as the Philadelphia Fed Index and weekly jobless claims will release in the afternoon (GMT+1). Stronger-than-expected US data could bolster the USD, pressuring gold prices downward, while weaker data would lift gold. No major direct economic event specifically targeting XAUUSD is scheduled today.
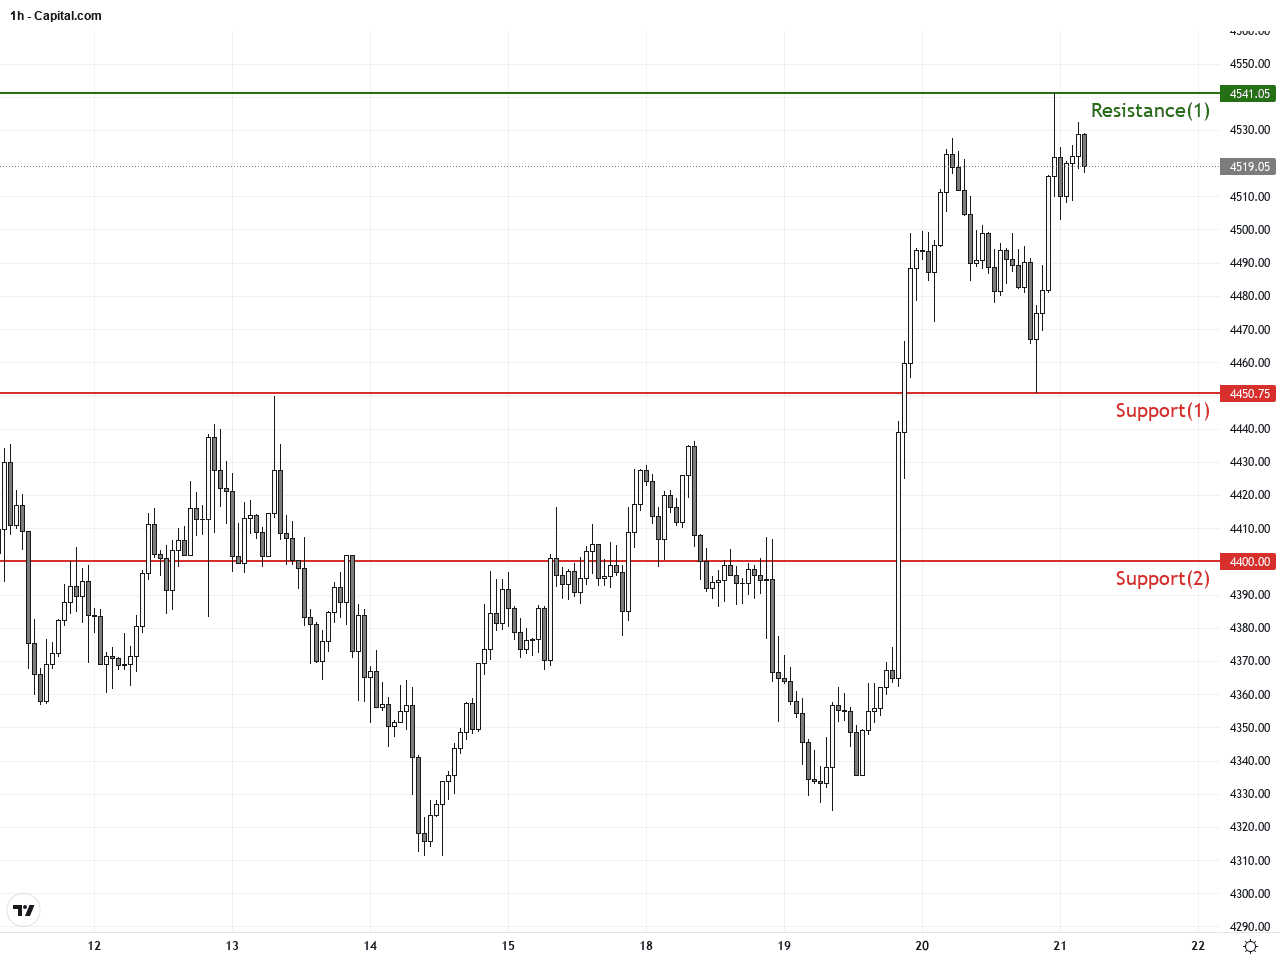
Resistance & Support
The above financial market data, quotes, charts, statistics, exchange rates, news, research, analysis, buy or sell ratings, financial education, and other information are for reference only. Before making any trades based on this information, you should consult independent professional advice to verify pricing data or obtain more detailed market information. 1uptick.com should not be regarded as soliciting any subscriber or visitor to execute any trade. You are solely responsible for all of your own trading decisions.