


 |
| Gold V.1.3.1 signal Telegram Channel (English) |
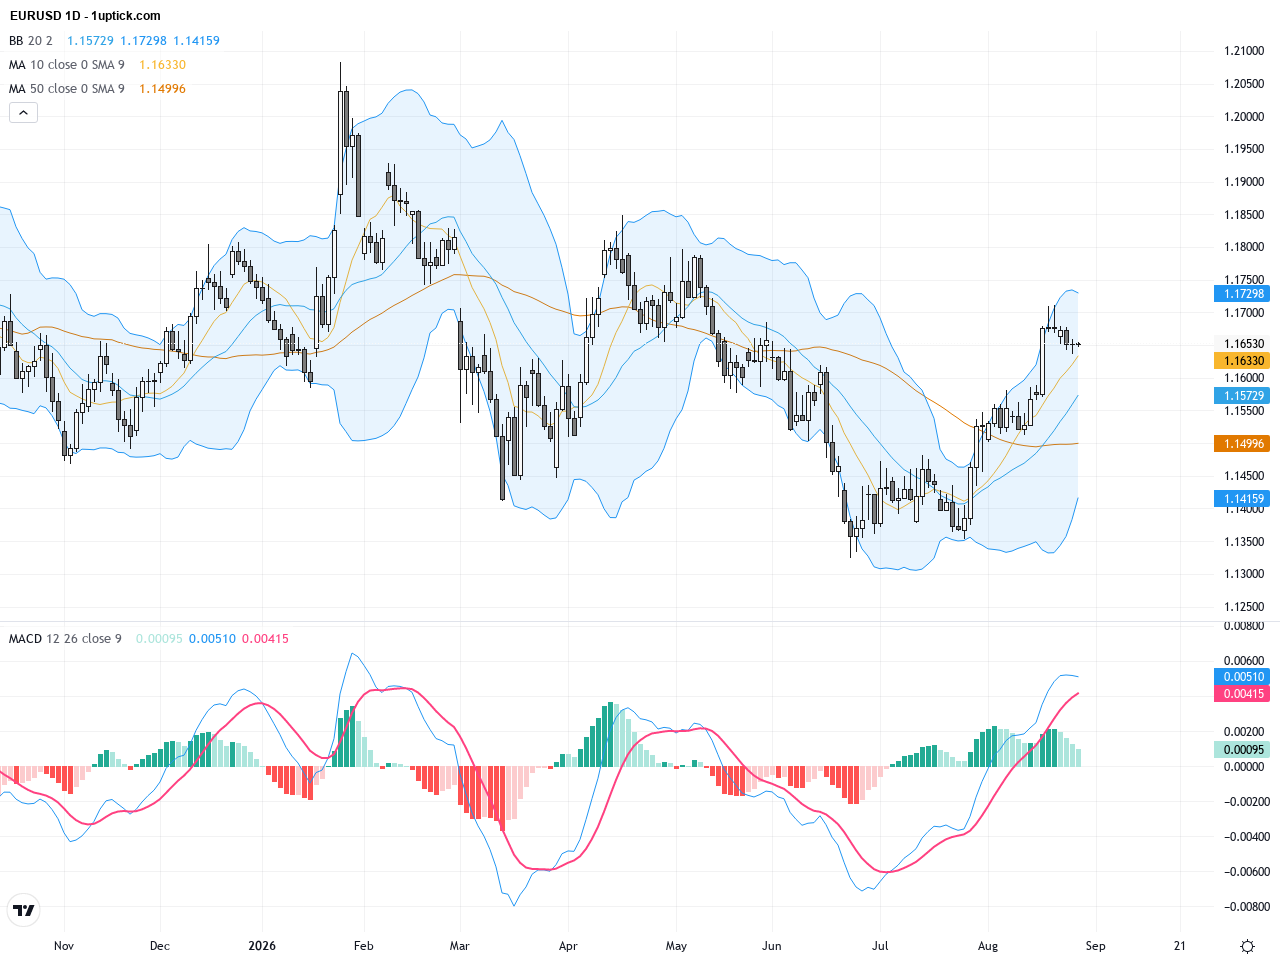
EURUSD: Key Support Holds at 1.1650, Technical Patterns Signal Rebound Potential, August 28, 2026
2026-08-28 @ 09:01
Over the past 24 to 48 hours, the EUR/USD has hovered near the 1.1650 level, closing slightly lower at 1.16531 yesterday. The persistent inflation data in the U.S. coupled with ongoing expectations of Fed rate hikes have continued to bolster the dollar, putting pressure on the euro.
Market focus remains on the upcoming Jackson Hole Symposium, with traders cautious as they await signals on the future direction of U.S. monetary policy. Europe lacks strong macroeconomic releases to support the euro, while Japan’s announcement of a 1.9% year-on-year increase in Tokyo CPI for August signals persistent inflationary pressures in the region. This indirectly affects the Asian dollar trend but has limited direct impact on the EUR/USD pair.
For the average investor, the euro is currently challenged by the strength of the dollar and the reality of ongoing inflation, implying the Fed may maintain its hawkish policy stance. This sets the stage for continued volatility in the forex market. Investors should watch for cues from Fed speakers at Jackson Hole, as their comments will be pivotal in shaping near-term moves of both the dollar and euro.
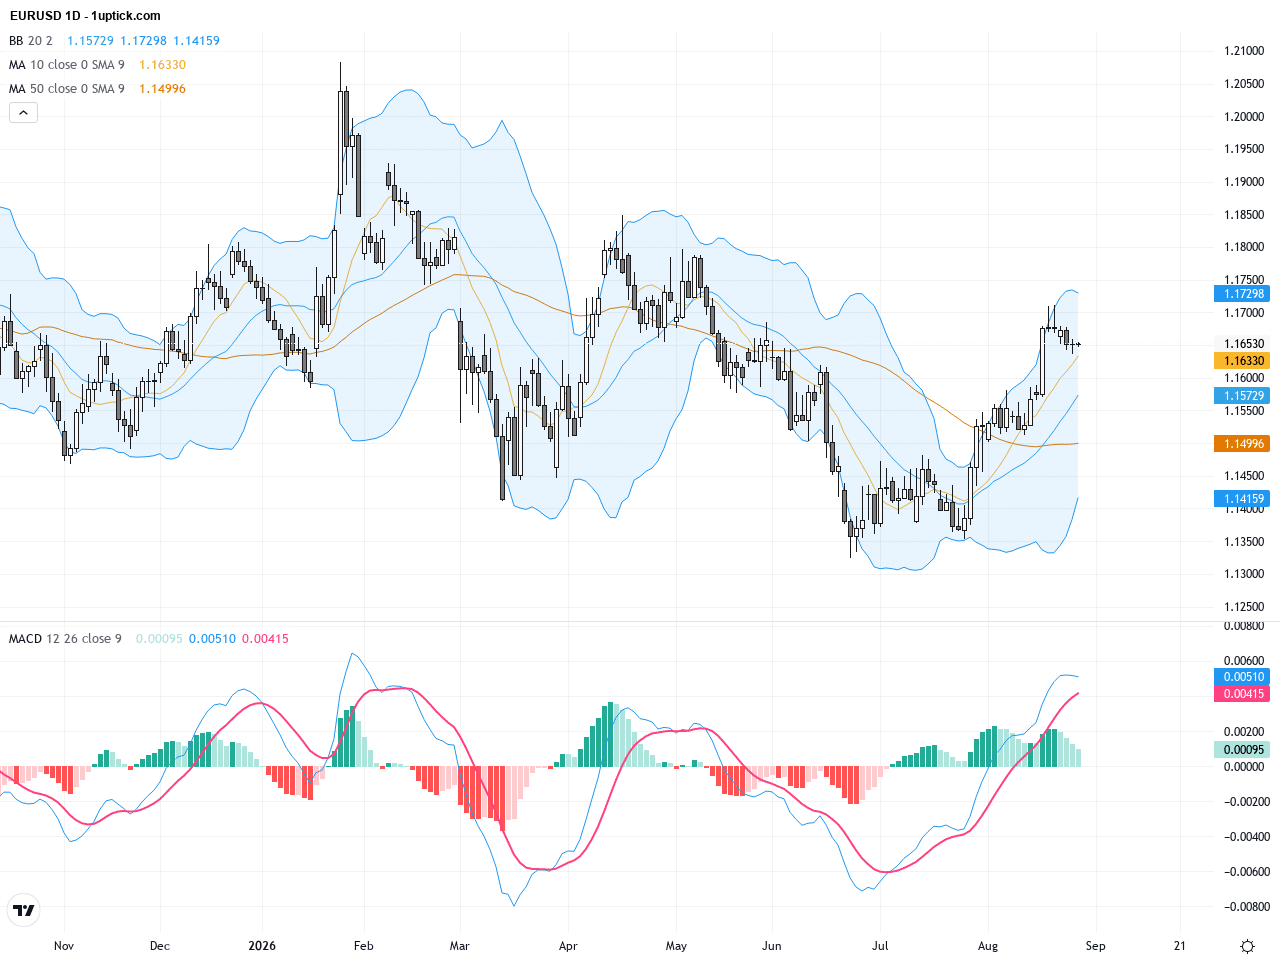
The daily chart shows EURUSD in a phase of downward pressure but consolidating near strong support at 1.1650. The Bollinger Bands are tightening, indicating reduced volatility and possible consolidation. The 200-day moving average around 1.16289 offers solid long-term support. MACD is slightly weakening but hasn’t formed a clear bearish crossover, suggesting that underlying bullish momentum for a rebound remains intact.
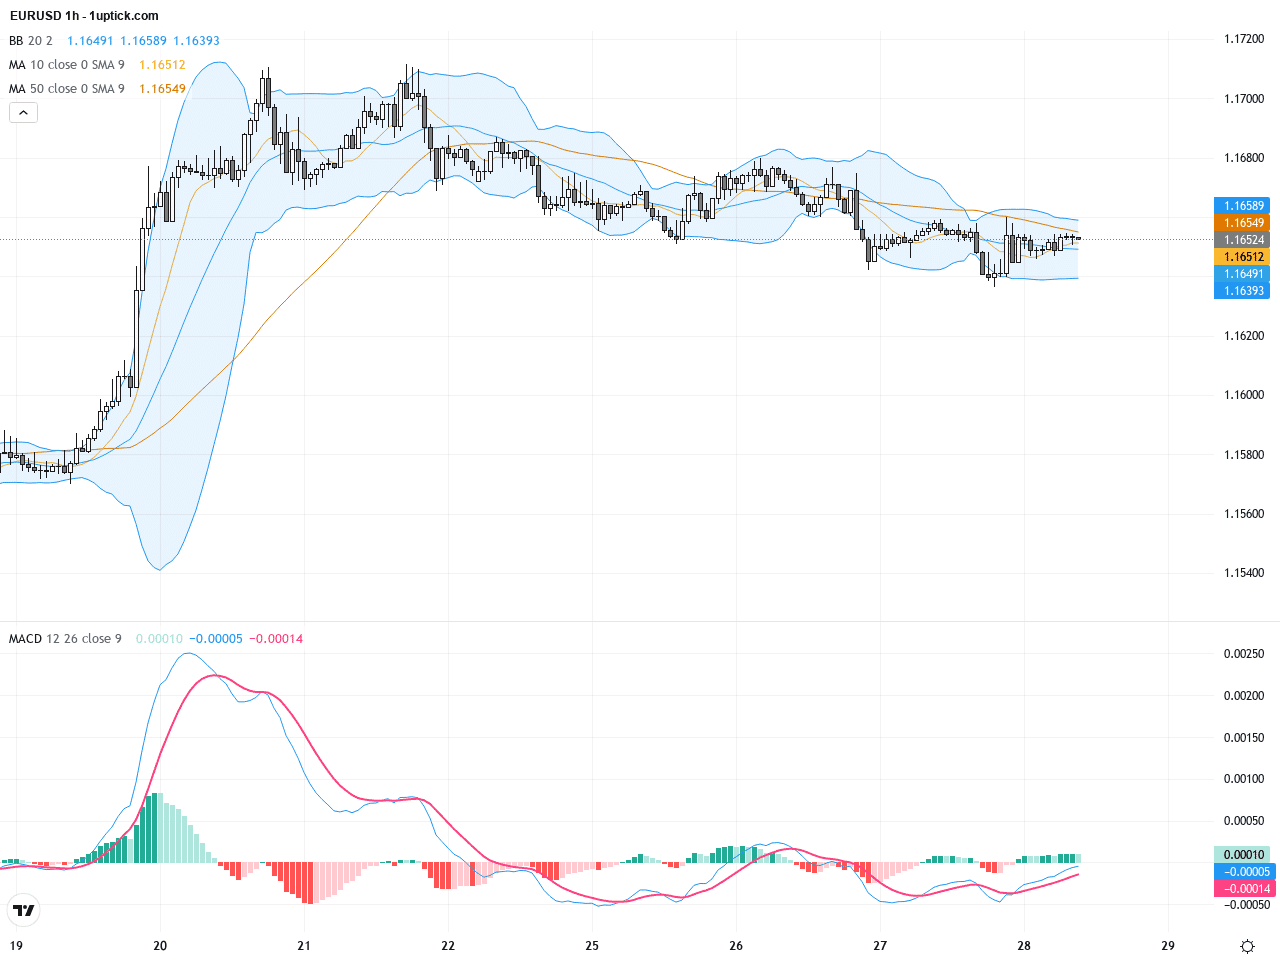
On the hourly chart, EURUSD has been range-bound between 1.1635 and 1.1660 over the last 3-5 days, signaling lack of strong momentum. Price averages hover between the 50 and 200-hour moving averages, which are currently mixed. MACD shows mild bullish divergence, hinting at a possible short-term reversal. Tight Bollinger Bands with prices near the lower band suggest the pair could stabilize and bounce in the near term. The short-term trend is sideways, awaiting a catalyst.
Technical Trend: Cautious Consolidation
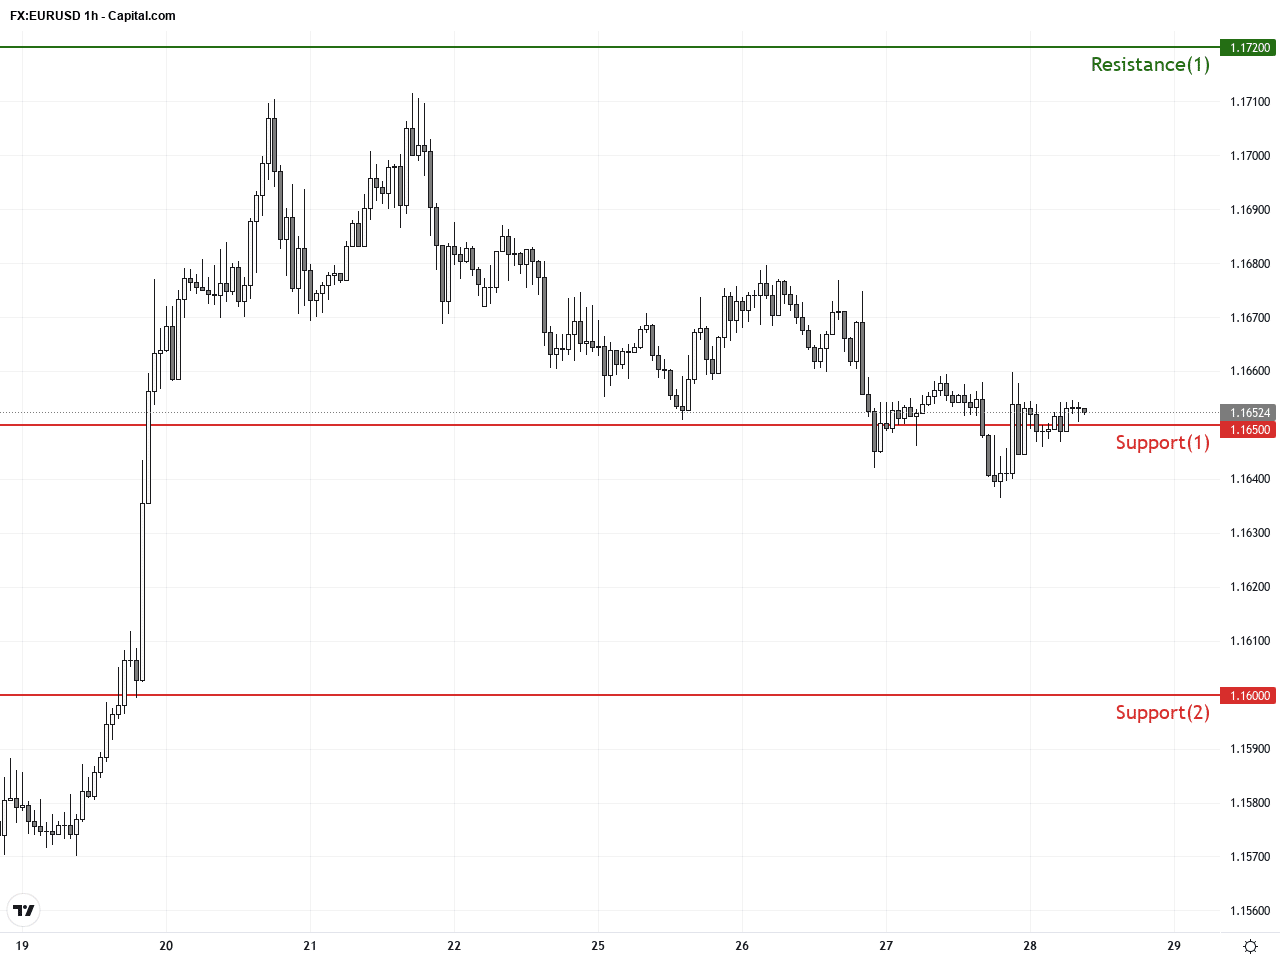
The technical focus remains on the critical 1.1650 support level, which is a key defense for short-term bulls. On the daily chart, a possible wedge pattern is forming that signals potential upside correction, supported by MACD and moving average alignment. The hourly chart’s bottom divergence and converging Bollinger Bands indicate building momentum for a rebound. However, persistent dollar strength and potential hawkish signals from the Jackson Hole meeting could limit upside. Traders should monitor if price holds above 1.1650; a breakdown below could lead to further declines toward 1.1600.Today’s primary event relevant to EURUSD is the Jackson Hole Symposium, which primarily influences market sentiment rather than releasing direct economic data. Japan’s Tokyo Core CPI and Unemployment Rate were reported earlier with minimal surprises, having limited immediate impact on EURUSD. Later in the day, several Eurozone data points including Germany’s import prices and EU economic sentiment are due; positive or better-than-expected outcomes could support the euro, while weaker results could reinforce USD strength. No direct immediate data will drastically move EURUSD today.
Resistance & Support
The above financial market data, quotes, charts, statistics, exchange rates, news, research, analysis, buy or sell ratings, financial education, and other information are for reference only. Before making any trades based on this information, you should consult independent professional advice to verify pricing data or obtain more detailed market information. 1uptick.com should not be regarded as soliciting any subscriber or visitor to execute any trade. You are solely responsible for all of your own trading decisions.