








 |
| Gold V.1.3.1 signal Telegram Channel (English) |
USDJPY Technical and Fundamental Analysis: Key Resistance Holds as Yen Weakness Persists, August 31, 2026
2026-08-31 @ 11:01
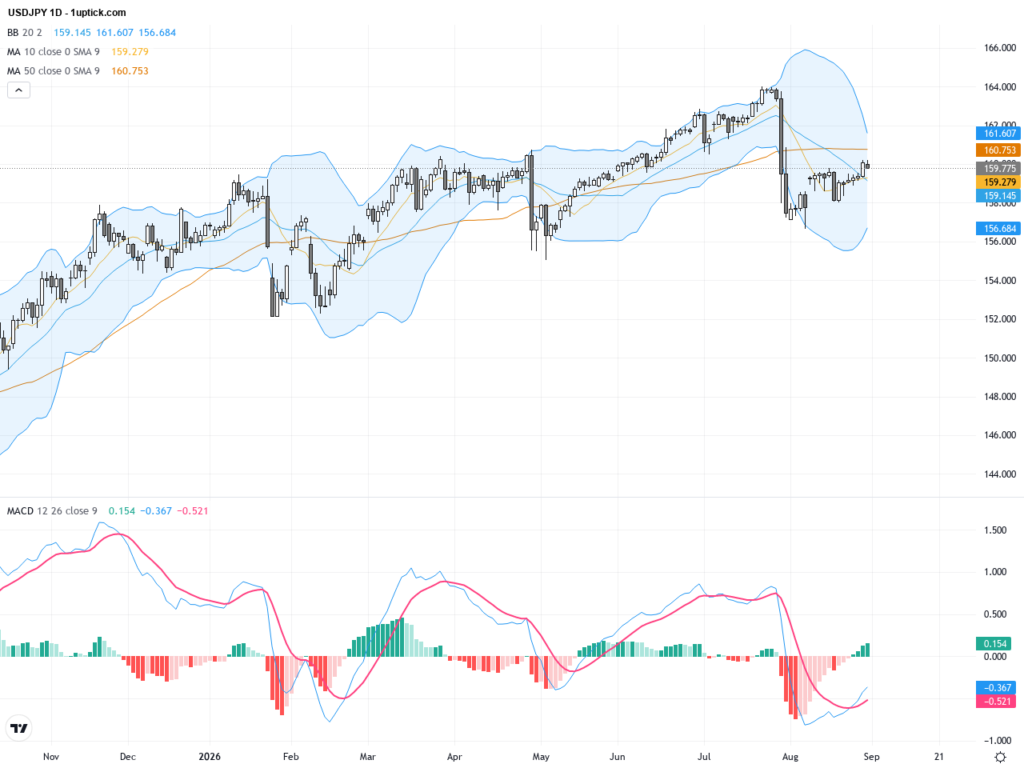
Over the past 48 hours, the USD/JPY pair has hovered around the psychologically significant 160 level during Asian sessions, closing yesterday at 159.77, down approximately 0.17% from the previous day. This movement highlights market sensitivity to the US-Japan interest rate differential, with the Japanese yen pressured near a one-month low amid sustained dollar strength.
Recent market news indicates that despite coordinated efforts by the US and Japan to support the yen, investors remain cautious about US monetary policy, especially with Fed Chair Warsh signaling possible further tightening to combat inflation. Additionally, geopolitical risks such as escalating tensions in Iran have prompted a reallocation of funds towards safe-haven currencies. Overall, the dollar’s continuing strength is backing the USD/JPY pair to test key resistance in the 159 to 160 range.
For the average investor, this scenario underscores a familiar theme: interest rate differentials mainly drive currency fluctuations, and any hawkish or dovish signals from major central banks directly influence price action. The widening US-Japan rate gap enhances the dollar’s appeal, weighing on the yen. Investors holding or trading USD/JPY should closely watch Fed policy signals and geopolitical developments, as these factors will continue to steer exchange rate movements.
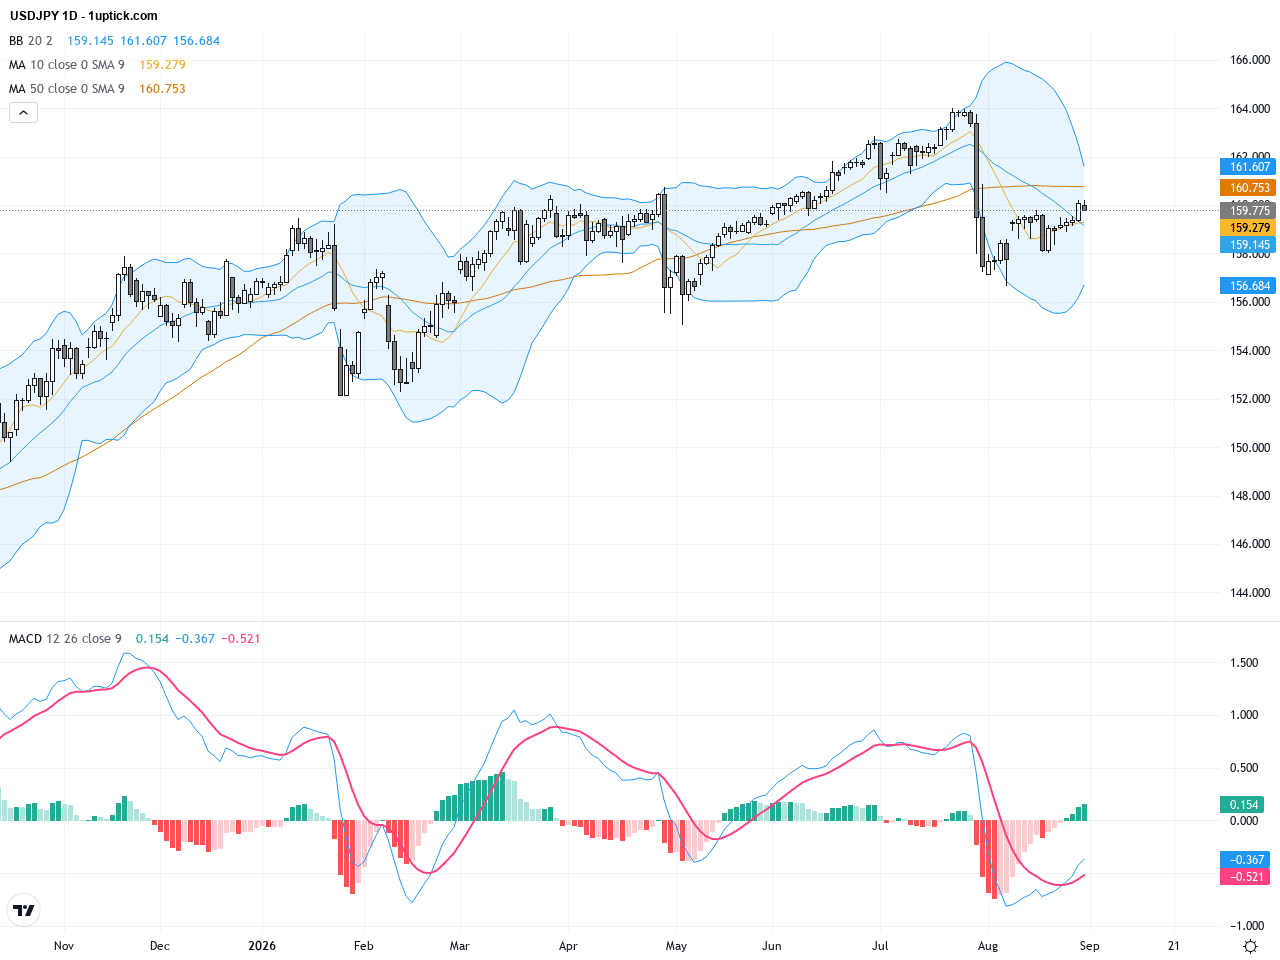
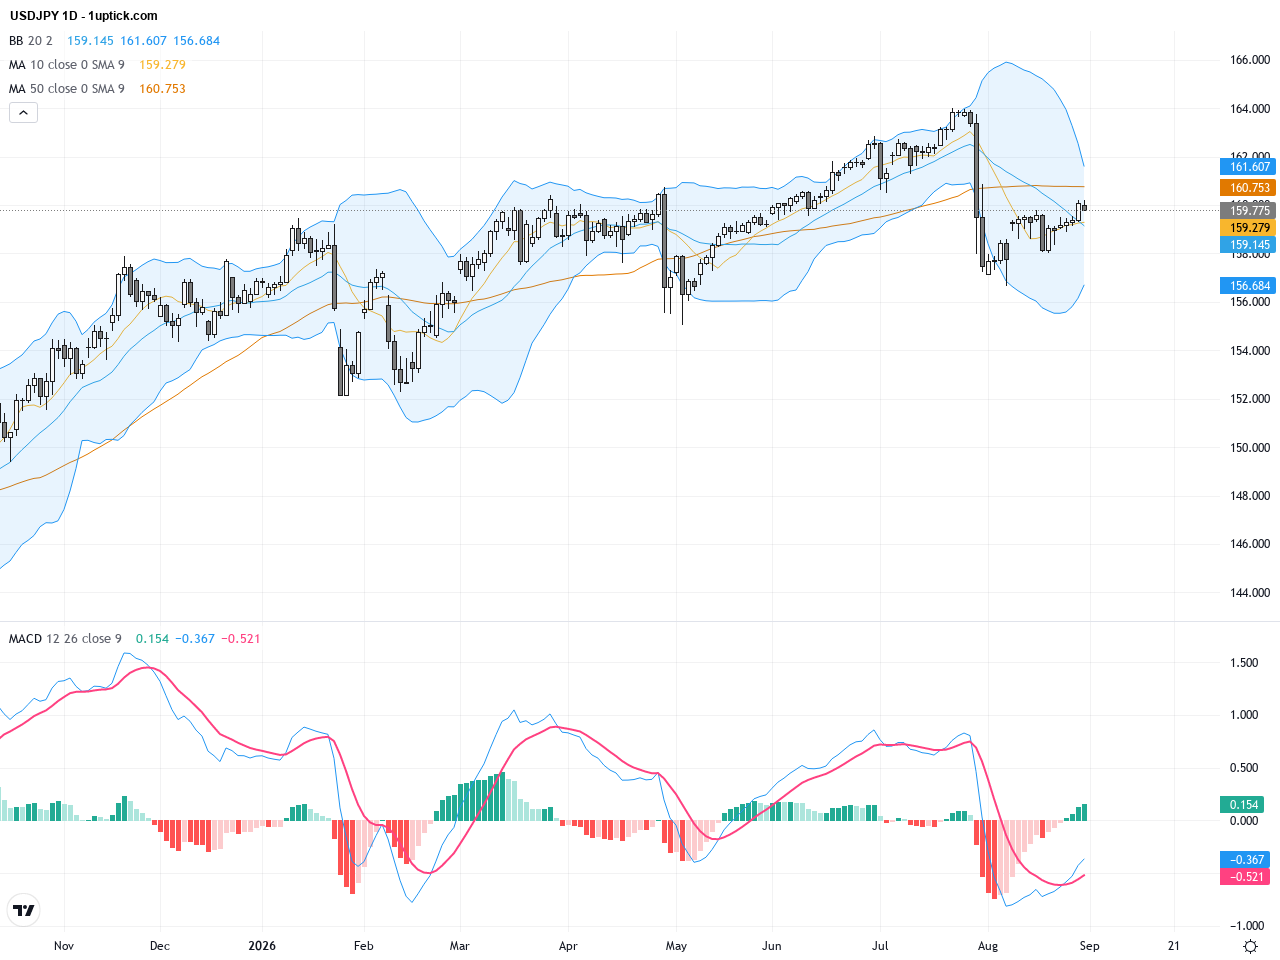
The daily chart shows USDJPY facing resistance near 160.00 after an upward move, with price maintaining above the 200-day moving average around 158.40, indicating solid longer-term support. The 50-day moving average at around 161 forms a significant resistance level. Bollinger Bands reveal price pressure near the upper band with a retracement underway. The MACD remains positive but is trending downwards toward the zero line, suggesting waning bullish momentum and a sideways consolidation phase with increased volatility near key resistance.
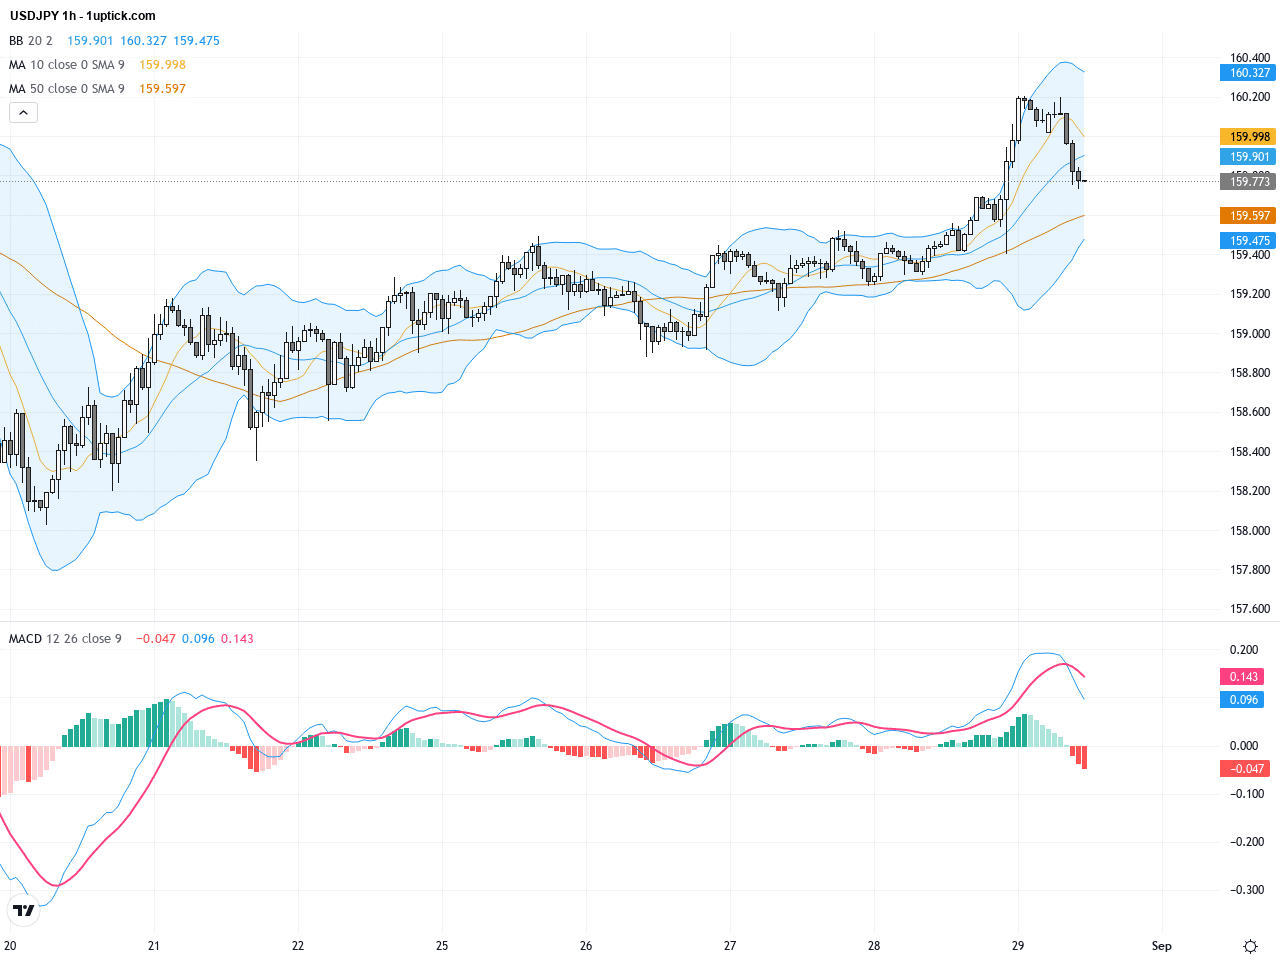
On the hourly chart, USDJPY has displayed a short-term consolidative pattern over the past 3-5 days, repeatedly testing resistance between 159.90 and 160.00 but failing to break through decisively, forming a minor symmetrical triangle. Short-term EMAs (20 and 50) are converging and crossing, reflecting uncertainty and heightened volatility. The MACD histogram shows increasing negative momentum, pointing to possible near-term downside if support levels break.
Technical Trend: Trend direction is cautiously sideways, with the pair consolidating under key resistance amid uncertainty about breakout direction.
Technically, USDJPY remains capped at a critical resistance area and is currently oscillating below 160.00. The recent daily candlestick formed an inverted hammer with a long upper wick, indicating buying pressure met strong selling resistance and suggesting potential short-term pullback. Momentum indicators such as MACD and Bollinger Bands signal weakening bullish strength and caution traders on reversal risk. Fundamentally, the US-Japan rate differential and geopolitical tensions are key drivers to track for sustained directional moves.Today’s economic calendar highlights Japanese July industrial production with a 0.1% m/m increase, beating expectations of -0.6%, and retail sales up 4% year-over-year versus a 3% forecast. These positives may provide temporary support for the yen. However, the broader macroeconomic interest rate gap and geopolitical concerns continue to weigh on USDJPY. Other global economic releases today are unlikely to directly impact USDJPY, keeping the focus on Japan’s figures.
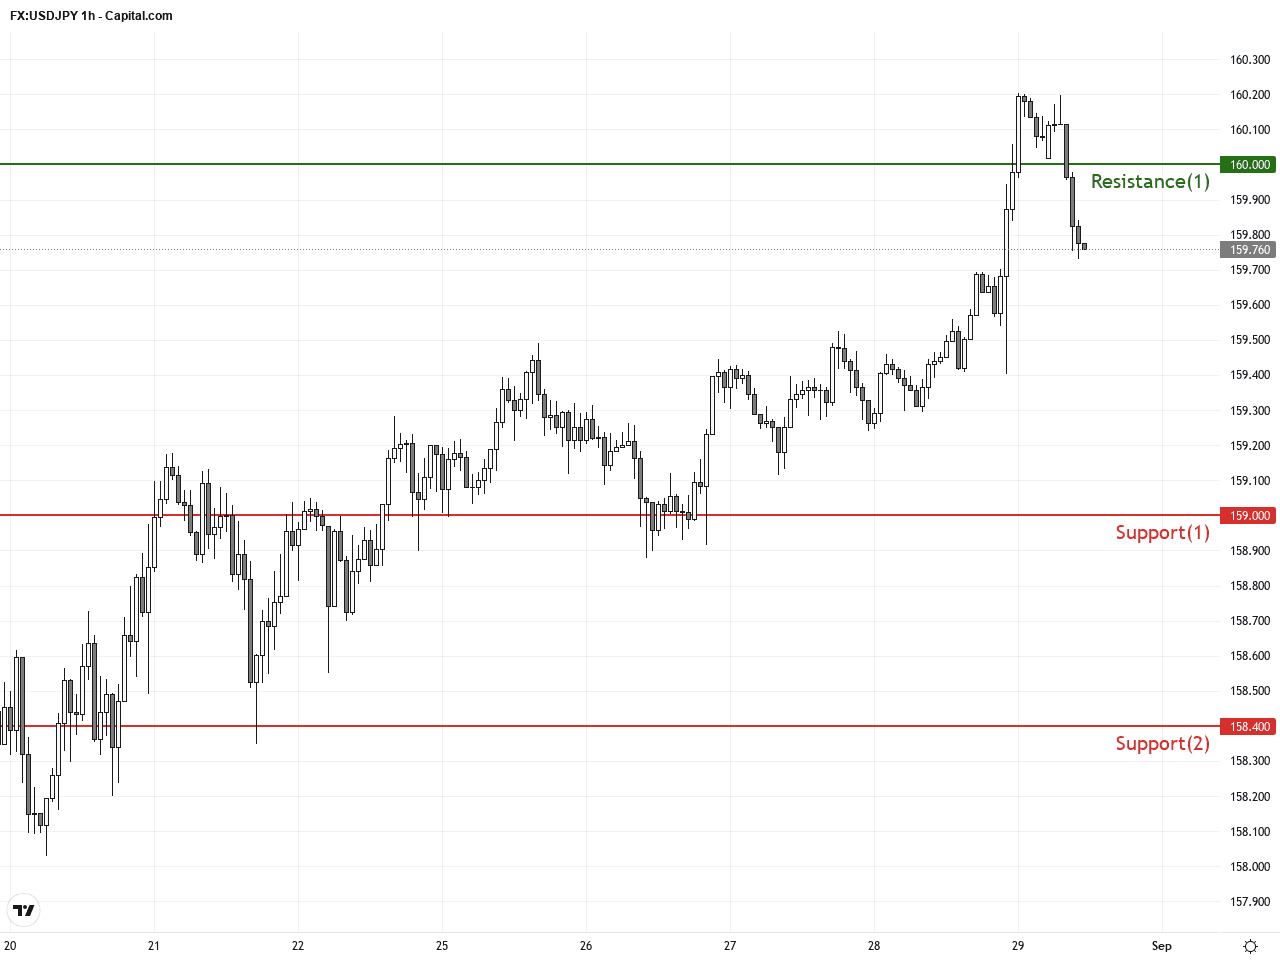
Resistance & Support
The above financial market data, quotes, charts, statistics, exchange rates, news, research, analysis, buy or sell ratings, financial education, and other information are for reference only. Before making any trades based on this information, you should consult independent professional advice to verify pricing data or obtain more detailed market information. 1uptick.com should not be regarded as soliciting any subscriber or visitor to execute any trade. You are solely responsible for all of your own trading decisions.