







 |
| Gold V.1.3.1 signal Telegram Channel (English) |
GBPUSD Nears Critical 1.3500 Support as Bearish Pressure Mounts – Trading Outlook & Technical Analysis, September 2, 2026
2026-09-02 @ 13:01
Over the past 24 to 48 hours, the GBP/USD exchange rate has remained under pressure, dropping close to the 1.3500 level, showing slight fluctuations from yesterday’s closing price of 1.34967 but overall trending downwards. This is mainly driven by escalating tensions in the Middle East, particularly between the US and Iran, which has heightened market risk aversion and strengthened the US dollar, further pressuring the British pound.
According to the latest market news, military clashes in the US-Iran region intensified during early European trading hours, putting the pound under sell-off pressure. Investors’ concerns over geopolitical uncertainty have led to a flight to safety toward the US dollar, which also benefits from expectations of a hawkish Federal Reserve stance. Market focus remains on upcoming US job data releases such as JOLTS and NFP, adding to the downward pressure on GBP/USD.
For the average investor, this market movement acts as a risk warning signal, illustrating how geopolitical unrest can cause significant currency volatility. Keeping a close eye on global events and Fed policy direction is essential to understanding and anticipating GBP/USD trends.
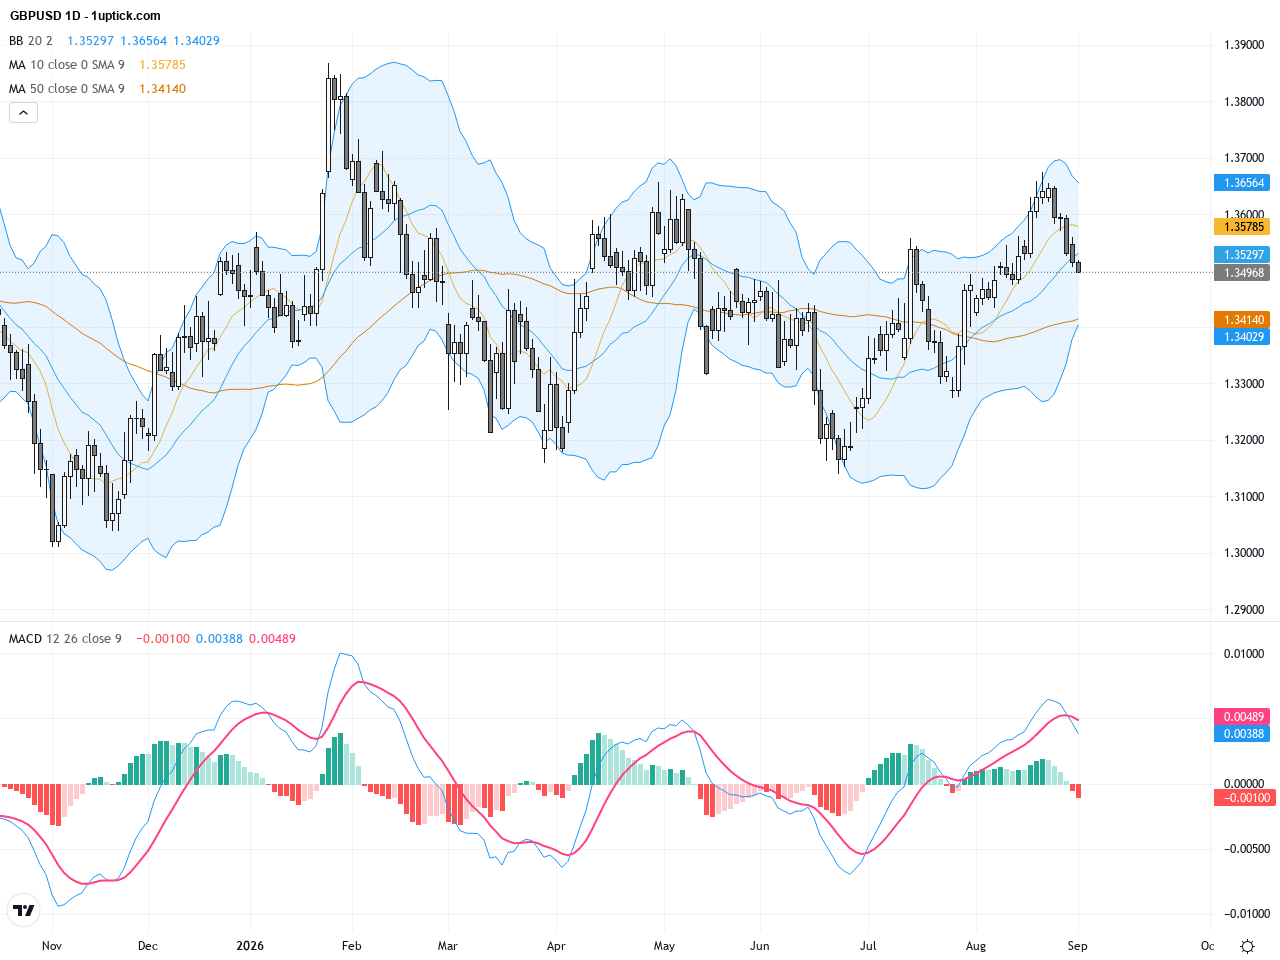
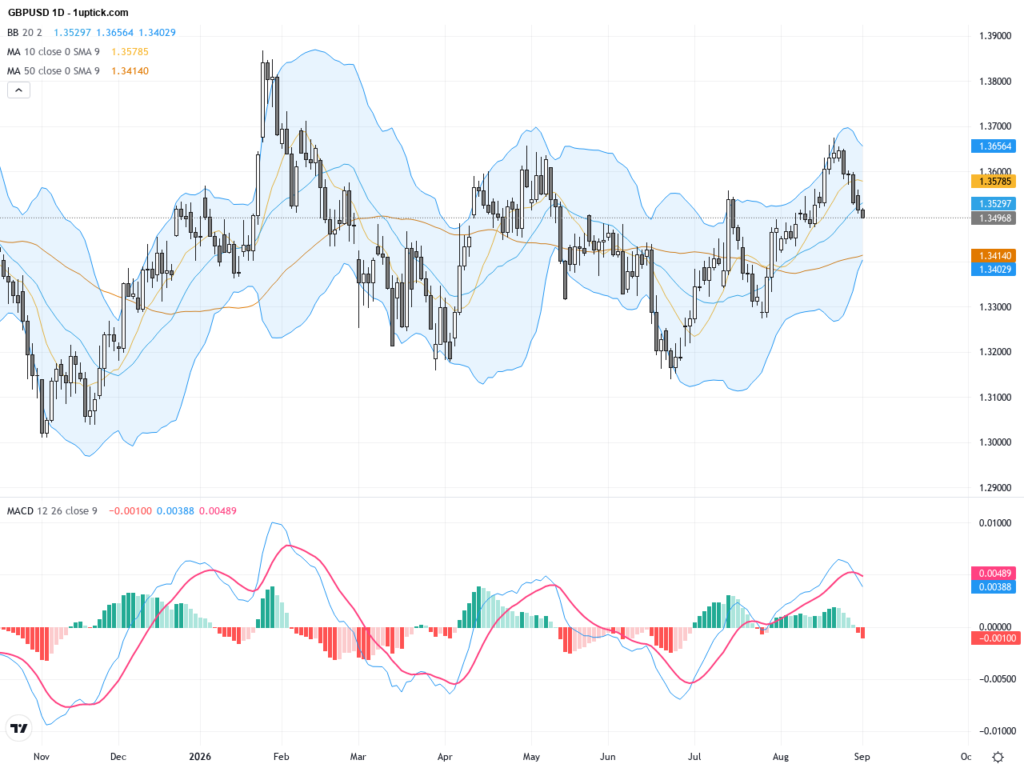
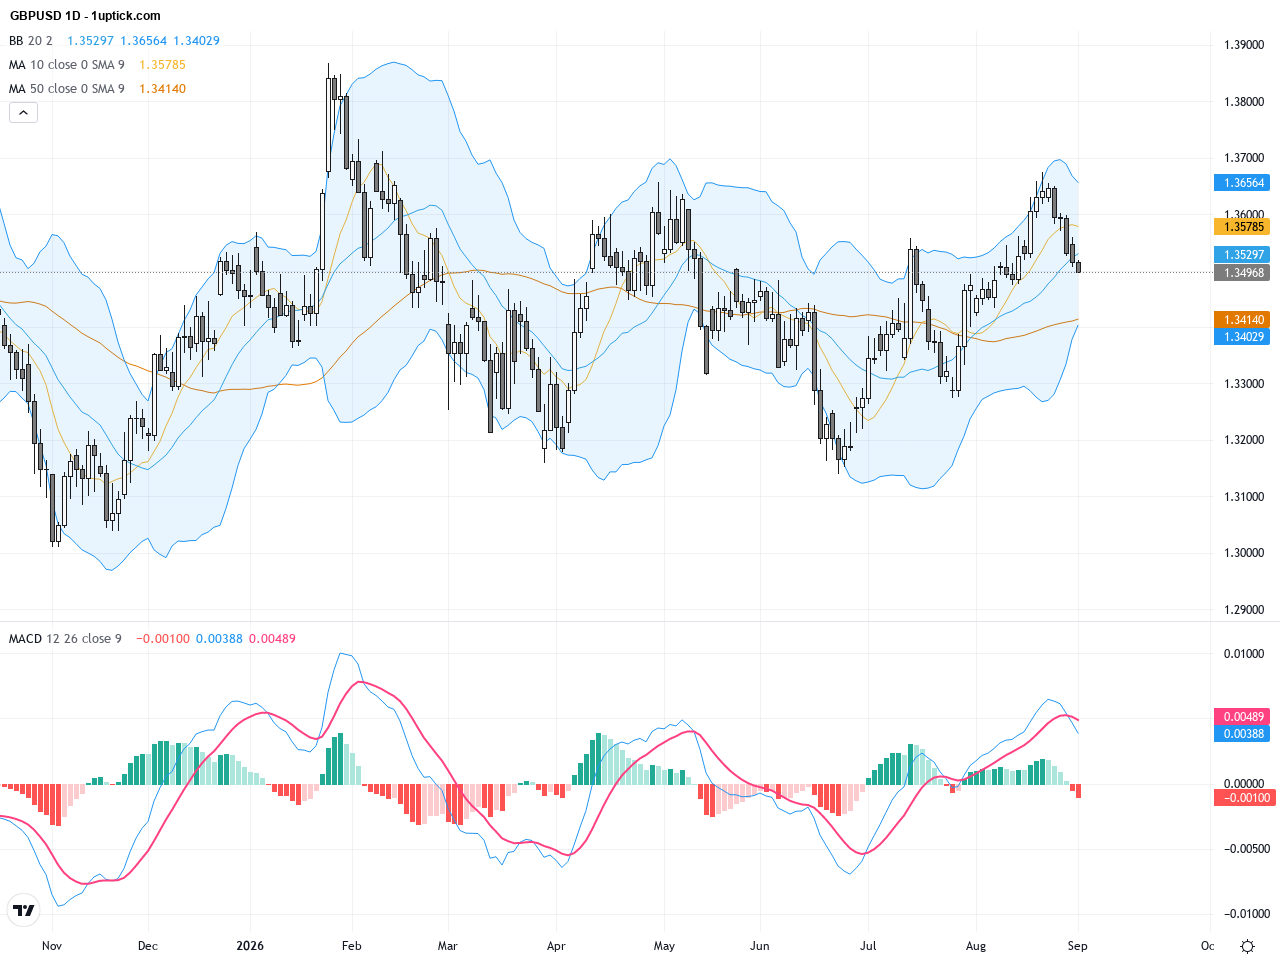
The daily chart reveals a clear downtrend in GBPUSD over the recent period, with prices retreating from an early-month high near 1.3650 and breaking below both the 50-day and 200-day moving averages around 1.35. This confirms a bearish medium-term momentum. Bollinger Bands are narrowing, suggesting contraction but with a downward bias. MACD remains negative and trending lower, reinforcing selling pressure. The chart forms a descending channel, and a break beneath the 1.3490 support level would likely extend the downtrend.
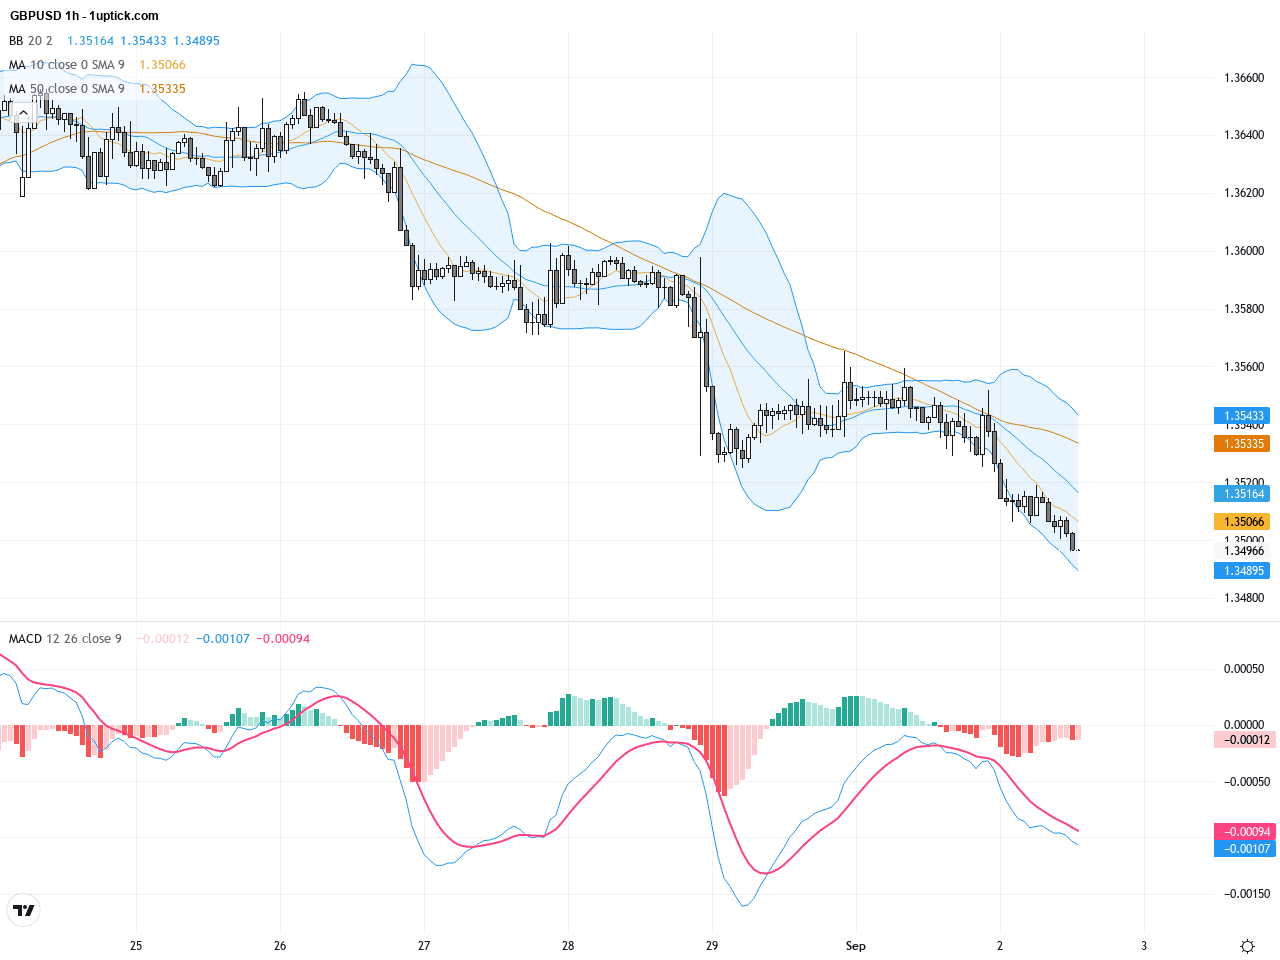
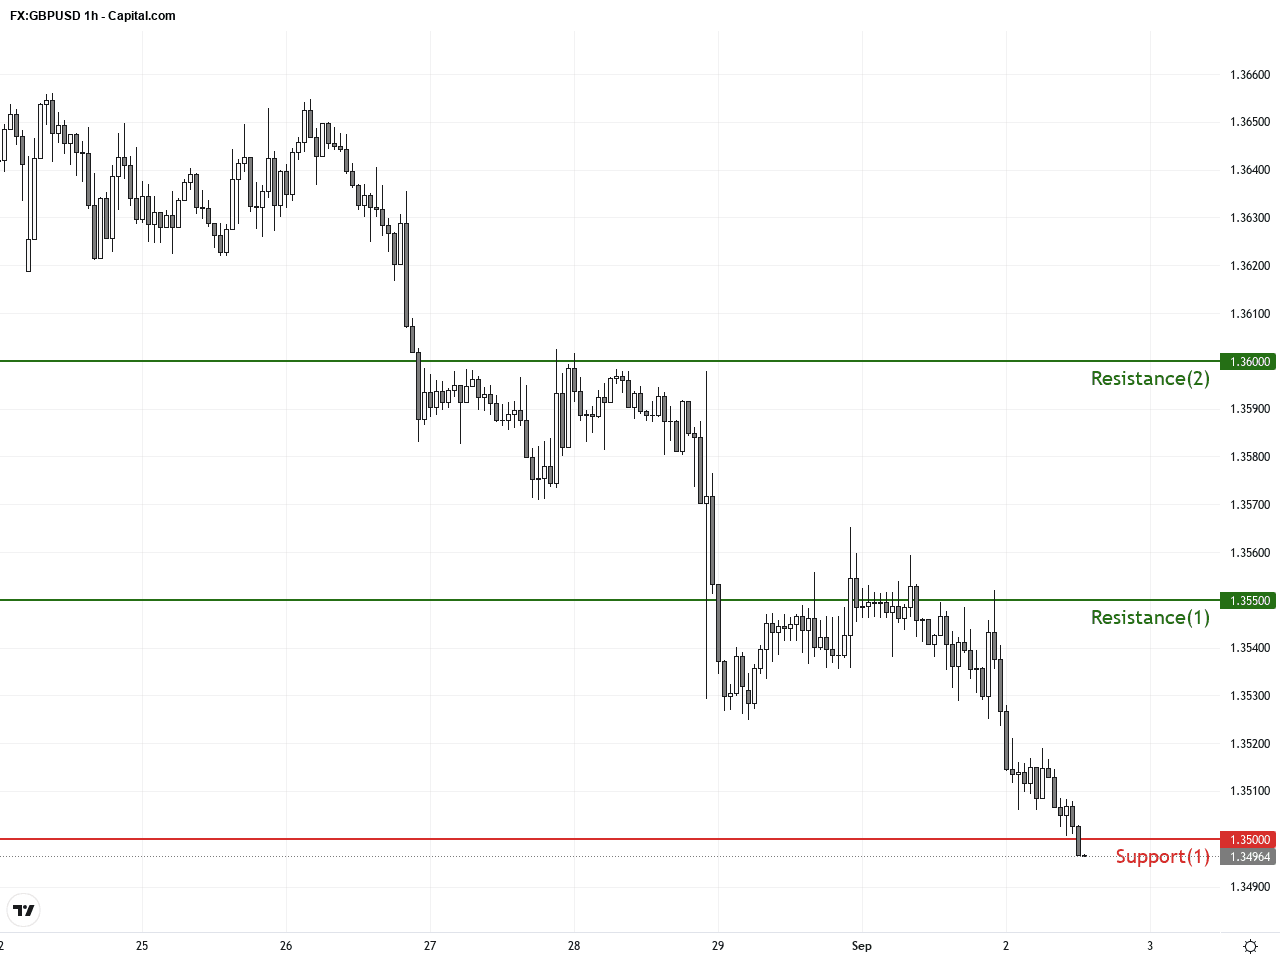
On the hourly chart, GBPUSD has shown choppy downside momentum over the last 3-5 days, fluctuating between 1.3500 and 1.3550. Shorter EMA resists near 1.351, while Bollinger Bands tighten around the midline. The MACD shows a bearish crossover, and RSI hovers below 40, indicating weakening momentum. Recent candlesticks include a bearish engulfing pattern, signaling further downside risk in the next 24 hours.
Technical Trend: Cautiously Bearish
Technical signals from GBPUSD suggest continued bearish momentum. The MACD is trending down with a confirmed bearish crossover, and daily Bollinger Bands expanding downward reinforce the selloff. The formation of a bearish engulfing candlestick signals immediate downside risk within the next 24 hours. While RSI shows some oversold conditions hinting at a potential short-term bounce, the broader trend remains bearish, emphasizing caution.No significant or directly relevant economic events tied to GBPUSD are scheduled today in the GMT+1 calendar. While speeches from Germany’s Bundesbank and GDP data from Australia and New Zealand are on the docket, their immediate impact on GBPUSD is limited. Traders should keep an eye on the US ADP employment report and durable goods orders released later, as stronger-than-expected data could bolster the dollar and pressure GBPUSD lower.
Resistance & Support
The above financial market data, quotes, charts, statistics, exchange rates, news, research, analysis, buy or sell ratings, financial education, and other information are for reference only. Before making any trades based on this information, you should consult independent professional advice to verify pricing data or obtain more detailed market information. 1uptick.com should not be regarded as soliciting any subscriber or visitor to execute any trade. You are solely responsible for all of your own trading decisions.