









 |
| Gold V.1.3.1 signal Telegram Channel (English) |

AUDUSD: Copper Prices Near Record, Momentum Weakens – Technical & Fundamental Analysis, September 11, 2026
2026-09-11 @ 06:01
Over the past 24 to 48 hours, the Australian Dollar against the US Dollar (AUD/USD) has shown a clear downward trend. The closing price yesterday was 0.71549, down approximately 0.86% from the previous day’s 0.72171. This decline reflects a recent softening in market risk appetite, coinciding with copper prices nearing record highs, which presents a complex dual impact on the resource-linked Australian dollar.
Another key factor came from European markets, particularly the DAX 40 index slipping through critical support levels and continuing its fall, which heightened risk aversion globally and indirectly undermined AUD momentum. Meanwhile, despite robust Australian Q2 GDP data, investor confidence in the AUD has weakened due to uncertainties surrounding Federal Reserve (Fed) and Reserve Bank of Australia (RBA) rate hike expectations.
In essence, AUD has been influenced by multiple factors during this period: copper price surging near all-time highs indicates strong resource market activity, but simultaneously, rising global risk aversion and increased financial market volatility are weighing on the currency’s rally. For the average investor, this serves as a reminder that even solid fundamental economic data can be overshadowed by external market disturbances and shifts in risk sentiment, highlighting the importance of closely monitoring global macro conditions and market mood when investing in AUD-related assets.

The daily chart shows AUDUSD in a clear consolidation phase, oscillating between 0.705 and 0.725, reflecting a cautious market stance. Moving averages remain in a bullish sequence but recent price pullbacks toward the 50-day moving average (around 0.705) and tightening Bollinger Bands suggest declining volatility and a potential upcoming breakout. The MACD hovers near the zero line, demonstrating weak momentum and no definitive trend reversal signal. Overall, the daily trend supports mild upside potential but traders should watch key support levels carefully.
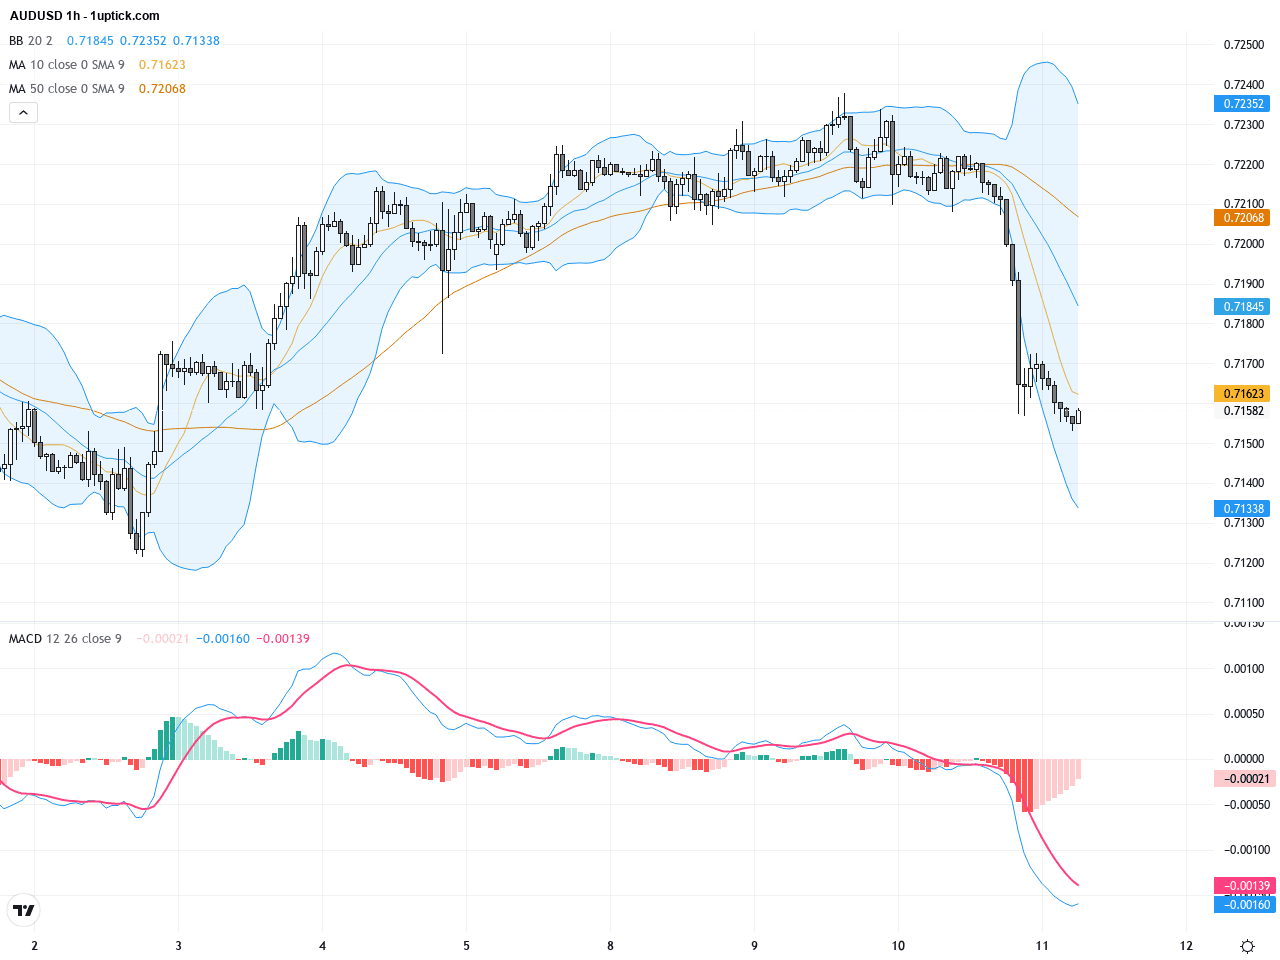
On the 3-5 day hourly chart, AUDUSD exhibits a short-term downtrend from near 0.723, recently testing the 0.715 support zone. The 200-period moving average acts as resistance, while a bearish crossover of short-term moving averages and an MACD line crossing below the signal line highlight increasing selling pressure. Expansion of the lower Bollinger Band points to heightened short-term volatility. The recent inverted hammer candlestick suggests a weakening of bearish momentum, hinting at a possible bounce within the next 24 hours, contingent on rising volume confirmation.
Technical Trend: Cautiously Consolidating
From a technical perspective, the MACD bearish crossover combined with short-term moving average resistance signals waning momentum in the near term. The narrowing Bollinger Bands indicate a volatility squeeze that may precede a directional breakout. The inverted hammer candlestick suggests potential short-term bullish reversal if supported by volume increases. The daily trend maintains a neutral to mildly bullish bias but a decisive break below 0.705 could trigger a deeper correction. Traders should be mindful of sudden shifts in risk appetite that could drive rapid price changes.Today’s GMT+1 economic calendar lists several important updates such as US CPI and UK GDP releases; however, none have direct immediate impact on AUDUSD. Chinese new loans and M2 money supply data, scheduled later, may influence risk sentiment which could indirectly affect AUDUSD. Overall, no significant direct economic event today is likely to cause sharp moves in AUDUSD, making external macro developments and risk mood key factors for traders to watch.
Resistance & Support

The above financial market data, quotes, charts, statistics, exchange rates, news, research, analysis, buy or sell ratings, financial education, and other information are for reference only. Before making any trades based on this information, you should consult independent professional advice to verify pricing data or obtain more detailed market information. 1uptick.com should not be regarded as soliciting any subscriber or visitor to execute any trade. You are solely responsible for all of your own trading decisions.