

 |
| Gold V.1.3.1 signal Telegram Channel (English) |
EURUSD: Technical Consolidation Near Key Resistance Amid ECB and Fed Uncertainties, September 14, 2026
2026-09-14 @ 09:01
Over the past 24 to 48 hours, the EUR/USD currency pair has remained near the 1.1600 level, showing relatively limited movement compared to yesterday’s close of 1.1587. Market sentiment reveals a degree of uncertainty as the recent ECB interest rate hikes collide with the Fed’s hawkish stance on tightening, creating a tug-of-war effect. According to the latest market news, the euro-dollar exchange rate is at a critical juncture, reflecting investors’ wait for clearer signals on monetary policy direction.
The article titled “EUR/USD Weekly Forecast: To hike or not to hike? Kevin Warsh between a rock and a hard place” highlights that EUR/USD has been consolidating around 1.1600 without a decisive trend, which mirrors uncertainty regarding the ECB’s next rate move. Meanwhile, “Euro To Dollar Forecast: EUR/USD Recovers After PPI And ECB Hike” reveals that the euro recovered slightly following the release of the US Producer Price Index and ECB’s recent rate hike, with strong expectations for further ECB increases in December and March. Some banks even foresee the pair testing resistance near 1.1700.
For the average investor, this means the EUR/USD exchange rate is currently supported by ECB’s rate hike action but pressured by the Fed’s hawkish policy outlook. It’s like a tug-of-war between two forces, resulting in short-term stability but potential for directional shifts as further rate hikes are anticipated around year-end and into next spring. Awareness of this dynamic helps investors better manage risk and identify potential trading opportunities in the near term.
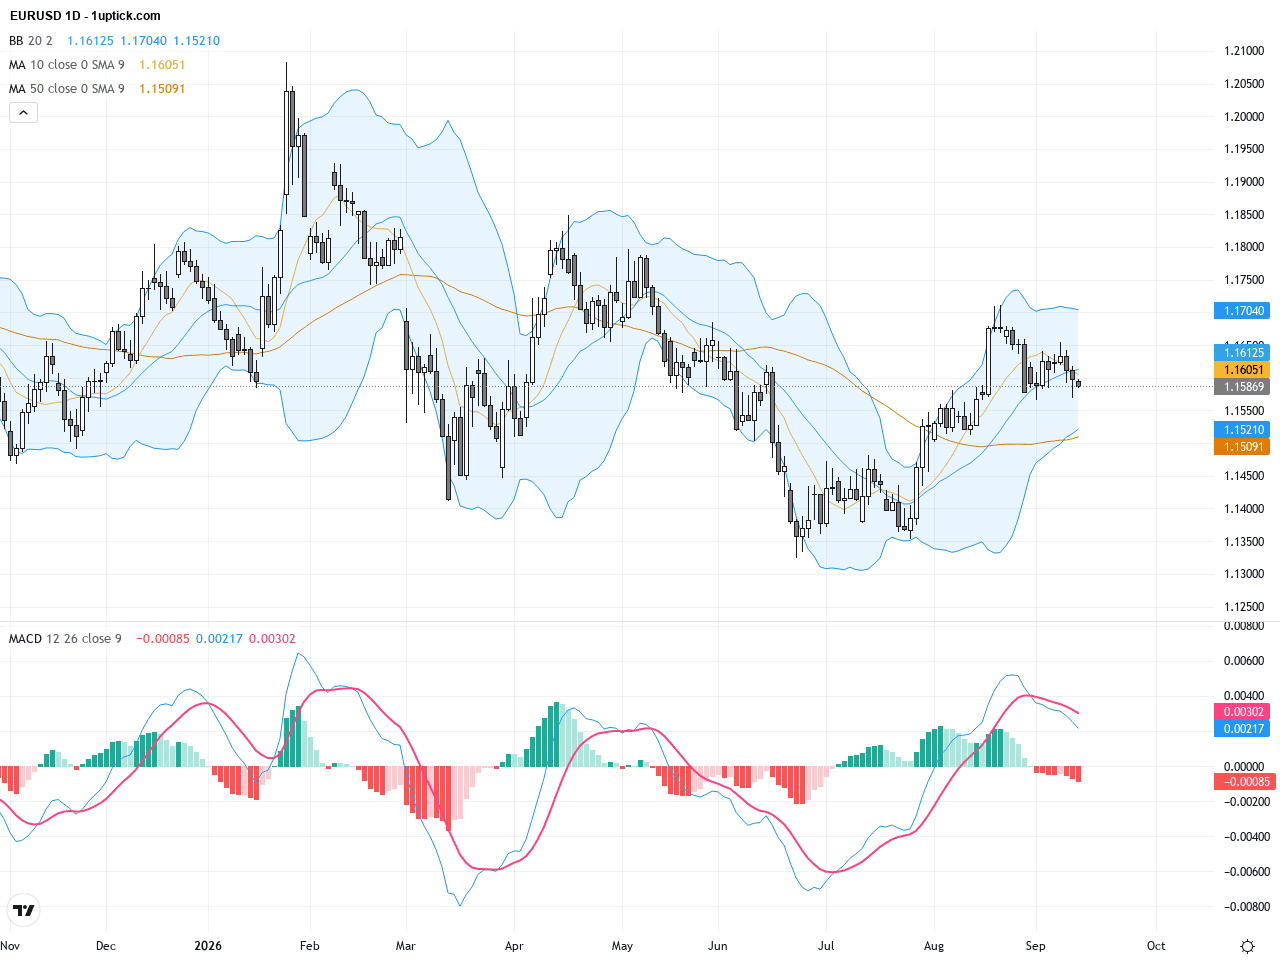
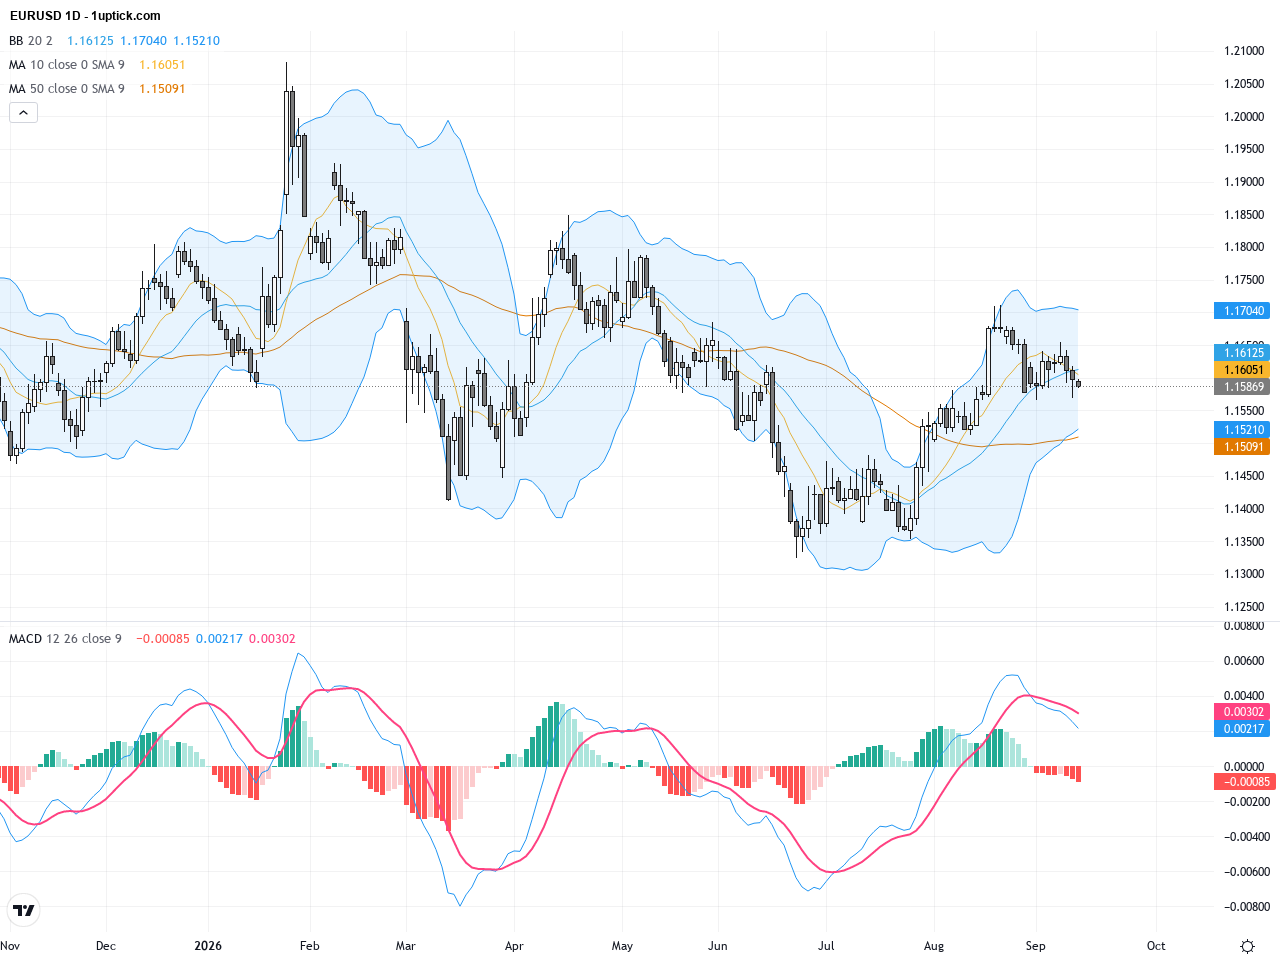
The daily chart shows EURUSD in a consolidating uptrend over the last three months, trading above the 50-day moving average (~1.1527) but facing significant resistance near the 200-day moving average (~1.1632). Bollinger Bands indicate contraction around the middle band, suggesting decreased volatility. The MACD histogram remains positive but is waning, pointing to slowing upward momentum and a likely range-bound phase.
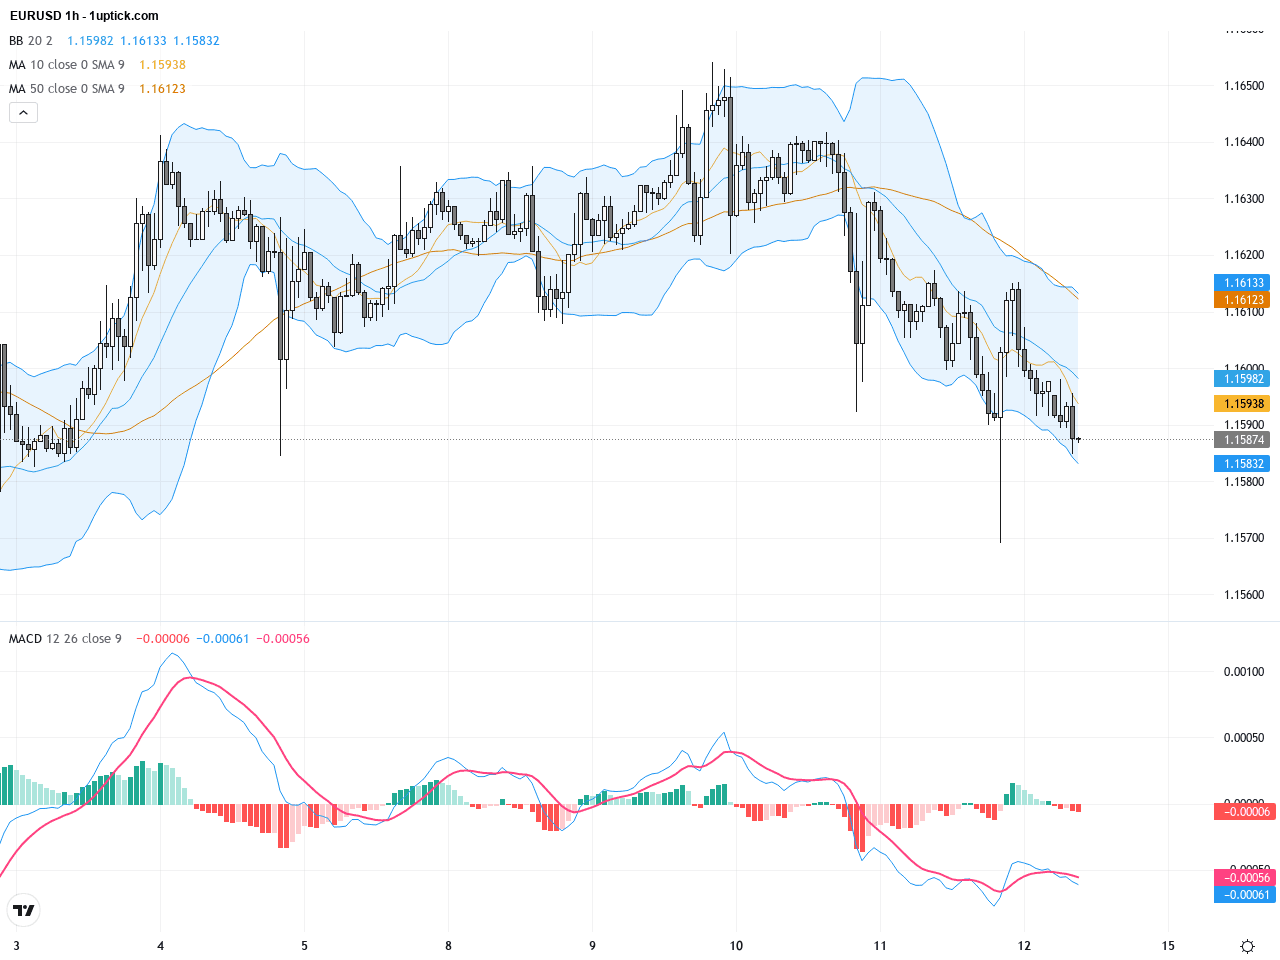
The hourly chart over the past five days reveals EURUSD oscillating between 1.1580 and 1.1605, with the 20-period MA approaching a bullish crossover over the 50-period MA. Bollinger Bands are widening, signaling an imminent increase in volatility. The MACD is ascending near the zero line, enhancing short-term bullish momentum. A recent bullish engulfing candlestick suggests a potential breakout in the next 24 hours.
Technical Trend: Cautiously consolidating sideways trend
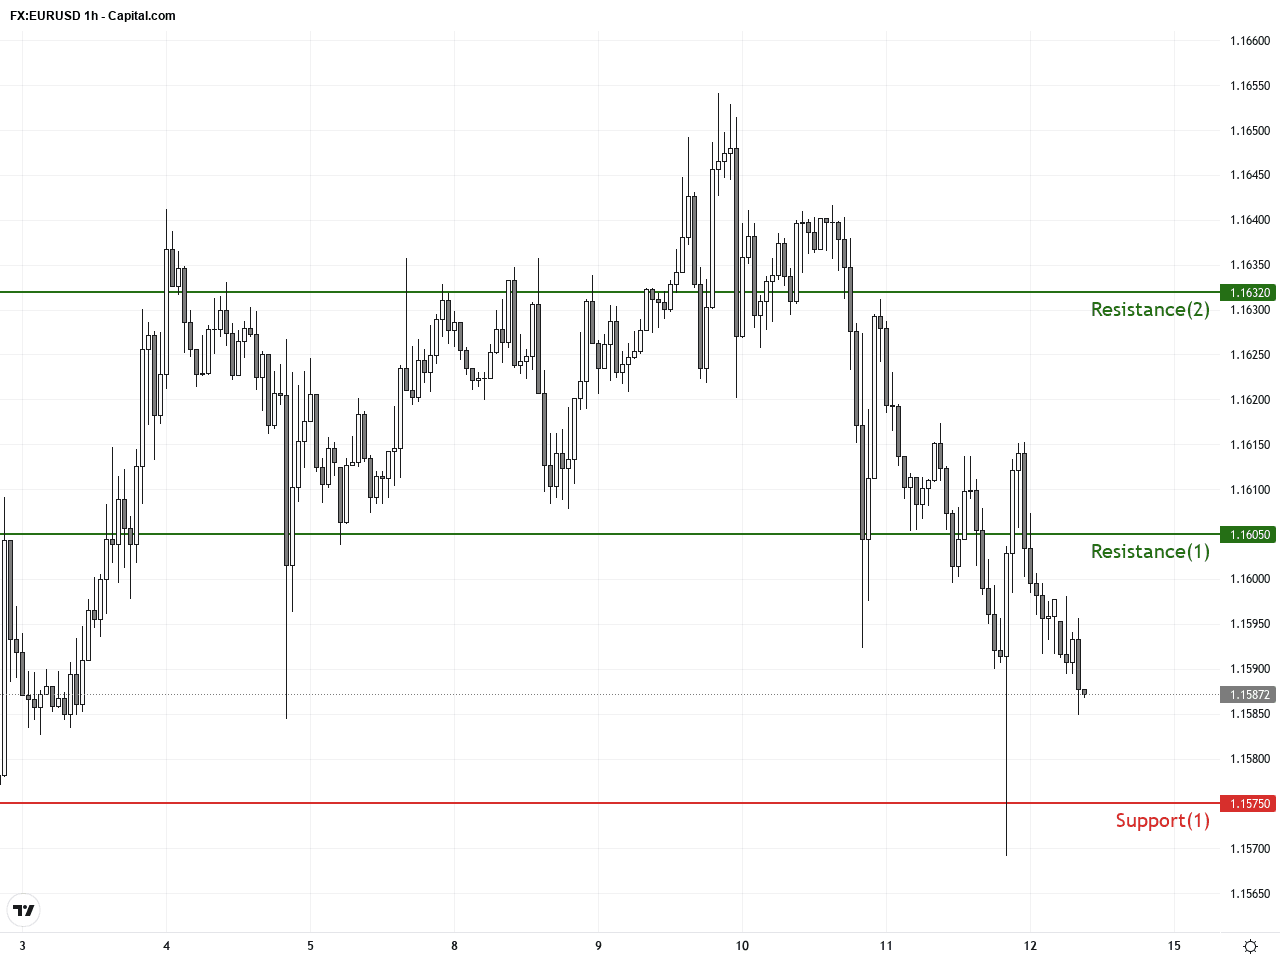
Technically, EURUSD stands near key resistance at 1.16, with the recent bullish engulfing candlestick indicating a short-term push higher. However, daily MACD and Bollinger Bands suggest a cautious approach amid consolidative conditions. Fundamentally, the ECB’s anticipated rate hikes versus the Fed’s hawkish tone create mixed pressures. Short-term traders should watch support and resistance levels closely to capitalize on breakout or reversal opportunities while managing volatility risks.There are no significant economic events today directly impacting EURUSD in the GMT+1 timezone. Market participants remain focused on upcoming ECB and Fed policy decisions and US labor data for directional clues.
Resistance & Support
The above financial market data, quotes, charts, statistics, exchange rates, news, research, analysis, buy or sell ratings, financial education, and other information are for reference only. Before making any trades based on this information, you should consult independent professional advice to verify pricing data or obtain more detailed market information. 1uptick.com should not be regarded as soliciting any subscriber or visitor to execute any trade. You are solely responsible for all of your own trading decisions.