






 |
| Gold V.1.3.1 signal Telegram Channel (English) |
USDCAD: Double-Bottom Formation Supports Bullish Trading Outlook Near 1.39 Resistance, September 15, 2026
2026-09-15 @ 13:01
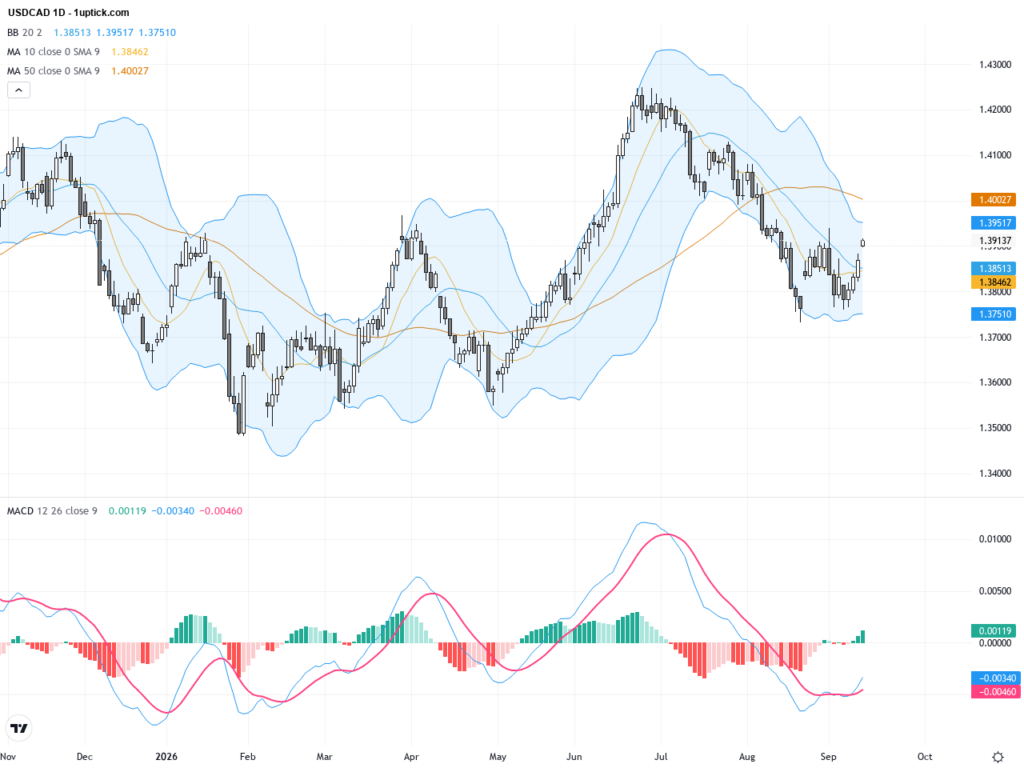
Over the past 24 to 48 hours, the USD/CAD pair has experienced notable yet mixed volatility. The closing price yesterday hovered around 1.39137, indicating the US Dollar held steady against the Canadian Dollar during the Asian session with modest gains but limited upside momentum.
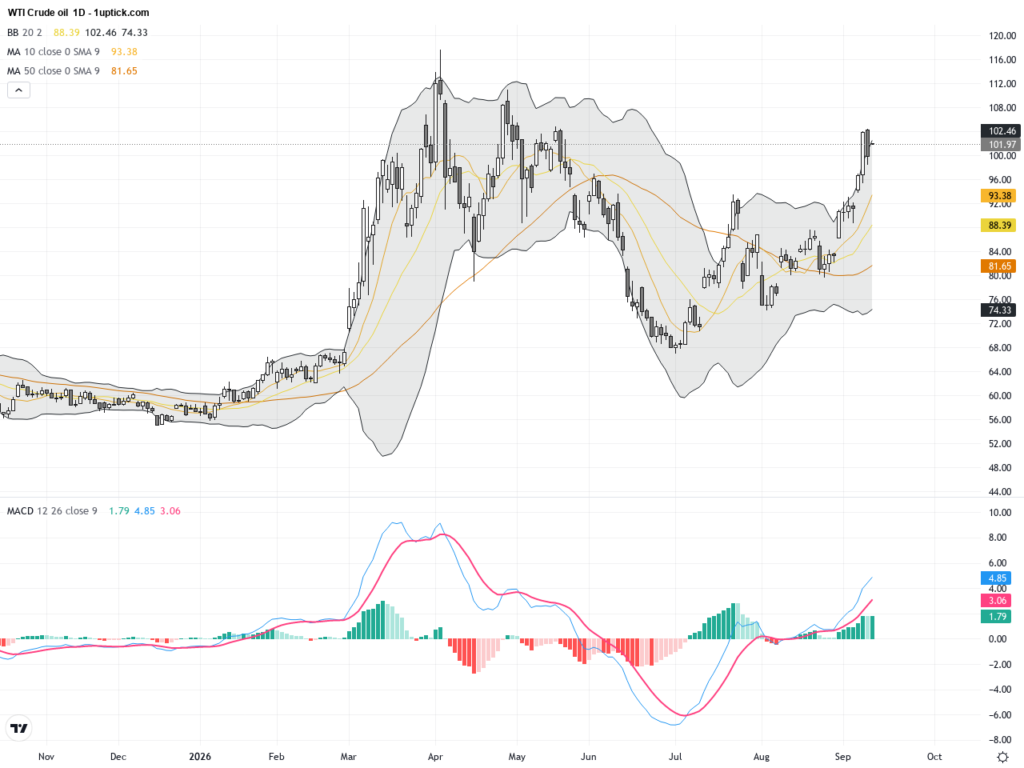
During this period, the Canadian Dollar received strong support from rising oil prices, which offset the short-term bullish pressures on the US Dollar. As oil is a critical driver of the Canadian economy, its rally provided a solid foundation for the CAD, leading to consolidation near the 1.3900 level. Investors are closely digesting the upcoming Federal Reserve rate decision, awaiting signals that could dictate the near-term USD direction.
Additionally, mixed US nonfarm payroll data created a complex backdrop for the USD, impacting the USD/CAD rate. While the US Dollar maintained overall strength, the oil-fueled resilience of the Canadian Dollar set up a tug-of-war scenario between the two currencies. For the average investor, this means that despite potential USD appreciation, the commodity-driven CAD remains a significant counterforce, preventing the pair from breaking major resistance zones quickly.
In summary, the USD/CAD price action in the last two days reflects a delicate balance between oil market gains and Federal Reserve rate hike expectations. The pair is likely to continue trading within the 1.38 to 1.40 range in the short term. Market participants should watch the imminent US monetary policy announcements closely, as they will be the key catalyst for the next wave of significant currency movement.
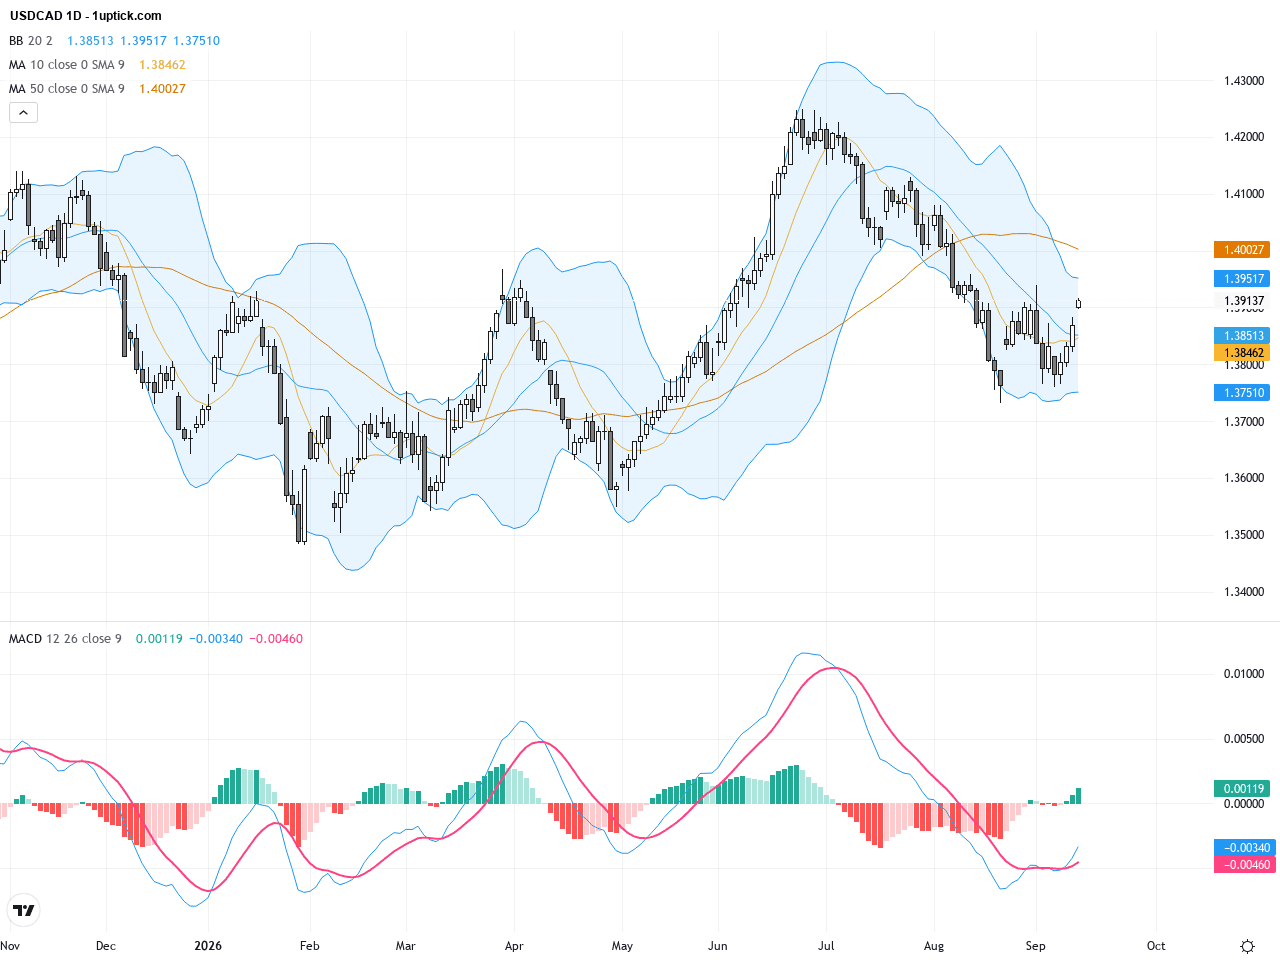
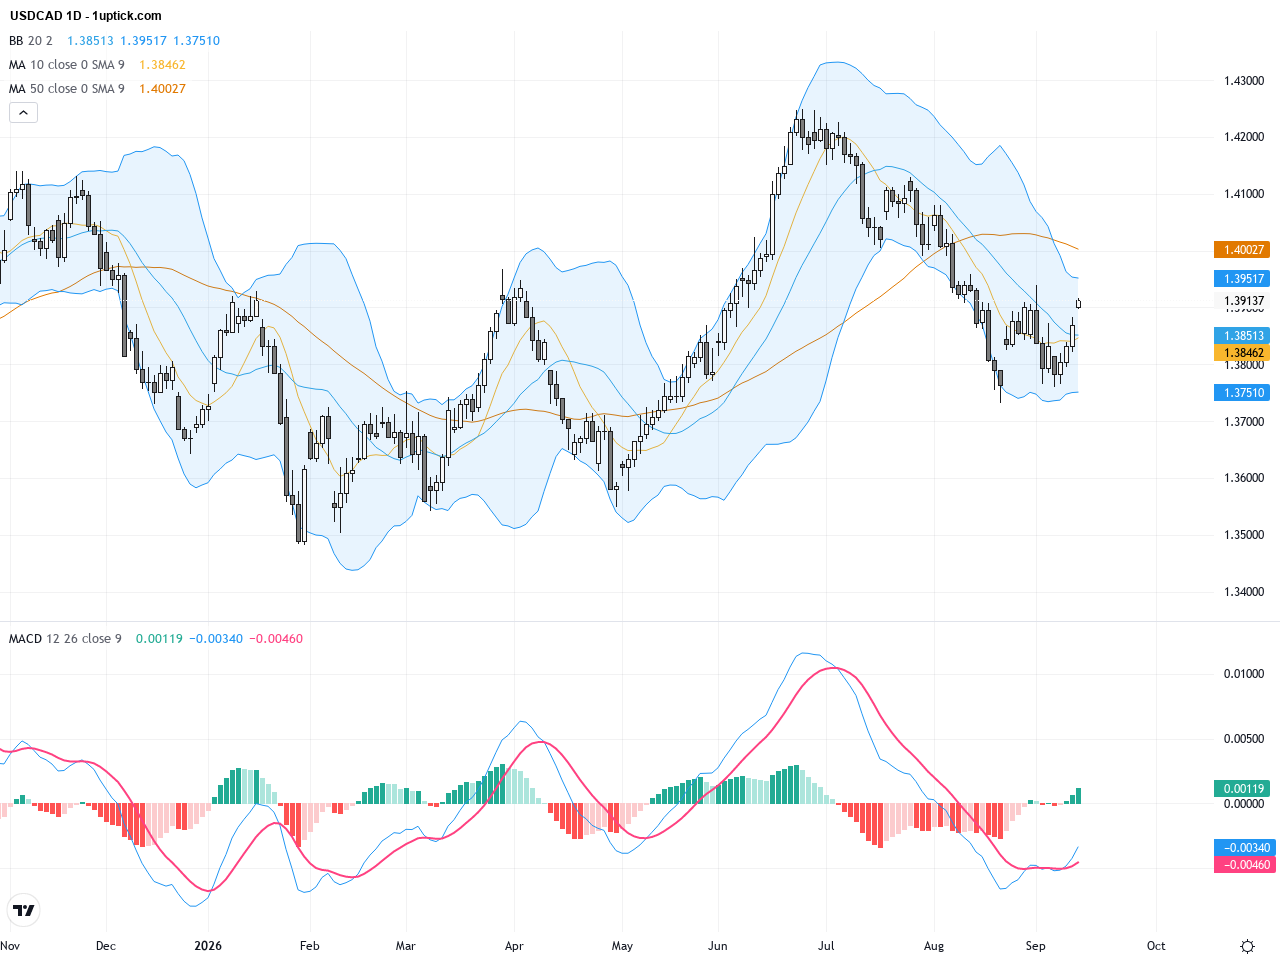
The daily chart shows USDCAD exhibiting a medium-term uptrend with a prominent double-bottom pattern established recently. The support base is near 1.3740, with the neckline resistance aligned closely with the 100-day Simple Moving Average (SMA) at approximately 1.39. Price action over the past few days has tested this 100-day SMA resistance without a clean breakout. Bollinger Bands indicate contracting volatility, suggesting a potential imminent price expansion. The MACD is signaling improving bullish momentum with the fast and slow lines nearing a golden cross, indicating possible upward movement in the next session.
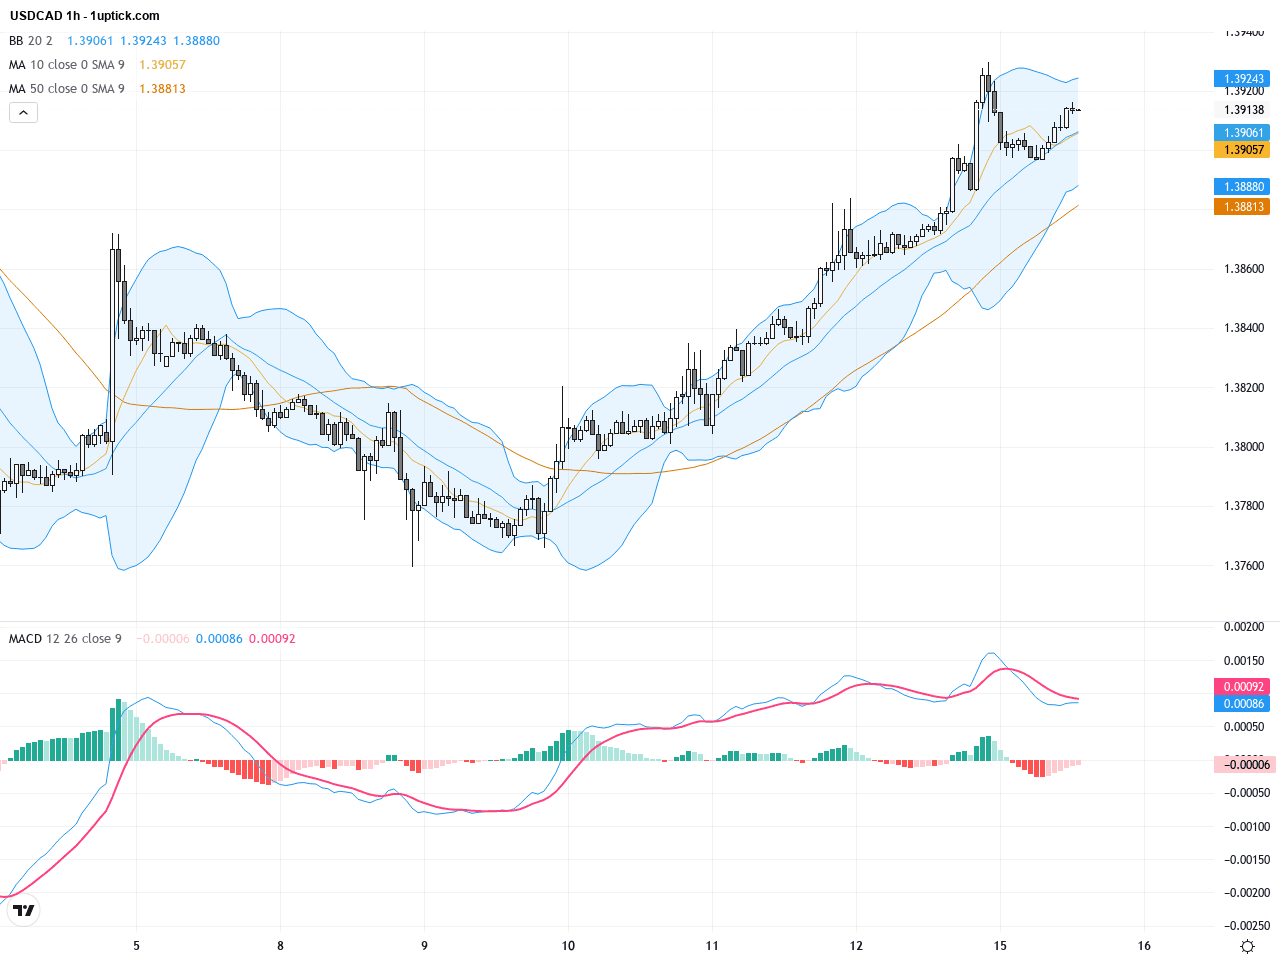
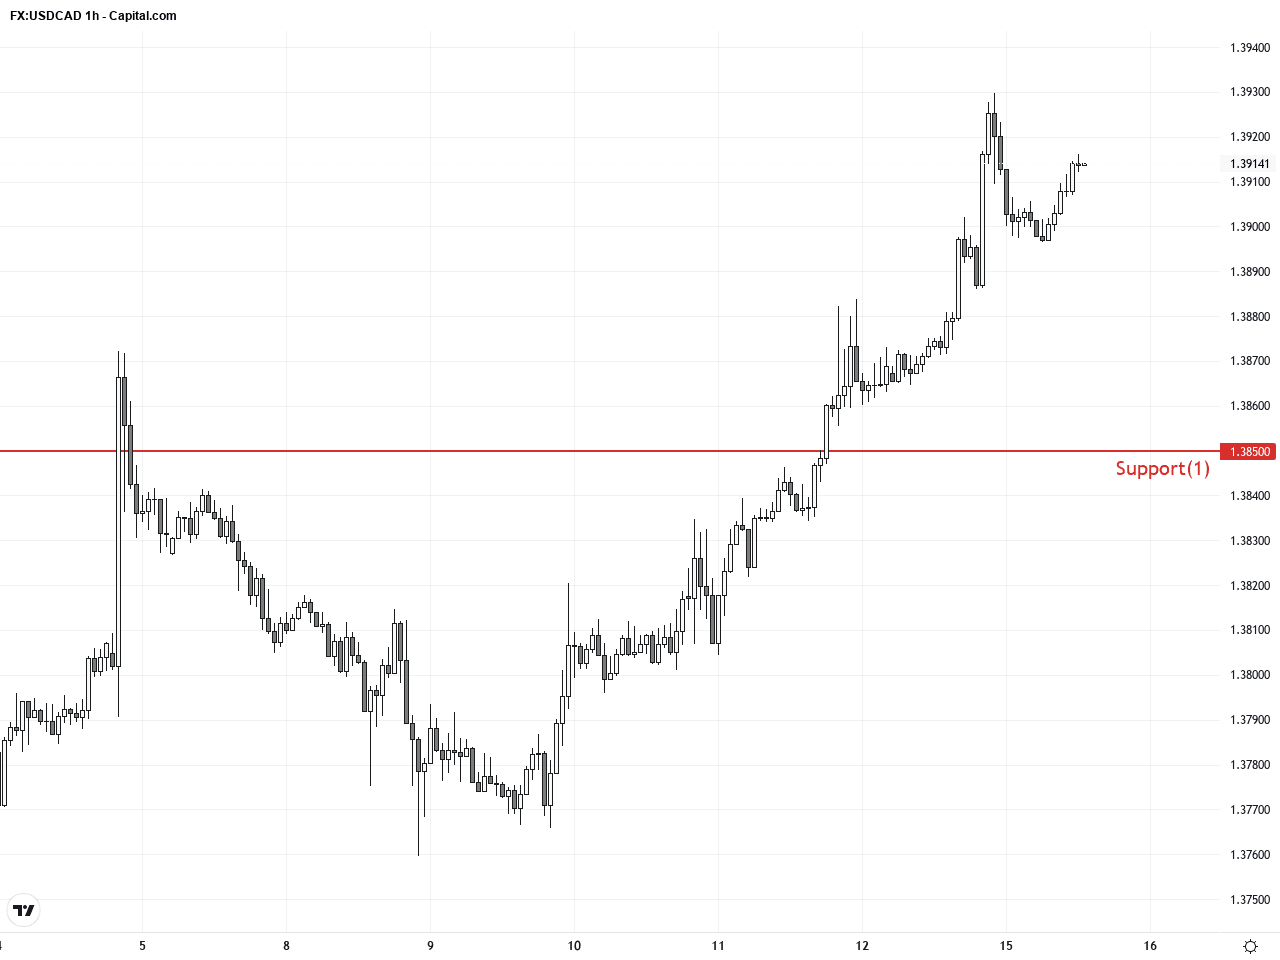
The hourly chart reveals consolidation between 1.3880 and 1.3940 over the last 3-5 days, with the 50 and 200 moving averages converging, indicating equilibrium in short-term momentum. The MACD histogram has started to shrink negative values, showing waning bearish pressure, while RSI hovers neutrally with no clear overbought or oversold conditions. Recently, a bullish engulfing candlestick formed near 1.3890, suggesting increased short-term buying strength.
Technical Trend: Current trend reflects cautious consolidation with a mildly bullish bias.
From a technical standpoint, the double-bottom pattern and MACD golden cross combined with the bullish engulfing candle provide strong confirmation of accumulating bullish momentum. A breakout accompanied by increasing volume at the key 1.39 resistance level would confirm further upside. Traders are advised to watch the current consolidation zone closely to seize high-probability breakout trades.Today’s economic calendar presents no major events directly impacting USDCAD. While several CPI and industrial production releases are scheduled globally, key US and Canadian data releases relevant to the pair are limited. Traders should focus on upcoming US Empire State Manufacturing Index and Canadian Wholesale Trade reports at 14:30 HKT, as these could provoke short-term volatility in USDCAD.
Resistance & Support
The above financial market data, quotes, charts, statistics, exchange rates, news, research, analysis, buy or sell ratings, financial education, and other information are for reference only. Before making any trades based on this information, you should consult independent professional advice to verify pricing data or obtain more detailed market information. 1uptick.com should not be regarded as soliciting any subscriber or visitor to execute any trade. You are solely responsible for all of your own trading decisions.