


 |
| Gold V.1.3.1 signal Telegram Channel (English) |

XAUUSD: Gold Faces Critical Correction Phase Amid Key Technical & Fundamental Factors
2026-02-03 @ 05:01
Over the past 24 to 48 hours, gold prices (XAUUSD) experienced significant volatility, closing yesterday local time at $4,668.13 per ounce, marking a decline from the previous day. After hitting a recent record high of $5,602, the gold market is undergoing a correction phase as investors hunt for new value support. Deutsche Bank (DB) has reaffirmed its $6,000 price target, emphasizing long-term bullish fundamentals; achieving this target within the year is not seen as unreasonable.
Market uncertainty remains elevated, with stock market volatility and Bitcoin facing downside risks, positioning precious metals, especially gold, as a key safe-haven asset. However, analysts suggest that gold and silver prices may face approximately 8 to 9 more weeks of corrective action, driven by cautious sentiment towards risk assets. Recent U.S. Federal Reserve personnel appointments triggered broad risk-asset selling, pushing gold prices briefly down to $4,402.38.
For everyday investors, the recent gold price swings resemble a period of breath and recalibration, as the market digests macroeconomic and policy uncertainties and awaits clearer direction. Despite short-term volatility, gold remains a solid inflation hedge and haven asset with strong long-term value support. Overall, the current market adjustment is a healthy price realignment likely laying the groundwork for the next rally phase.

The XAUUSD daily chart reveals a pronounced correction down from the record high of $5602 reached late January. Price has entered a wide consolidation zone with gradually rising lows, showing underlying bullish defense. Bollinger Bands have contracted, signaling reduced volatility, and the MACD oscillates near the zero line with volume tapering, indicating the market is in a consolidative phase without a clear directional bias. Overall, the daily trend is sideways to bullish, with key support around $4744 to $4428 holding the base. A breakout above the upper resistance zone could trigger the next bullish wave.
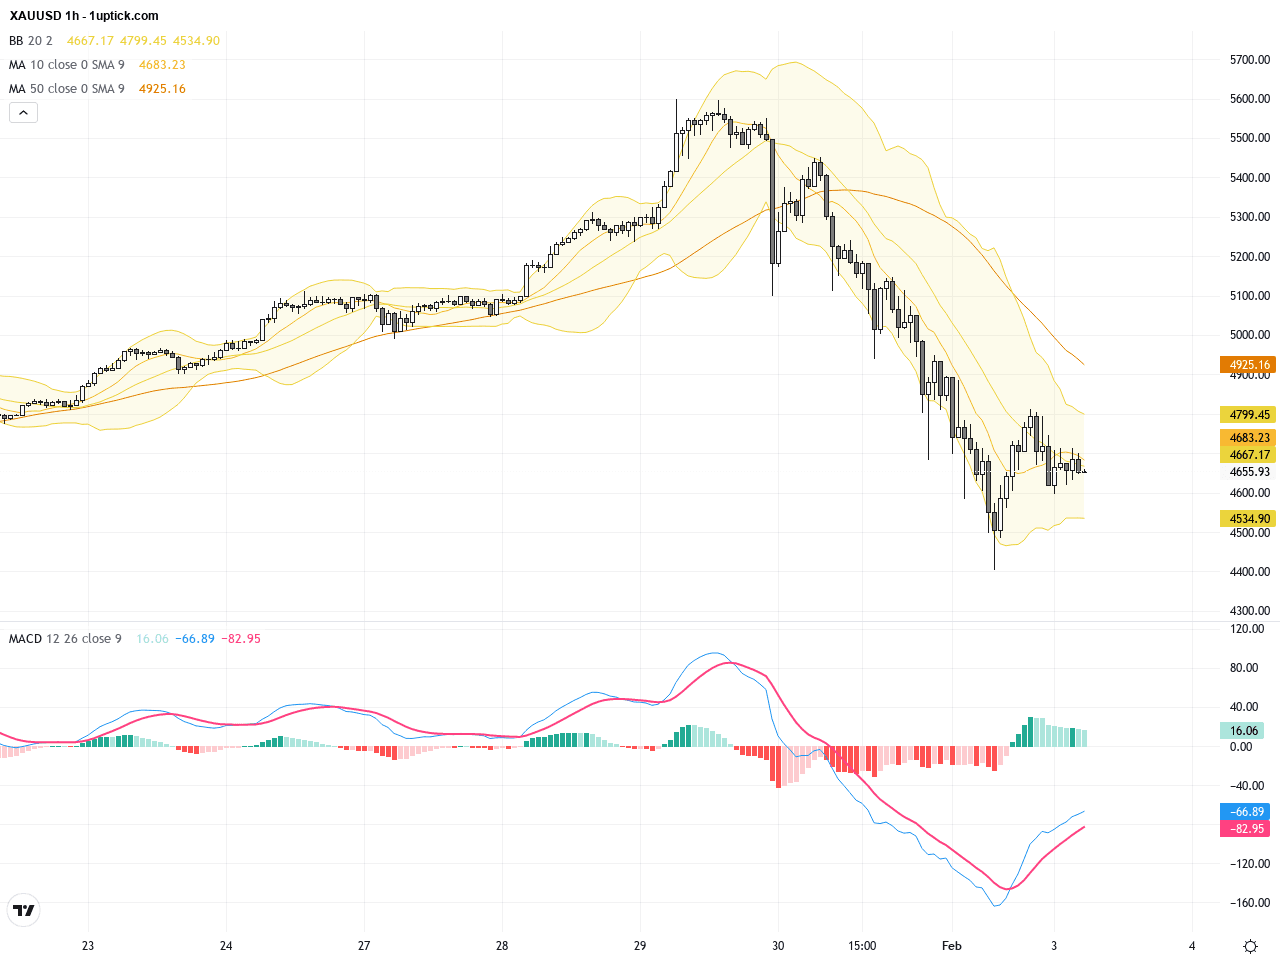
Looking at the last 3 to 5 days on the XAUUSD hourly chart, price experienced sharp declines then attempted stabilization near $4600. Short-term moving averages have converged, and prices repeatedly bounced off the lower Bollinger Band. The MACD shows a double bottom reversal pattern, indicating nascent bullish momentum within 24 hours. However, volume remains subdued, so further confirmation through price action in coming candles is needed to validate the trend shift.
Technical Trend: XAUUSD currently shows a cautious sideways consolidation with short-term corrective pressure, maintaining an overall neutral to slightly bullish bias.
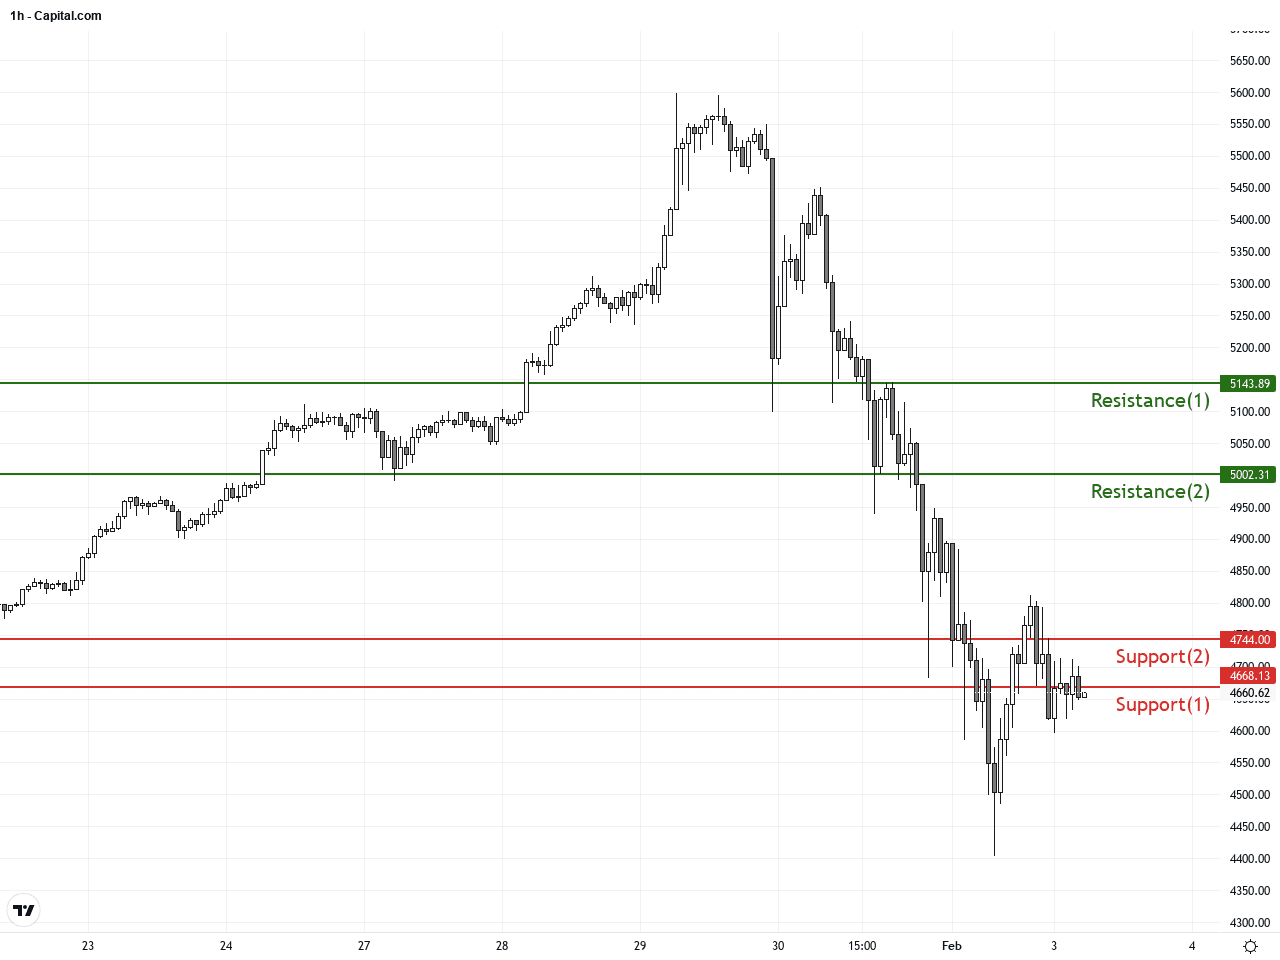
Technically, XAUUSD has entered a phase of consolidation with bullish engulfing candlestick patterns and a MACD double bottom signaling possible short-term rebound. However, the contracting daily Bollinger Bands and constricting MACD indicate the market remains uncertain. Traders should watch closely for support around $4700; a breakdown could hasten declines. Conversely, holding above this zone and surpassing $5000 resistance would improve the bullish outlook. Volume expansion will be key to confirming any trend reversal.Today’s economic events focus mainly on manufacturing PMI data across Europe and Asia. Japan’s PMI held steady at 51.5, aligning with expectations and suggesting stable activity. China’s PMI edged up slightly to 50.3, modestly better than before. These releases are unlikely to significantly sway XAUUSD short-term. The biggest impact could come from US ISM manufacturing data and speeches from FOMC members later today. Should US metrics outperform forecasts, a stronger USD may pressure gold; conversely, weaker data may provide relief to gold prices.
Resistance & Support
The above financial market data, quotes, charts, statistics, exchange rates, news, research, analysis, buy or sell ratings, financial education, and other information are for reference only. Before making any trades based on this information, you should consult independent professional advice to verify pricing data or obtain more detailed market information. 1uptick.com should not be regarded as soliciting any subscriber or visitor to execute any trade. You are solely responsible for all of your own trading decisions.