


 |
| Gold V.1.3.1 signal Telegram Channel (English) |

AUDUSD: Bullish Momentum Gaining After 50-day SMA Breakout with Eyes on 0.7100
2026-03-20 @ 06:01
Over the past 24 to 48 hours, AUD/USD has shown a clear upward trend, rising from yesterday’s close of 0.70347 to 0.70868, representing an approximate 0.74% increase. This rally was mainly driven by a weakening US dollar and fluctuating commodity prices. Although markets remain cautious about the delayed Fed rate hikes, the overall softness in the dollar provided a boost to the Australian dollar. Additionally, a 4.21% drop in US crude oil prices further weighed on the dollar against other currencies, indirectly supporting the AUD/USD’s ascent.
The Reserve Bank of Australia’s recent hawkish remarks, particularly from official Bullock clarifying that inflation was already high, provided additional support for the pair. Investors interpreted this as a sign that Australia may maintain a tight monetary policy stance, favorable for the AUD. Alongside recovering risk appetite boosting demand for risk assets, AUD/USD found solid buying support near the 0.7000 level, setting sights above 0.7100, with some forecasts projecting a rise to 0.74 by the end of the year.
To the average investor, the forex market movements reflect the interplay of global economic policy uncertainties and geopolitical risks. The dollar’s weakness creates opportunities to pivot towards commodity-linked currencies like the AUD, underpinned by Australia’s strong economic fundamentals and resilient commodity sectors such as copper and energy. For active traders and those considering medium- to long-term currency allocations, staying tuned to market news and central bank signals remains critical to navigating price trends in the weeks ahead.
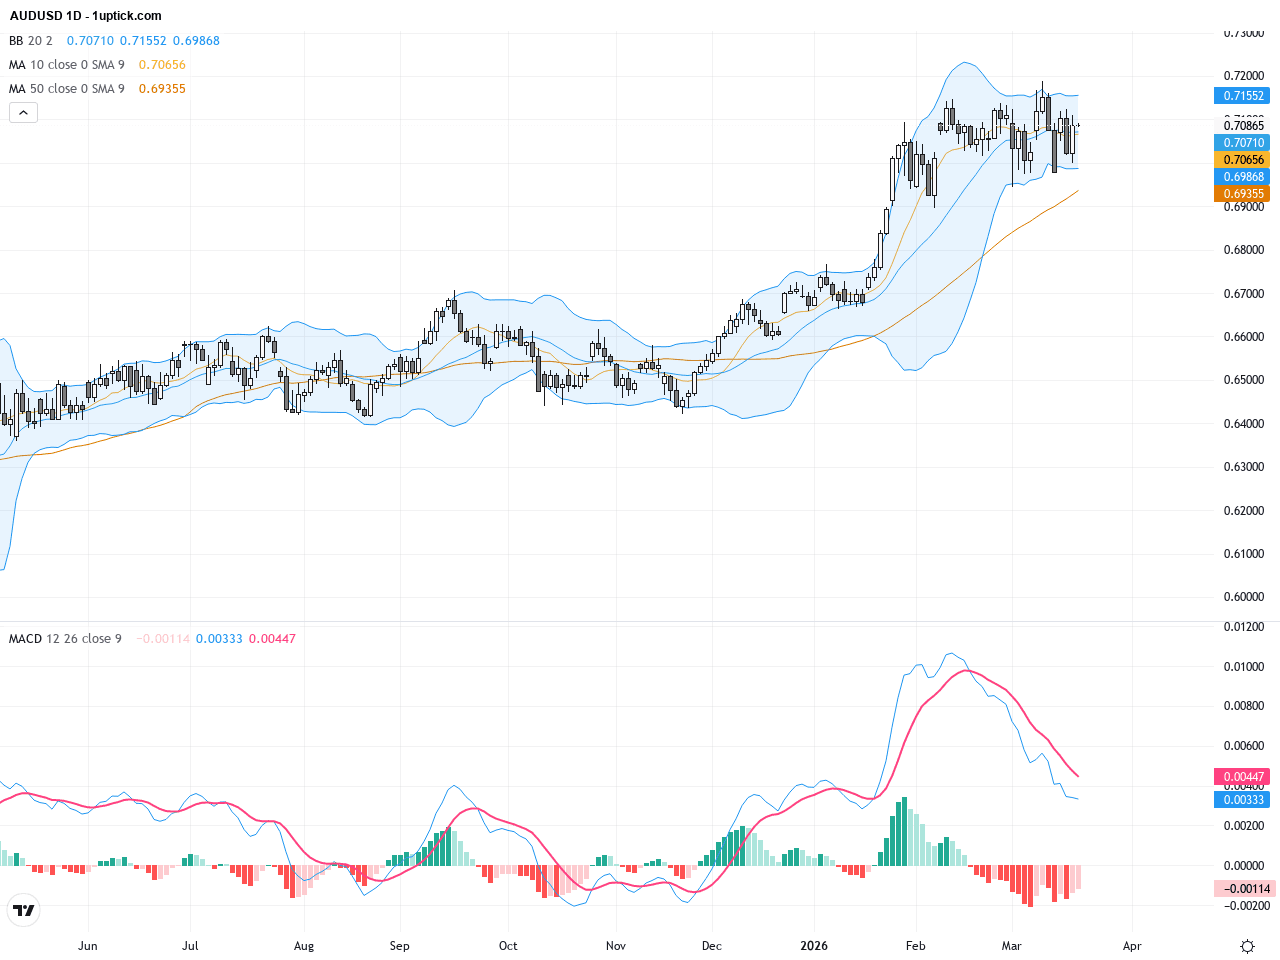
The daily chart shows a clear uptrend since the start of the year, with prices persistently trading above both the 50-day and 200-day moving averages. The recent breakout above the 50-day SMA (approx. 0.6964) demonstrates solid bullish momentum. The MACD histogram has expanded and remains positive, indicating strong buying interest. Bollinger Bands widening suggests increased volatility. Overall, the daily chart supports a medium- to long-term bullish trend with possible challenges at resistance levels near 0.7100 and 0.7150.

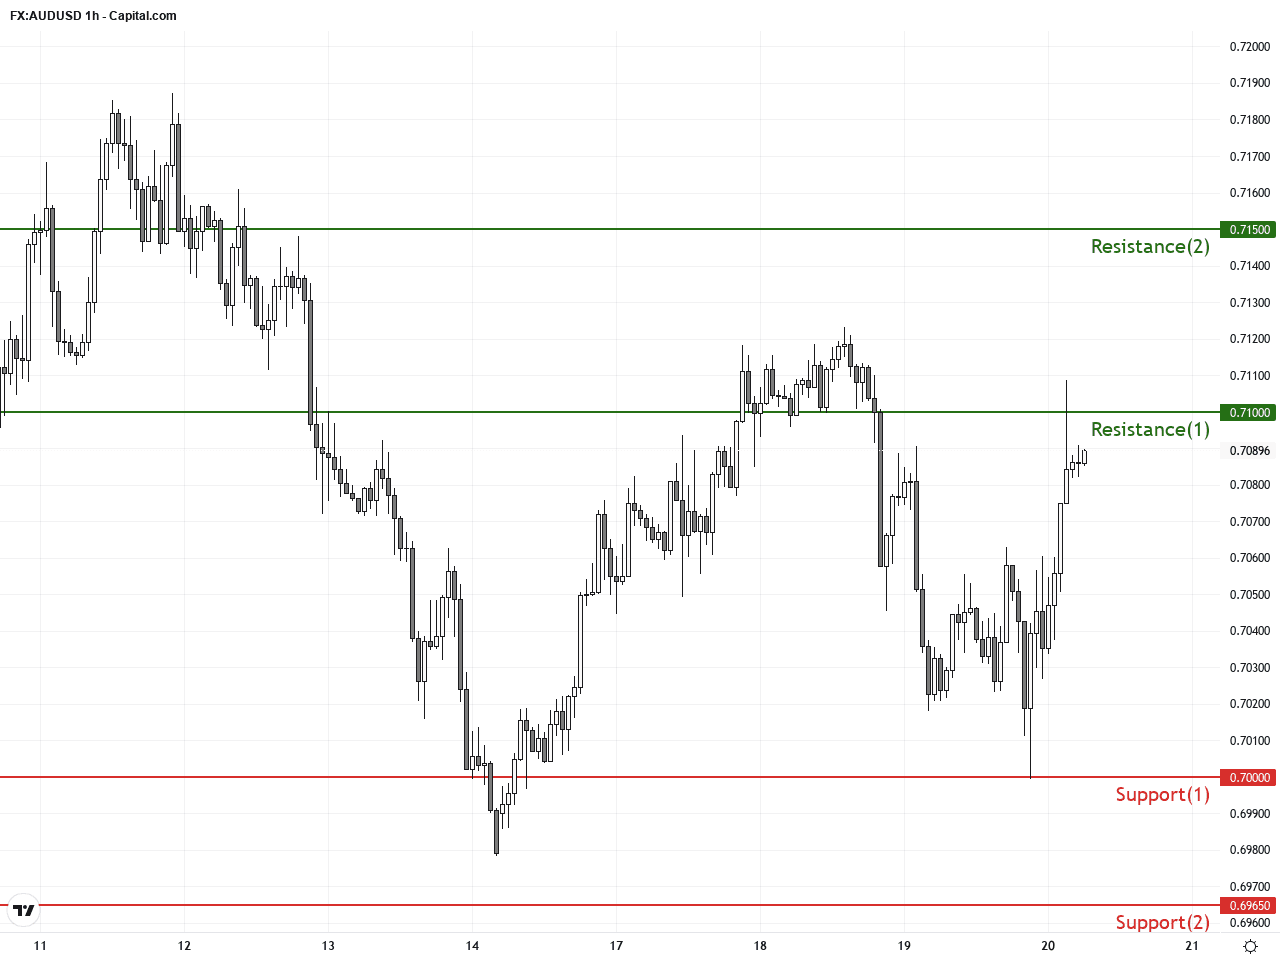
On the hourly chart over the past 3-5 days, AUDUSD shows a consolidation with upward bias. Price repeatedly found support near 0.7000 before rebounding, forming a small rising triangle pattern with resistance around 0.7100. The MACD lines have recently crossed upward, reinforcing the bullish signal. Bollinger Bands are flattening with slight contraction, indicating that a breakout could lead to increased volatility. The 23-period moving average is above the 50-period, supporting short-term strength.
Technical Trend: Cautiously Bullish
From a technical perspective, AUDUSD’s breakout above the 50-day SMA is accompanied by increased bullish momentum signaled by the MACD crossover and a widening Bollinger Bands. The rising triangle on the daily chart hints at a potential breakout higher, with key short-term support at 0.7000 and resistance clustered near 0.7100 and 0.7150. Recent bullish engulfing candlestick formations further reinforce the positive short-term outlook. Traders should keep an eye on USD movements and global commodity trends to manage risk and optimize position entries.Today’s economic calendar includes important Australian employment data at 01:30 GMT+1. The unemployment rate rose slightly to 4.3% (forecast 4.1%), but employment change surged by 48.9k, well above the expected 20.3k. This favorable data is likely to provide immediate support to AUDUSD, especially as Asia-Pacific markets open. There are no other major direct events impacting AUDUSD today, suggesting that the currency pair’s trend should remain supported by the current fundamentals.
Resistance & Support
The above financial market data, quotes, charts, statistics, exchange rates, news, research, analysis, buy or sell ratings, financial education, and other information are for reference only. Before making any trades based on this information, you should consult independent professional advice to verify pricing data or obtain more detailed market information. 1uptick.com should not be regarded as soliciting any subscriber or visitor to execute any trade. You are solely responsible for all of your own trading decisions.