


 |
| Gold V.1.3.1 signal Telegram Channel (English) |

USDCAD: Watching Key Resistance at 1.3900 Amid Shifting Risk Sentiment
2026-04-02 @ 13:01
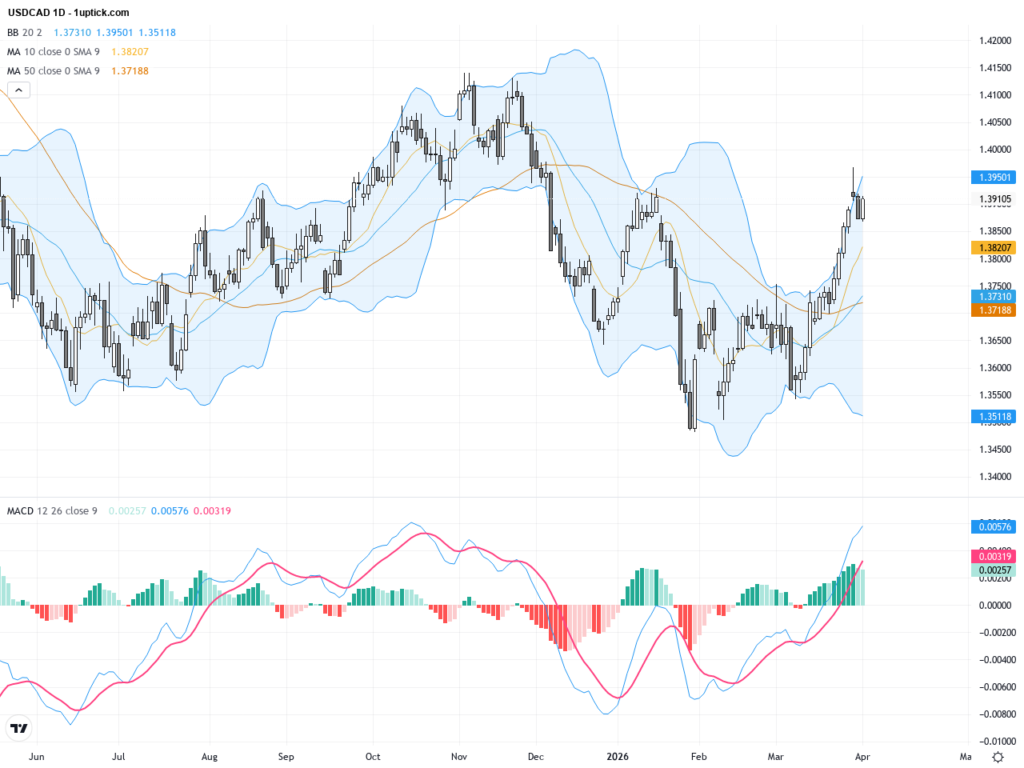
Over the past 24 to 48 hours, the USD/CAD exchange rate has shown notable volatility, driven largely by improving geopolitical developments in the Middle East. Yesterday’s closing price stood at 1.39109. Market sentiment was influenced by US President Trump’s remarks hinting at a potential early resolution to the Iran conflict, which boosted risk appetite and weakened the US dollar while strengthening the Canadian dollar.
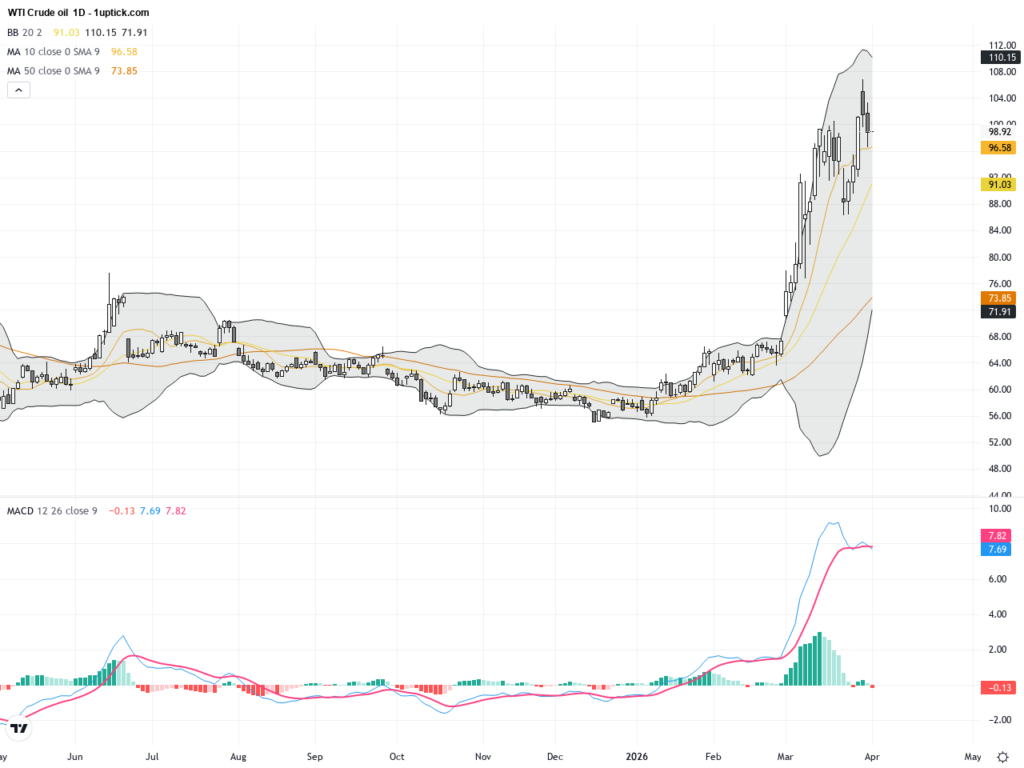
From the news perspective, the rising optimism over an early end to the war in the Middle East led to falling oil prices, which heavily impact the Canadian dollar due to Canada’s role as a major crude exporter. Investors have shifted towards riskier assets, pushing down the US dollar index (DXY). As a result, USD/CAD has drifted lower but remained near key psychological levels.
For the average investor, the last two days of market fluctuations resemble a sudden wake-up call impacting currency prices. The cooling of US-Iran tensions alleviated pressure on oil prices and boosted global stock markets, reducing the demand for the US dollar as a safe haven. In other words, the improvement in risk sentiment gave the Canadian dollar an edge over the US dollar, though investors should stay vigilant as geopolitical events remain a source of potential market volatility.

The daily chart shows USDCAD continuing its range-bound activity between approximately 1.3700 and 1.3950, maintaining an overall upward trend with price positioned above the 50-day (around 1.368) and 200-day (around 1.383) moving averages, which suggests bullish momentum. However, price action shows some high-level consolidation with Bollinger Bands tightening, indicating lower volatility. The MACD remains above zero with a bullish bias, but traders should be cautious of potential pullbacks after recent price strength.

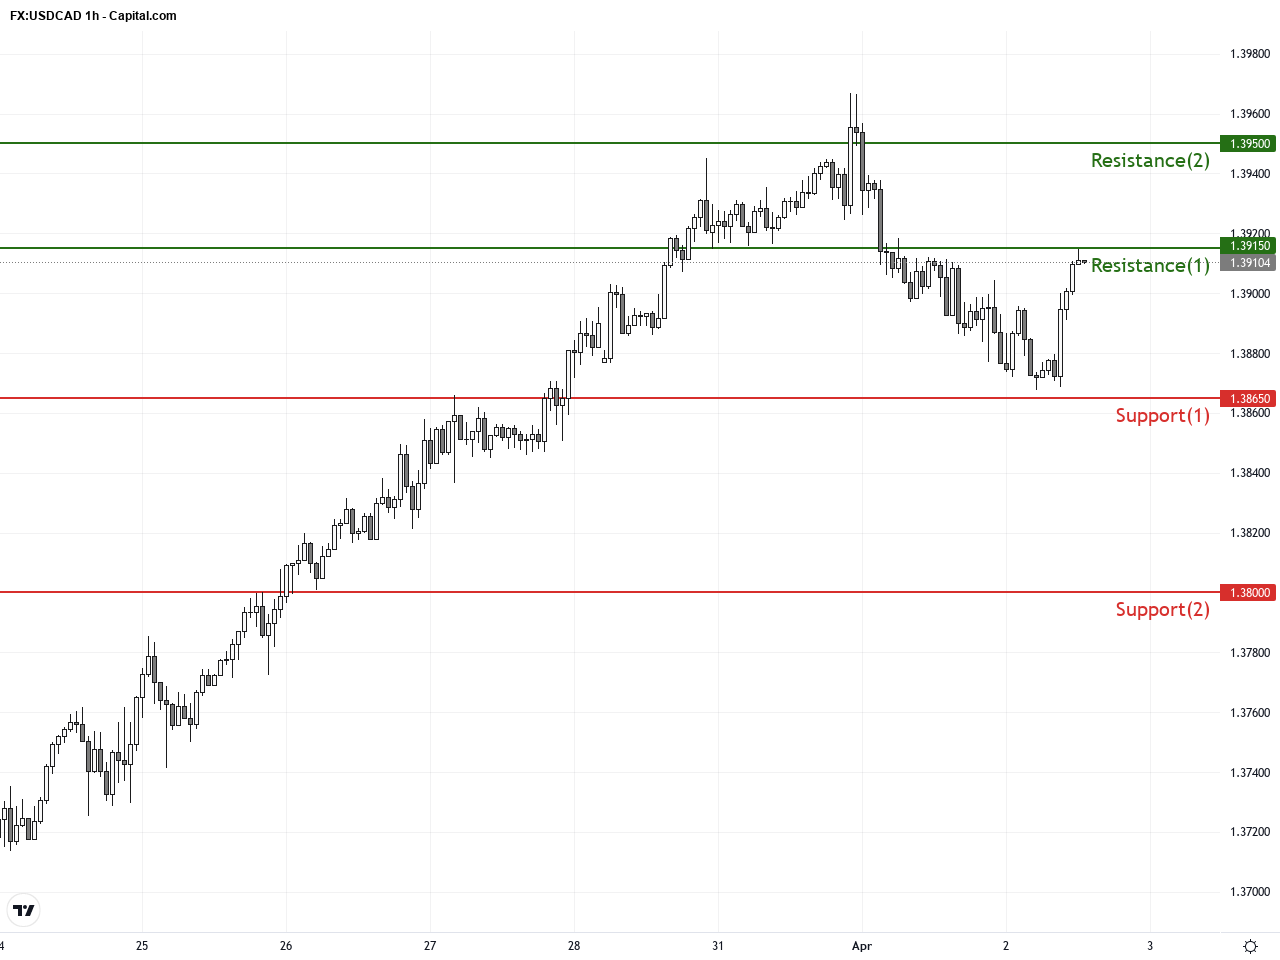
The hourly chart over the last 3-5 days reveals USDCAD finding support near 1.3850 and consolidating around the 1.3900 level. Short-term moving averages (20 and 50 SMA) are converging, signaling a market awaiting a clear direction. The MACD recently formed a bullish crossover with diminishing histogram bars, while RSI hovers near the midpoint of 50, pointing to sideways movement. A recent hammer candlestick indicates renewed buyer interest; a successful hold above 1.3900 in the next 24 hours may set the stage for further advances.
Technical Trend: The overall trend is cautiously bullish with potential downside risks, describing a cautiously optimistic consolidation pattern.
The market remains sensitive to geopolitical developments and oil price dynamics influencing USDCAD fundamentals and technicals. The pair is currently testing the resistance zone at 1.3900; a successful breakout could target the yearly high near 1.4295, while failure to hold could expose support around 1.3800. Indicators such as MACD and Bollinger Bands offer confirmation clues, and the recent hammer candlestick highlights possible bullish momentum in the short term, worth incorporating into trade setups.Today’s economic calendar includes the Canadian February trade balance expected to improve slightly to -2.3 billion CAD from -3.65 billion CAD previously. A better-than-expected report could lend support to the Canadian dollar and weigh on USDCAD. Key US releases at 14:30 GMT+1, including trade balance and weekly jobless claims, may influence the dollar’s short-term trajectory, especially if labor data disappoints. There are no major unexpected events, but traders should monitor the data to identify immediate impacts on USDCAD.
Resistance & Support
The above financial market data, quotes, charts, statistics, exchange rates, news, research, analysis, buy or sell ratings, financial education, and other information are for reference only. Before making any trades based on this information, you should consult independent professional advice to verify pricing data or obtain more detailed market information. 1uptick.com should not be regarded as soliciting any subscriber or visitor to execute any trade. You are solely responsible for all of your own trading decisions.