







 |
| Gold V.1.3.1 signal Telegram Channel (English) |

GBPUSD: Critical Bull Flag Pattern Near 1.33 Amid BoE Rate Uncertainty
2026-04-03 @ 13:01
Over the past 24 to 48 hours, GBP/USD has been trapped around the 1.33 level, closing yesterday at 1.32263 with a slight upward move. However, pressure on the British Pound remains as the Bank of England (BoE) grapples with its rate decision dilemma. The BoE recently held rates steady at 3.75% while warning that inflation risks persist, largely due to Middle East-driven price pressures, keeping the Pound under strain.
Meanwhile, the US Dollar Index has slipped below 99.60 following easing tensions in the Middle East, providing some support for GBP/USD. Risk appetite remains fluid as traders watch developments in the region for clues on potential peace, which affects safe-haven demand. Institutions like Bank of America forecast intensified selling pressure on Sterling, targeting a drop to 1.30, reflecting concerns over the UK economy and monetary policy outlook.
In summary, GBP/USD’s price movements are being driven by a mix of macroeconomic and geopolitical factors. Investors could relate this to a cautious driver navigating uncertain roads—hopeful to move forward but wary of unexpected obstacles. With upcoming inflation figures and retail sales data on the horizon, the currency pair’s direction will remain closely tied to central bank policies and global risk events.

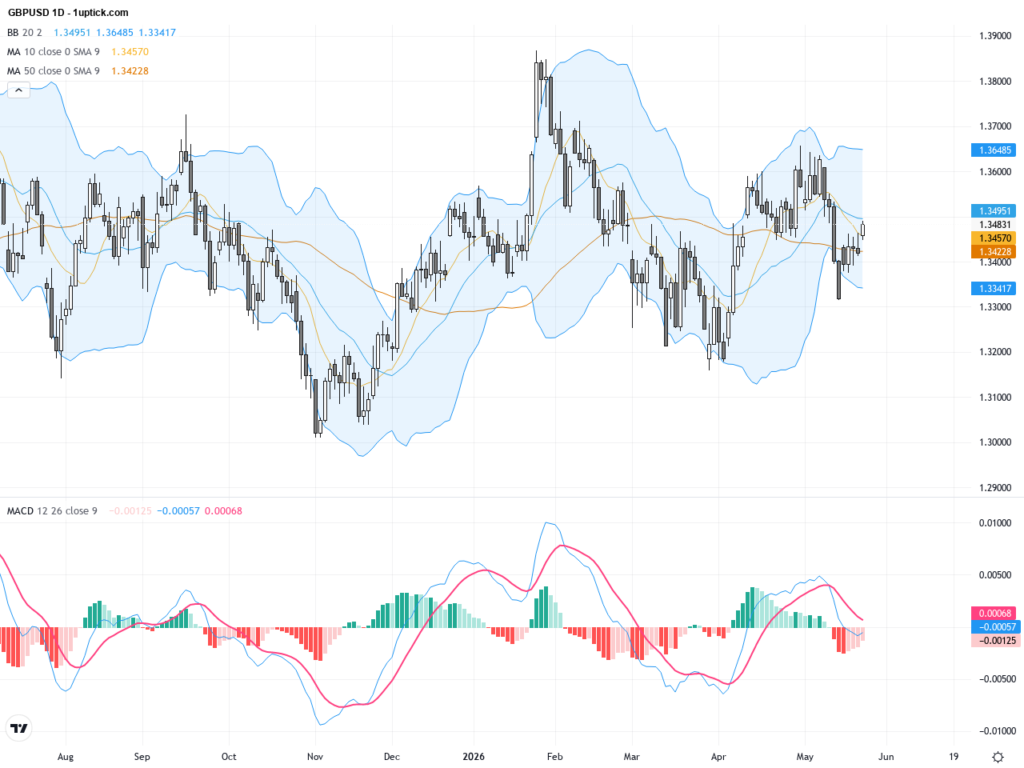
The daily chart reveals a subdued downtrend over the past three weeks with GBPUSD struggling below the 50- and 200-day moving averages near 1.34. Price attempts to break higher have failed, showing persistent resistance. The pair is oscillating around the Bollinger Bands middle band, while MACD signals a potential slowdown in bearish momentum. Overall, the longer-term bias remains bearish but short-term stabilization hints at possible reversal or consolidation.
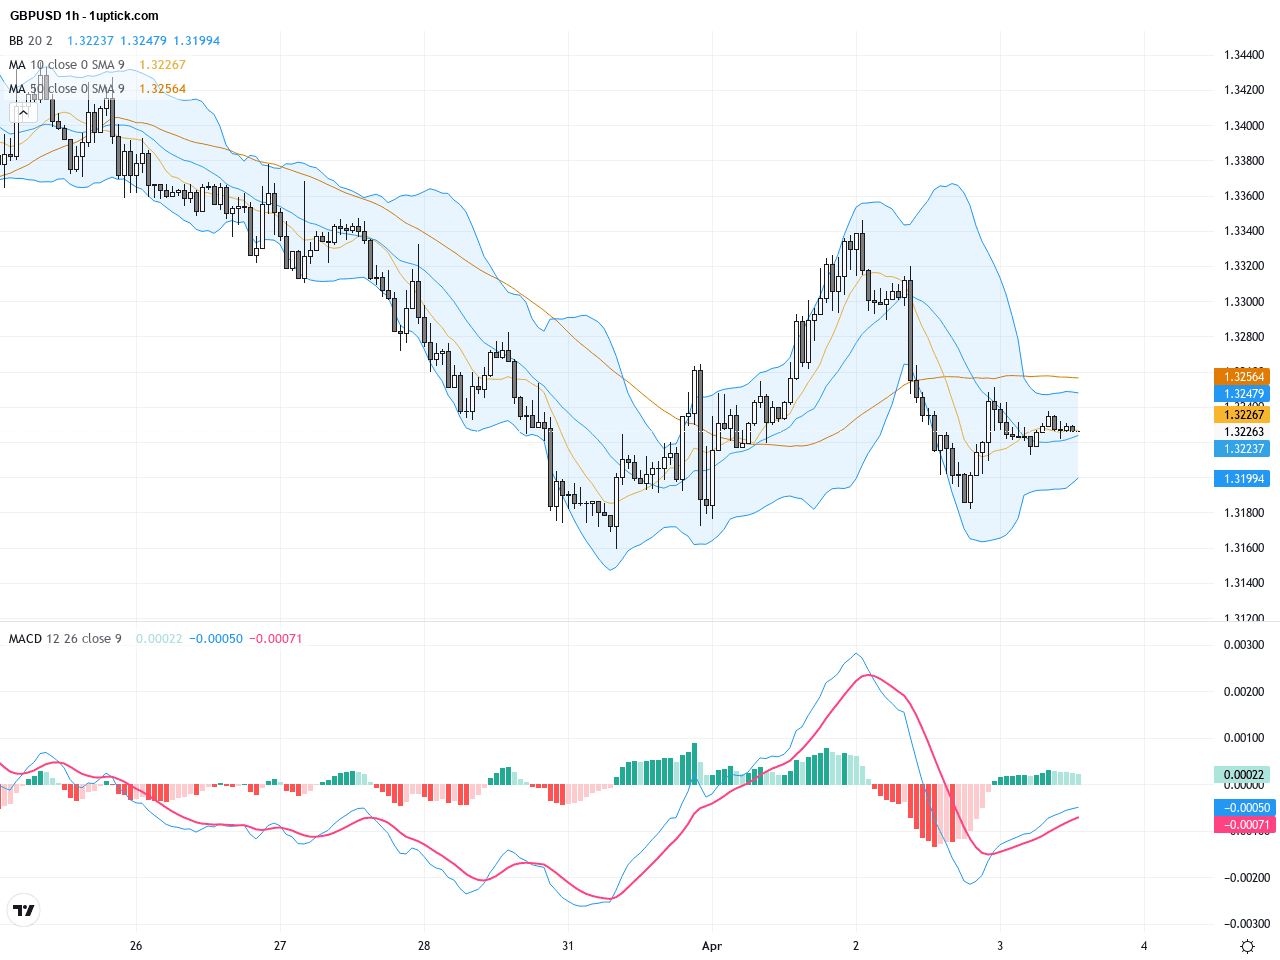
In the hourly chart covering the last 3-5 days, GBPUSD displays a classic bull flag pattern—consolidating in the 1.3200 to 1.3310 range following a rebound fueled by US Dollar weakness. Bollinger Bands have compressed alongside declining volume, with MACD lines converging, indicating price indecision but an imminent move. A recent hammer candlestick indicates sellers losing control, supporting a potential breakout above 1.33.
Technical Trend: The current trend is cautiously bullish with short-term volatile sideways consolidation, while medium-term resistance remains intact.
Technically, GBPUSD’s formation of a bull flag near 1.33 suggests consolidation before a possible bullish continuation. Daily MACD is flattening and the Bollinger Bands’ middle band holds well, signaling intermediate stability. On the hourly chart, the hammer pattern combined with MACD cross hints at short-term upward momentum, though volume caution warns potential false moves. The key is monitoring the 1.33 resistance breakout or rejection tomorrow, alongside US non-farm payroll data impact.Today’s major economic events in GMT+1 timezone center on the US employment data release at 14:30, including non-farm payrolls and unemployment rate. These are highly relevant for GBPUSD. Forecasts expect 60k jobs added and an unchanged 4.4% unemployment rate. A stronger-than-expected result likely boosts USD strength, applying downward pressure on GBPUSD. Other global releases have limited immediate impact on GBPUSD. There are no direct UK data releases today, so traders should focus on the US reports.
Resistance & Support

The above financial market data, quotes, charts, statistics, exchange rates, news, research, analysis, buy or sell ratings, financial education, and other information are for reference only. Before making any trades based on this information, you should consult independent professional advice to verify pricing data or obtain more detailed market information. 1uptick.com should not be regarded as soliciting any subscriber or visitor to execute any trade. You are solely responsible for all of your own trading decisions.