







 |
| Gold V.1.3.1 signal Telegram Channel (English) |
USDCAD: Heightened Downside Pressure Nears Key Support, Trading Outlook Cautiously Watchful
2026-04-16 @ 13:01
Over the past 24 to 48 hours, the USD/CAD has shown a mild decline, slipping from yesterday’s closing price of around 1.37405 to approximately 1.3718. Market attention has been focused on the prospect of renewed talks between the United States and Iran as well as the impact of oil price movements strengthening the Canadian dollar.
Since Wednesday, USD/CAD has faced downside pressure as investors reassess geopolitical risks in the Middle East. Although the outlook for a US/Iran peace deal remains uncertain, the mere prospect has shifted market sentiment to a more optimistic stance, benefiting commodity-linked currencies such as the CAD due to rising oil prices. The steady climb in oil, especially following the US naval blockade announcement in the Strait of Hormuz, has further bolstered the Canadian dollar’s strength.
For the average investor, this highlights the dynamic and rapidly evolving forex environment, where geopolitical news and commodity prices significantly influence currency valuations. The slight rebound in the US dollar reflects a technical correction from its recent oversold state, but overall downward pressure remains in place. Traders with USD/CAD exposure should closely watch the upcoming simultaneous US and Canadian economic data releases, as these may trigger short-term volatility.

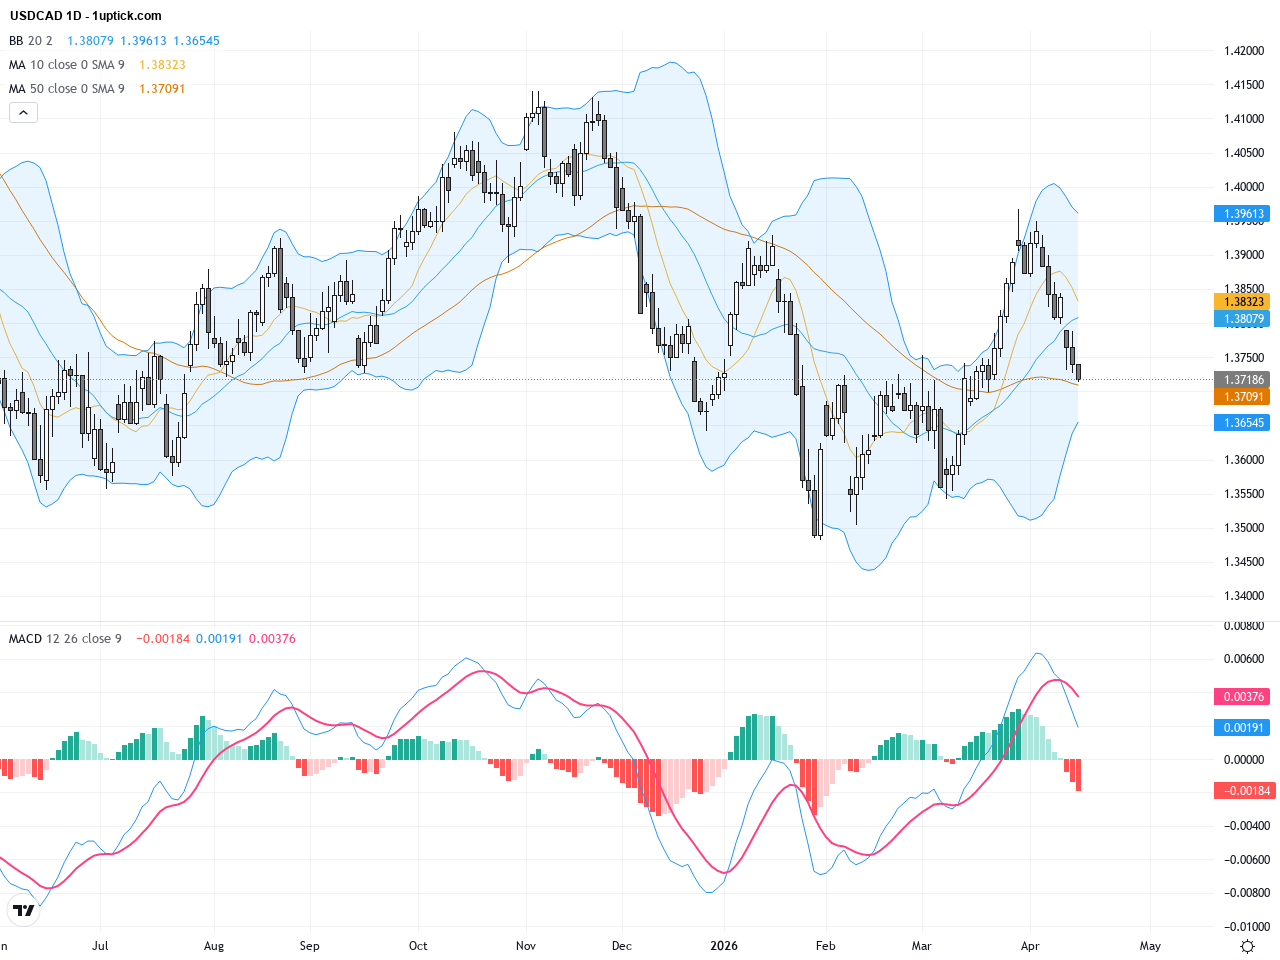
Since early April, USDCAD has displayed a clear downtrend, falling from around 1.39 to below 1.37. The daily chart shows multiple tests and breaks of the 50-day moving average (~1.3741) and nearing the 200-day moving average (~1.3830) as resistance. The Bollinger Bands are narrowing, indicating reduced volatility. The MACD remains in negative territory with expanding bearish momentum. Overall, the daily trend remains bearish in the medium-to-long term, making it vital to watch for any breaches of the 200-day moving average support.
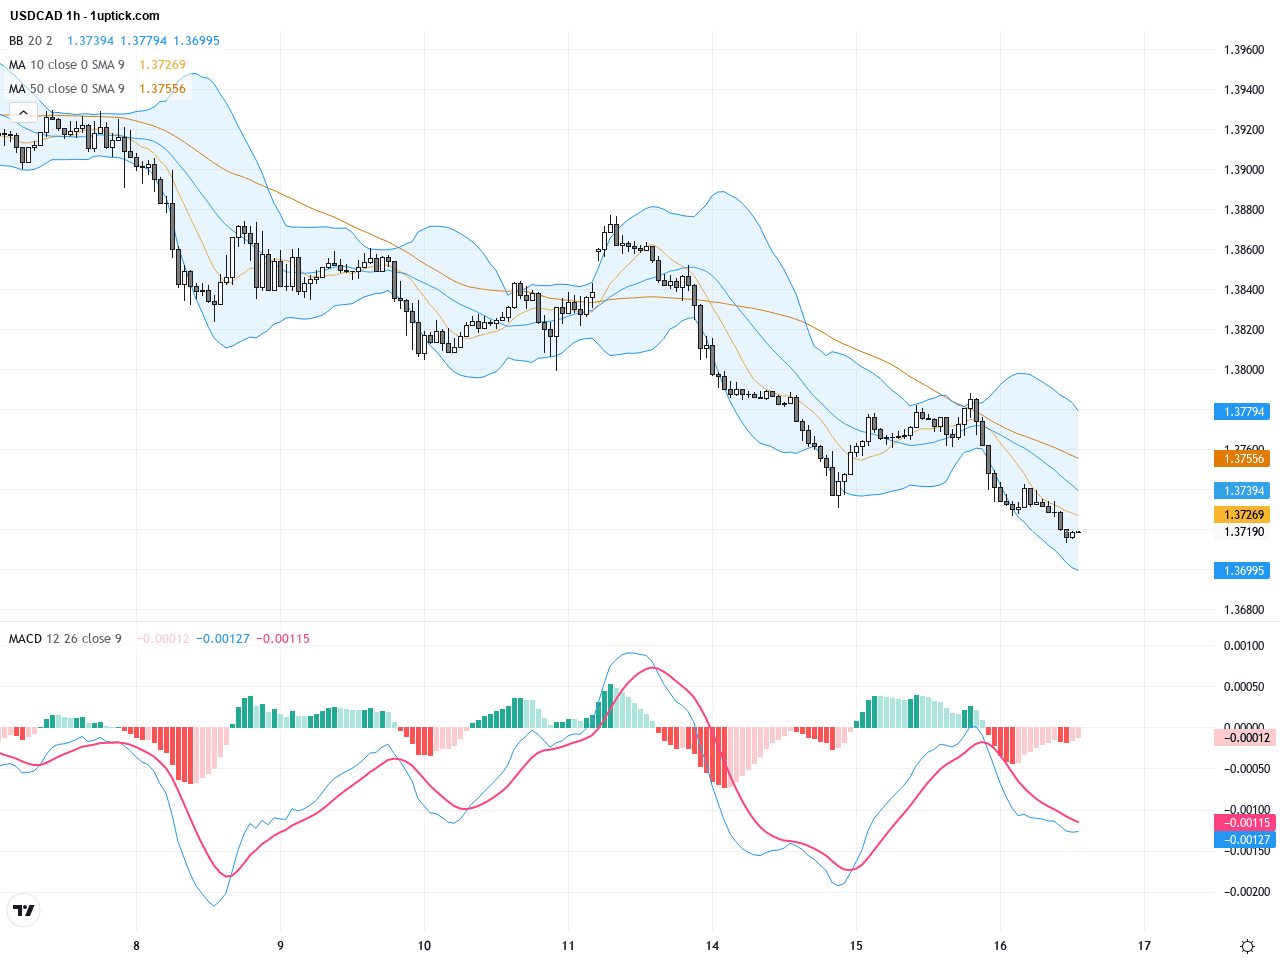
The last 3-5 days on the hourly chart reveal USDCAD consolidating between 1.3710 and 1.3775, forming a sideways trading range. The 20 and 50-period moving averages intersect near 1.375, marking key support and resistance zones. Bollinger Bands contraction suggests an upcoming breakout. The MACD is near a bullish crossover, signaling potential short-term upside momentum, though volume remains modest, so follow-through is essential.
Technical Trend: USDCAD is presently in a cautiously consolidating phase with underlying bearish bias but showing potential short-term recovery momentum.
Technically, USDCAD is currently building a symmetrical triangle consolidation pattern that began forming in early April, fluctuating between key support at 1.3710 and resistance near 1.3775. Recent hammer and engulfing candlestick patterns on both daily and hourly charts, especially the bounce from yesterday’s low at 1.3713, suggest short-term buying interest. The MACD indicator hints at a fading bearish momentum. Traders should watch this consolidation zone closely for breakout direction to capture upcoming trading opportunities.Today’s GMT+1 economic calendar shows limited direct data impacting USDCAD from Canada or the US. Key releases from Australia, the UK, and China are scheduled but with lesser relevance. The US will release the Philadelphia Fed Index and Weekly Jobless Claims at 14:30 HKT. If US data misses forecasts, the Canadian dollar could gain ground; conversely, stronger-than-expected figures would reduce downside risk for the US dollar. In summary, no major direct economic event is scheduled for USDCAD today, so market sentiment and geopolitical updates remain key drivers.
Resistance & Support

The above financial market data, quotes, charts, statistics, exchange rates, news, research, analysis, buy or sell ratings, financial education, and other information are for reference only. Before making any trades based on this information, you should consult independent professional advice to verify pricing data or obtain more detailed market information. 1uptick.com should not be regarded as soliciting any subscriber or visitor to execute any trade. You are solely responsible for all of your own trading decisions.