


 |
| Gold V.1.3.1 signal Telegram Channel (English) |
WTI Crude Oil: Geopolitical Tensions Propel Price Breakout Amid Supply Concerns, June 2, 2026
2026-06-02 @ 06:09
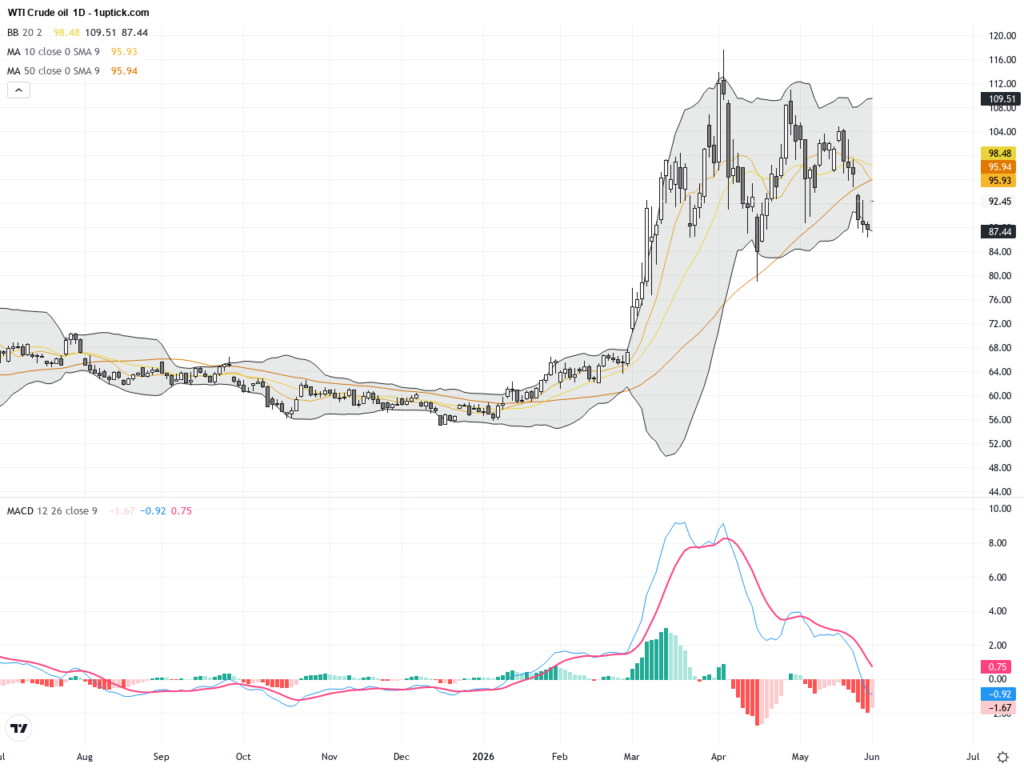
Over the past 24 to 48 hours, the WTI crude oil market has seen significant volatility, with prices climbing sharply from the closing price of $92.16 on June 1, 2026, experiencing gains exceeding 7% in a single day amid heightened market tension in the Middle East.
The primary driver was the stalling of indirect talks between the US and Iran alongside Iran’s threat to fully seal the Strait of Hormuz, escalating risks to global oil supply chains and triggering a swift price surge. These developments raised investor fears of energy supply disruptions, pushing prices higher.
For the average investor, this situation resembles a sudden supply shock alert, underscoring how deeply geopolitical tensions influence oil prices. When a vital shipping route faces potential closure, supply tightens while demand remains stable or increases, naturally driving prices up. Investors should closely monitor diplomatic negotiations and regional developments to navigate the likely high volatility in the oil market ahead.

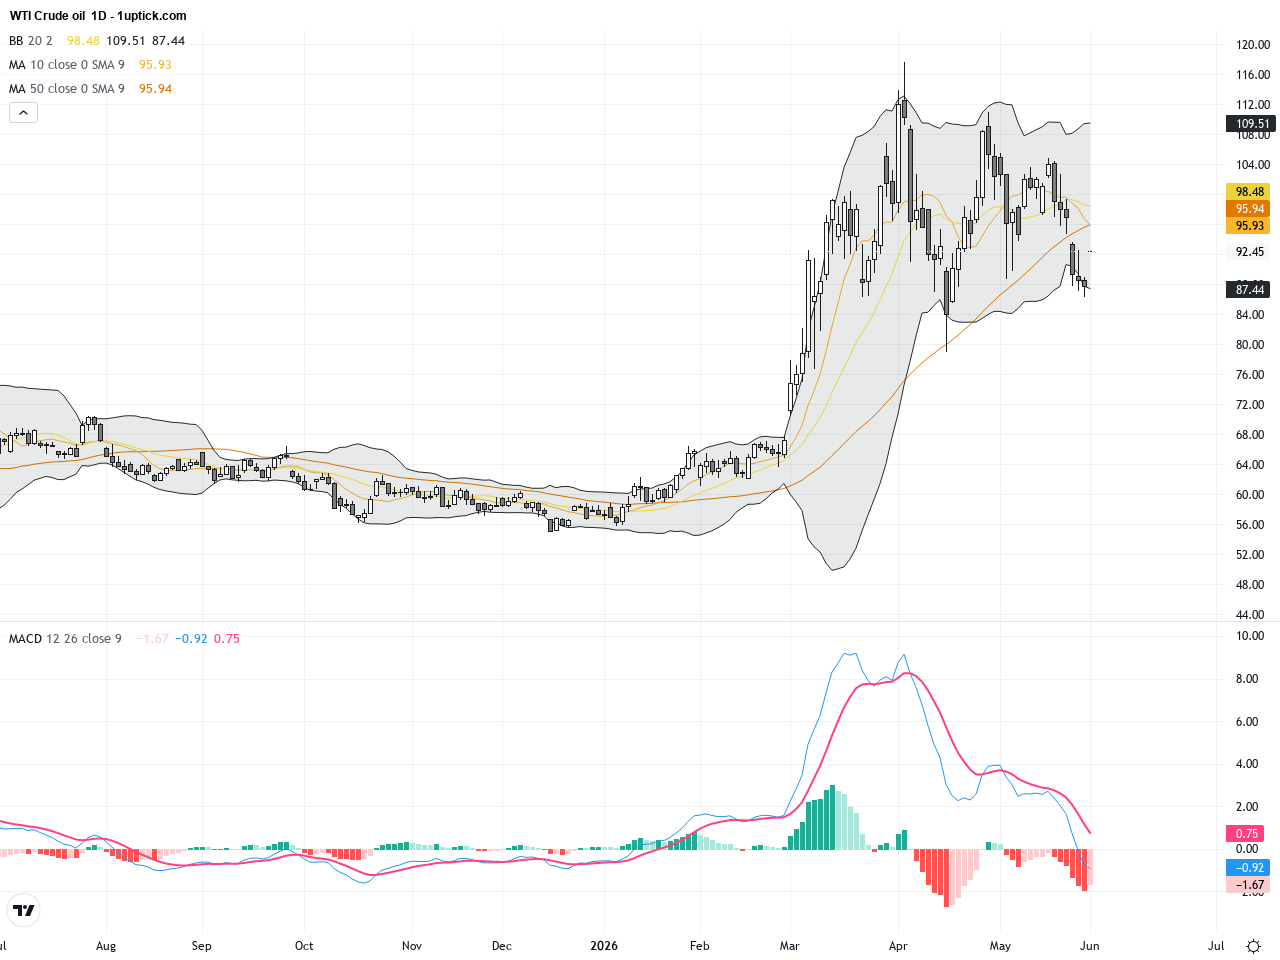
The daily chart shows a clear uptrend since mid-May, with WTI breaking above the $90 resistance level in recent sessions and hitting a high of $94.78 before settling at $92.16. The 20-day and 50-day moving averages are in bullish alignment, with price consistently trading above the Bollinger Band midline, signaling strong upward momentum. The MACD histogram has been expanding, and the MACD line continues to trend higher, confirming a strong bullish technical bias. Key support levels have held firm, reinforcing the positive trend seen on the daily timeframe.
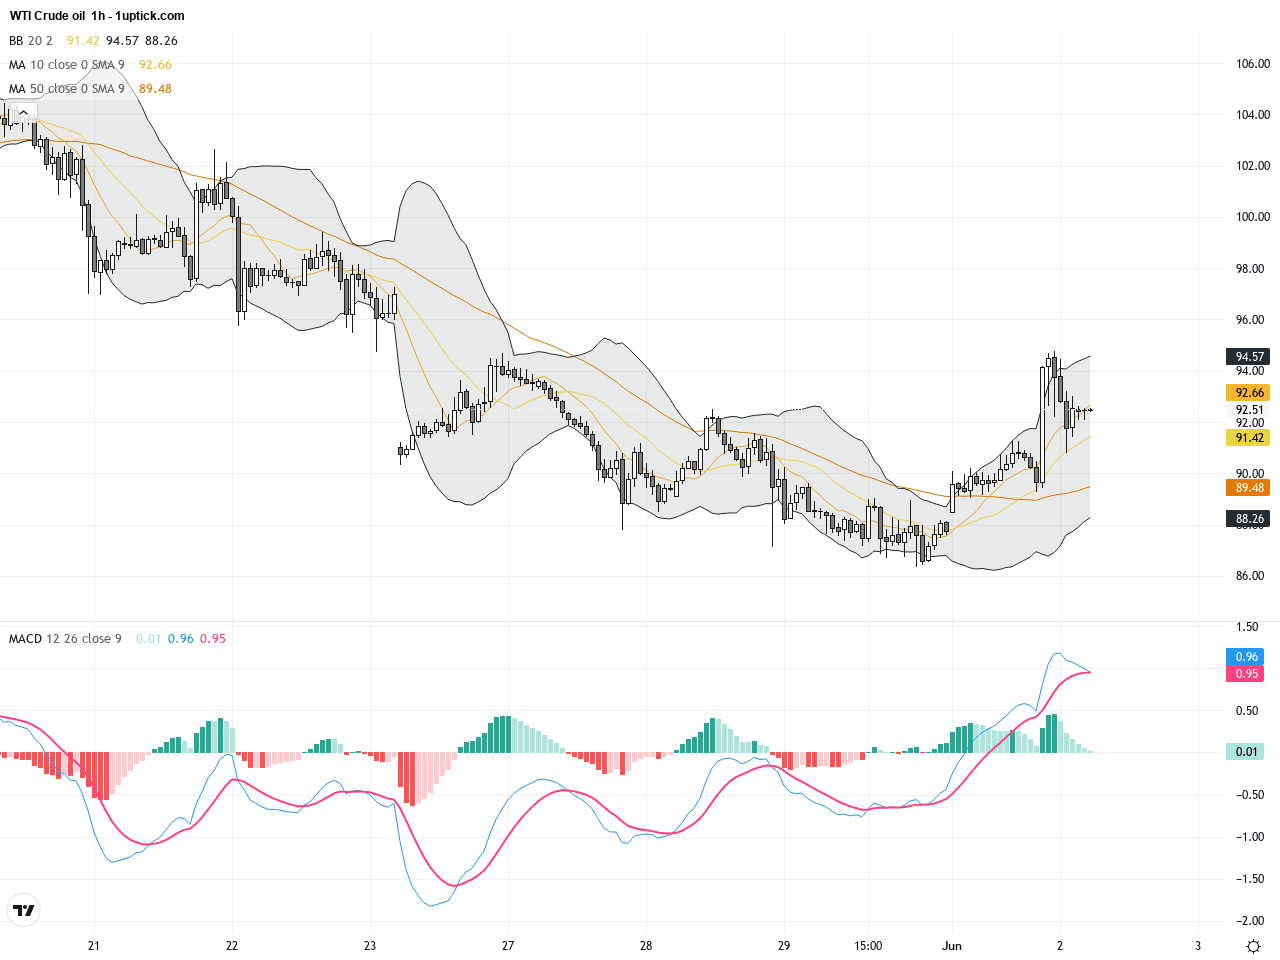
The hourly chart over the past 3-5 days reflects heightened volatility due to Middle East geopolitical events. A notable hammer candlestick formed near key support, signaling strong short-term buying interest. The Bollinger Bands have tightened, indicating a potential breakout soon. The MACD recently showed a bullish crossover on this timeframe, enhancing momentum. After breaking above the recent hourly high around $93, price briefly pulled back but quickly rebounded, suggesting a continued short-term upward move with some expected intraday fluctuations.
Technical Trend: WTI Crude Oil is currently in a decisively bullish trend, supported by strong short- and medium-term momentum, with increasing volatility driven by supply fears and geopolitical risks.
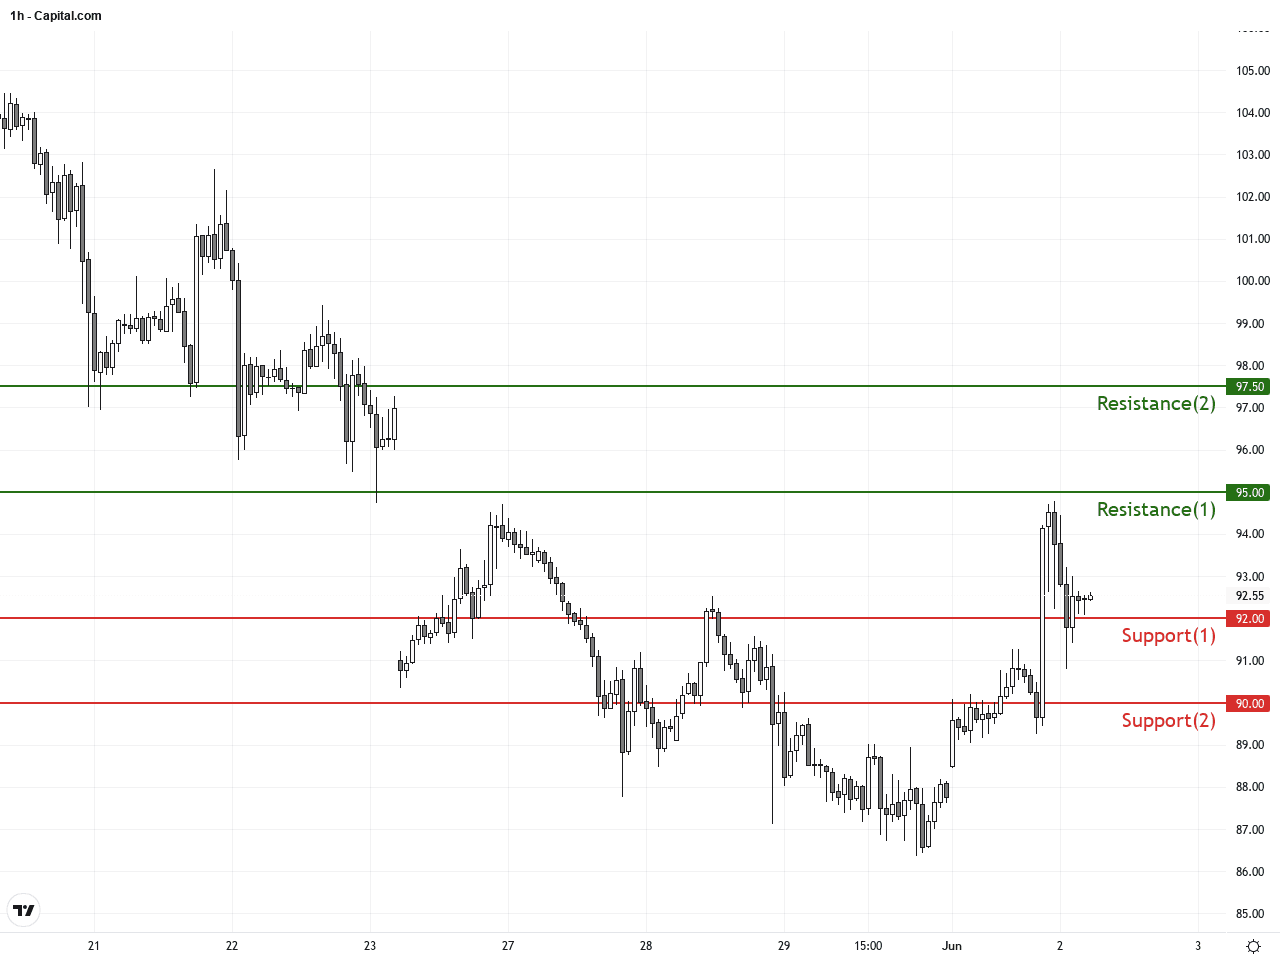
WTI Crude Oil has decisively broken through multiple resistance levels, confirming a strong bullish trend with robust momentum. Indicators such as MACD and Bollinger Bands support a continued move higher. The recent hammer candlestick on the hourly chart signals aggressive short-term buying. If prices hold above $92, a test of $95 resistance is likely. However, a pullback to $90 support could signal a short-term correction or consolidation phase. Investors should watch for divergence or weakening momentum as potential early signs of reversal.There are no significant or directly relevant economic events scheduled today that would impact WTI Crude Oil prices. Thus, price movements are expected to remain primarily driven by geopolitical developments and supply concerns from the Middle East crisis. Traders should keep monitoring news on US-Iran relations and potential Strait of Hormuz disruptions for timely market insights.
Resistance & Support
The above financial market data, quotes, charts, statistics, exchange rates, news, research, analysis, buy or sell ratings, financial education, and other information are for reference only. Before making any trades based on this information, you should consult independent professional advice to verify pricing data or obtain more detailed market information. 1uptick.com should not be regarded as soliciting any subscriber or visitor to execute any trade. You are solely responsible for all of your own trading decisions.