


 |
| Gold V.1.3.1 signal Telegram Channel (English) |
AUDUSD: Key Technical & Fundamental Analysis Highlights the 0.70 Resistance Level, June 24, 2026
2026-06-24 @ 06:01
Over the past 24 to 48 hours, the AUD/USD pair showed subtle adjustments, closing yesterday at 0.6917 with marginal gains and limited volatility. Market participants are reassessing the Federal Reserve’s rate path alongside the global economic growth outlook, which has been the main driver behind recent price movements.
According to the latest market news, the US dollar gained strength due to the Fed’s persistent hawkish stance and robust employment data, placing pressure on the Australian dollar. While easing tensions in the Middle East provided brief support, overall risk appetite remained subdued, limiting AUD performance. Moreover, Australian inflation came in softer than expected, reducing expectations for further RBA rate hikes, creating a clear divergence from the Fed’s approach. This interest rate differential has driven capital flows that kept AUD/USD hovering around the 0.69 level.
For the average investor, this means the AUD/USD exchange rate has stayed relatively stable recently, reflecting uncertainty in the global economy and monetary policy divergence impacting market psychology. Those considering investments should closely watch upcoming inflation releases and central bank meetings from both Australia and the US, as these will more directly shape currency moves and risk sentiment going forward.

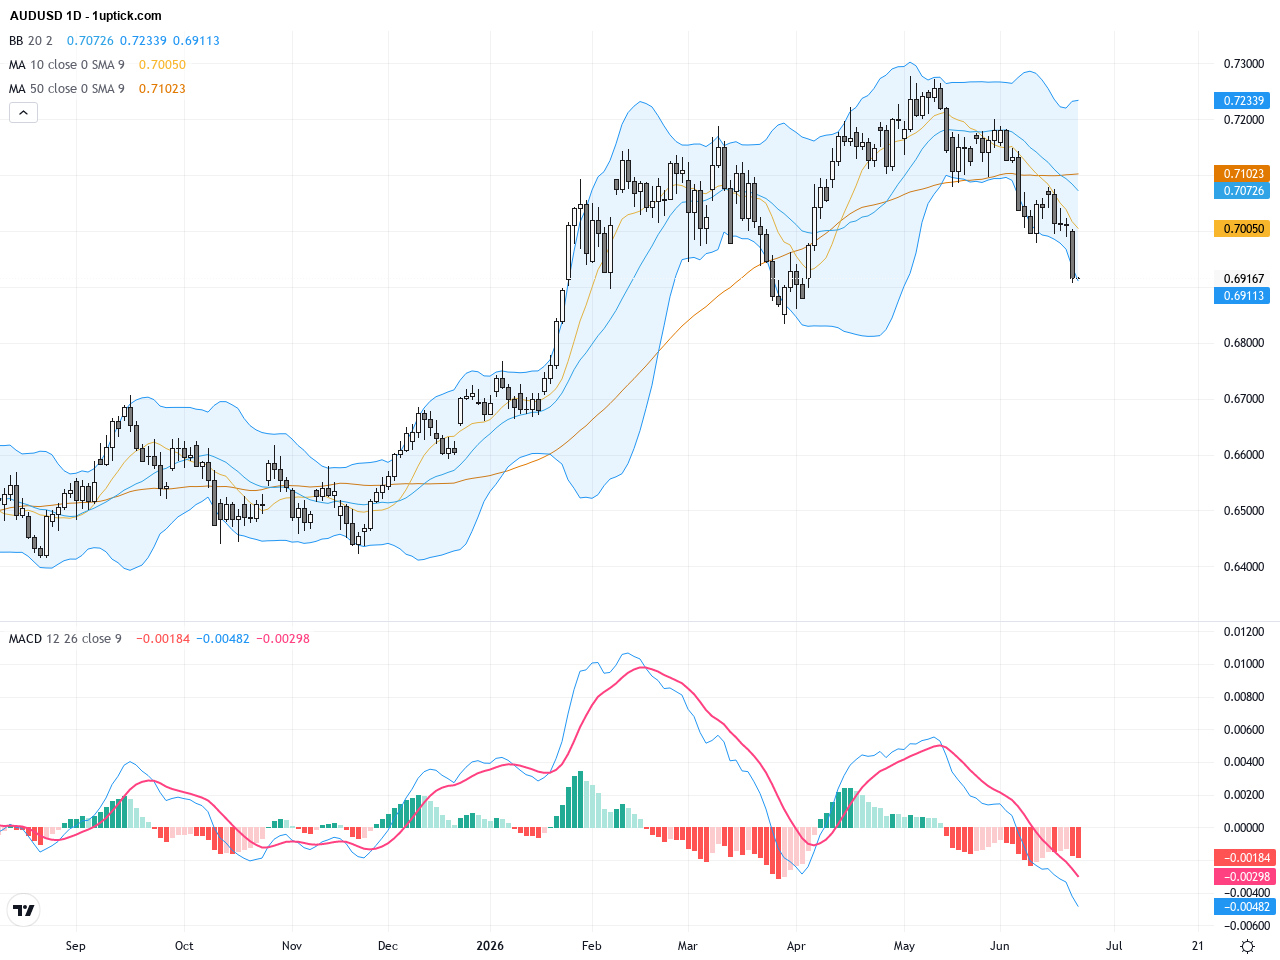
The daily chart shows AUDUSD steadily rising from the year’s low but facing resistance near the 0.70 level where multiple small reversal signals have appeared. The 50-day moving average sits near 0.7134, and the RSI indicates a short-term consolidation phase. MACD remains positive but momentum is slowing down, while Bollinger Bands are tightening, signaling increased volatility ahead. Overall, the longer-term bullish trend remains intact, but short-term resistance is apparent and support near 0.69 needs to hold.
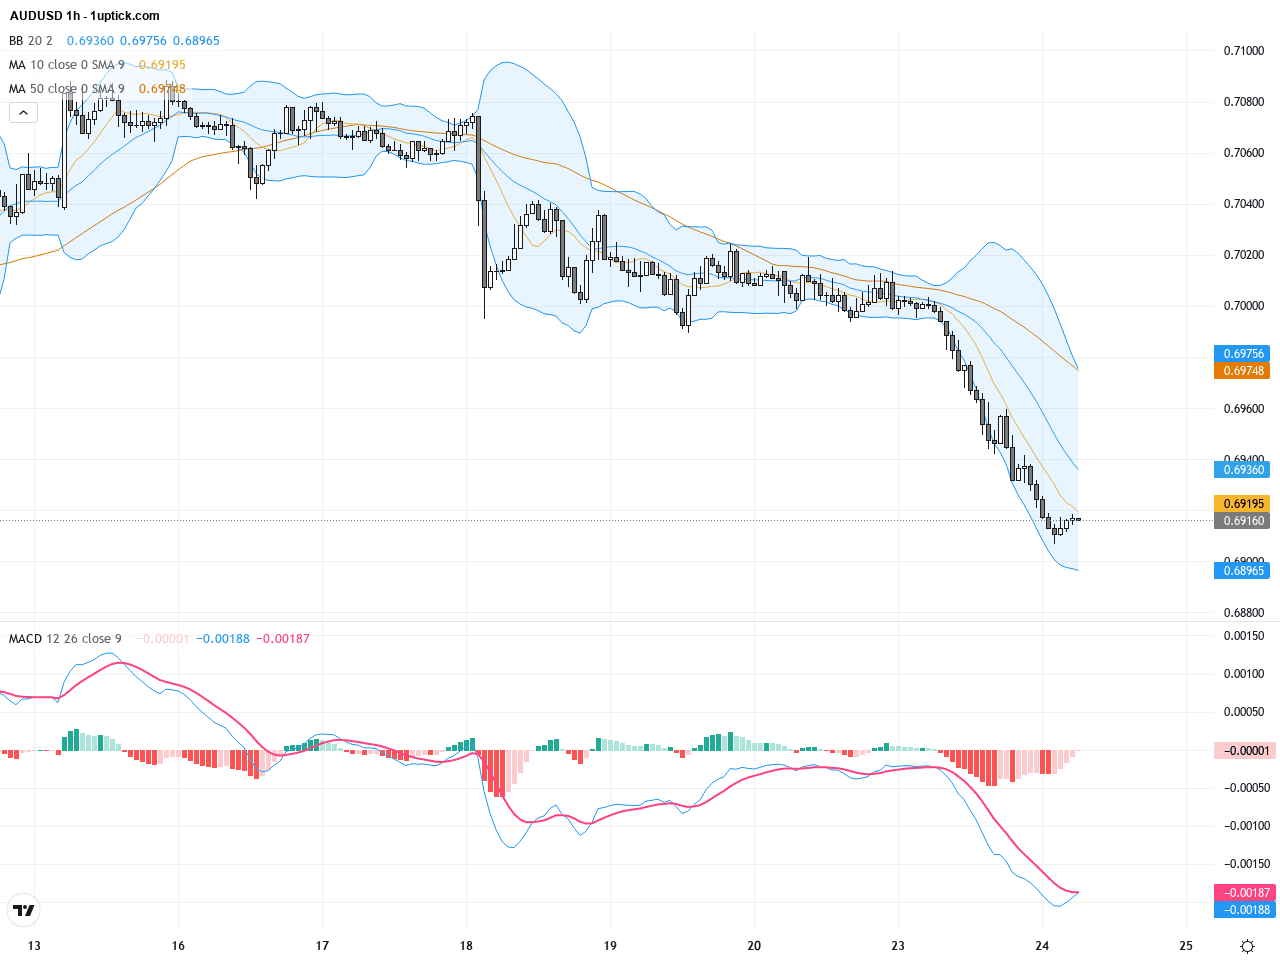
In the last 3-5 days on the hourly chart, AUDUSD has been testing the 0.6910 to 0.6960 range repeatedly with multiple upper wicks indicating increasing selling pressure. The MACD shows a slight bearish crossover, momentum weakening, and the Bollinger Bands contracting around the moving average near 0.6925. The appearance of a bearish engulfing candle suggests potential downside pressure within the next 24 hours, signaling traders to be cautious of a short-term pullback.
Technical Trend: AUDUSD currently exhibits a cautious oscillating pattern with a dominant long-term bullish trend facing near-term downside pressure and consolidation phases. The trend can be described as ‘cautiously bearish’ over short timeframes within an overall consolidating structure.
Technical indicators reveal that while the daily chart maintains a bullish longer-term view, AUDUSD shows signs of short-term topping and consolidation. The hourly chart confirms weakening momentum with bearish MACD crossover and a bearish engulfing candle signaling downside risk. Failure to hold the critical 0.69 support could prompt stronger corrections, yet holding above it might allow for a resumption of the uptrend. Traders should watch closely for key level breakouts in conjunction with fundamental cues.Today’s economic calendar includes several manufacturing and services PMI releases across countries like Japan and Europe but no major Australian or U.S. inflation or employment data directly relevant to AUDUSD. The minor U.S. PMI figures forecast slightly better readings, offering modest support to the U.S. dollar. Overall, there are no significant or direct economic events expected to substantially impact AUDUSD today. Market attention remains on upcoming Australian and U.S. macro releases.
Resistance & Support

The above financial market data, quotes, charts, statistics, exchange rates, news, research, analysis, buy or sell ratings, financial education, and other information are for reference only. Before making any trades based on this information, you should consult independent professional advice to verify pricing data or obtain more detailed market information. 1uptick.com should not be regarded as soliciting any subscriber or visitor to execute any trade. You are solely responsible for all of your own trading decisions.