


 |
| Gold V.1.3.1 signal Telegram Channel (English) |

AUDUSD: Approaching 200-Day EMA as Key Support Amid Mixed Economic Data, June 26, 2026
2026-06-26 @ 06:01
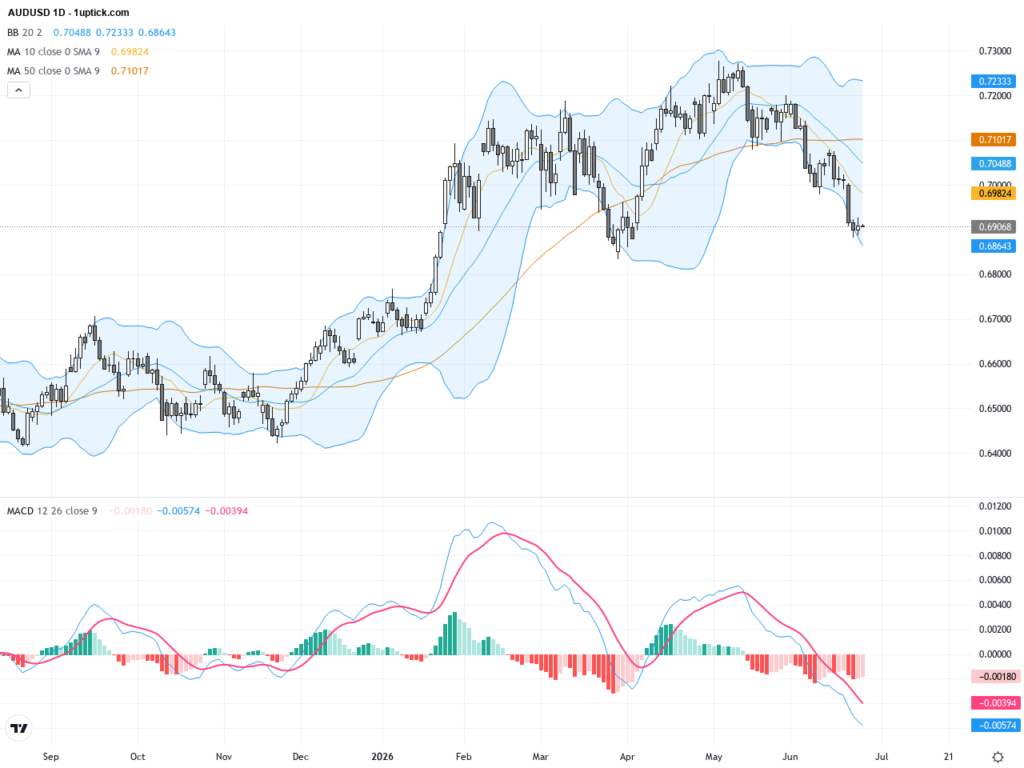
Over the past 24 to 48 hours, the Australian Dollar against the US Dollar (AUD/USD) has seen a notable decline, dropping from yesterday’s closing price of 0.69068 to an 11-week low near 0.6899. Market news highlights the US Personal Consumption Expenditures (PCE) data as a key focus, with investors closely watching core price increases that support the US dollar and indirectly weigh on the Australian dollar.
Following the Australian Consumer Price Index (CPI) release yesterday afternoon, mixed inflation figures put additional pressure on the AUD. Coupled with a flight to safety in global markets, this led to aggressive selling of the Australian dollar, which retreated to the 200-day moving average level at around 0.69133. This volatility reflects investors’ preference for USD as a safe-haven amid ongoing global economic uncertainties.
For the average investor, this means the AUD is experiencing heightened volatility driven by global inflation trends and monetary policy expectations. With US economic resilience and potential tightening in monetary policy, the AUD faces short-term headwinds. Close attention is warranted on upcoming Reserve Bank of Australia (RBA) decisions and US economic data releases to gauge the AUD’s outlook.
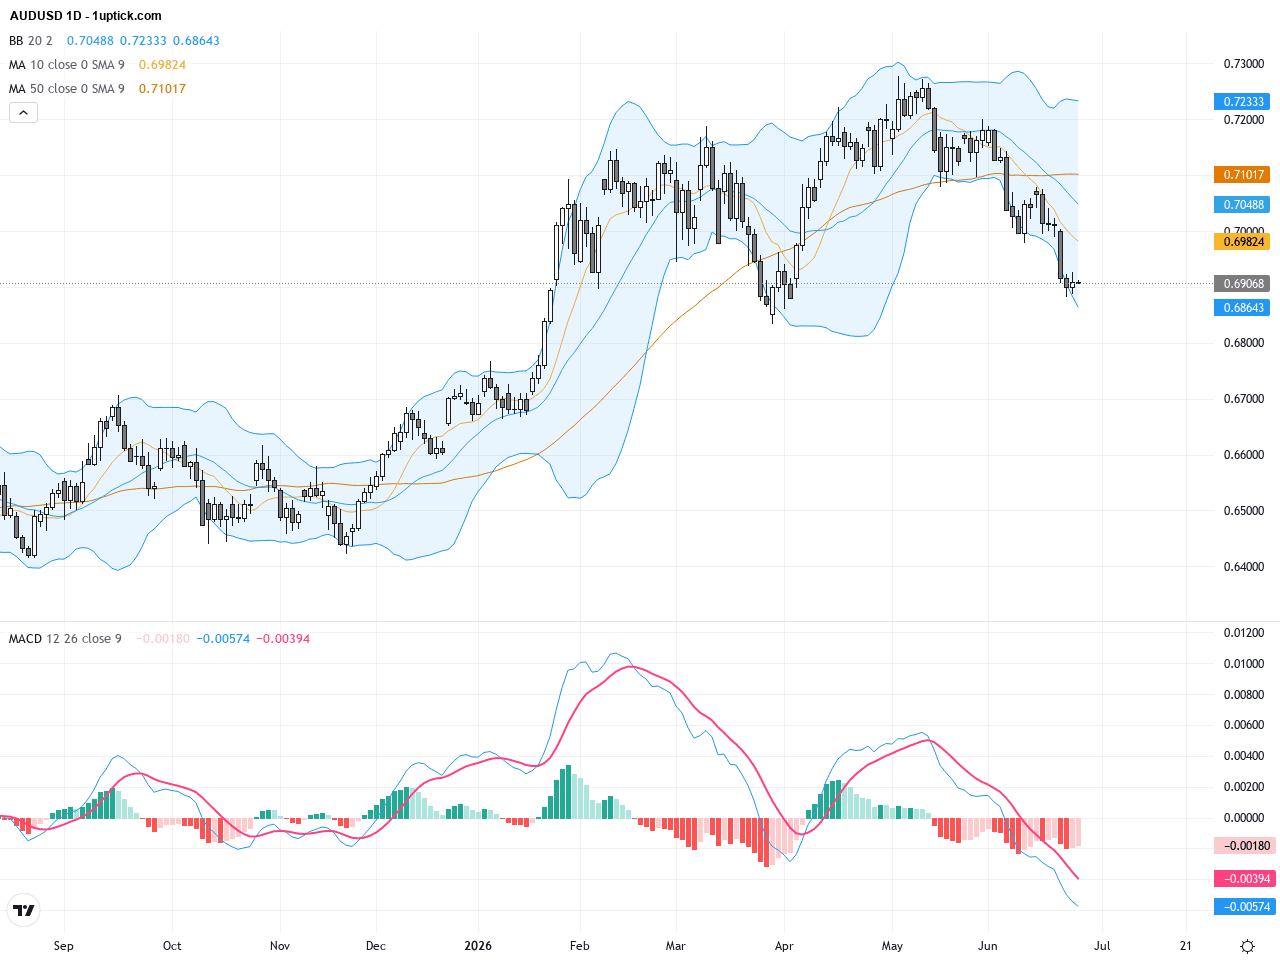
The daily chart shows a clear downtrend from recent highs near 0.715, with AUDUSD breaking below several short-term moving averages and finding tentative support around the 200-day EMA (circa 0.69133). Bollinger Bands are contracting, indicating reduced volatility, while the MACD histogram reveals expanding bearish momentum, reinforcing a medium to longer-term downtrend. The price has shifted from a mild uptrend into a corrective phase, highlighting the importance of watching the 200-day EMA for potential rebound or continuation.
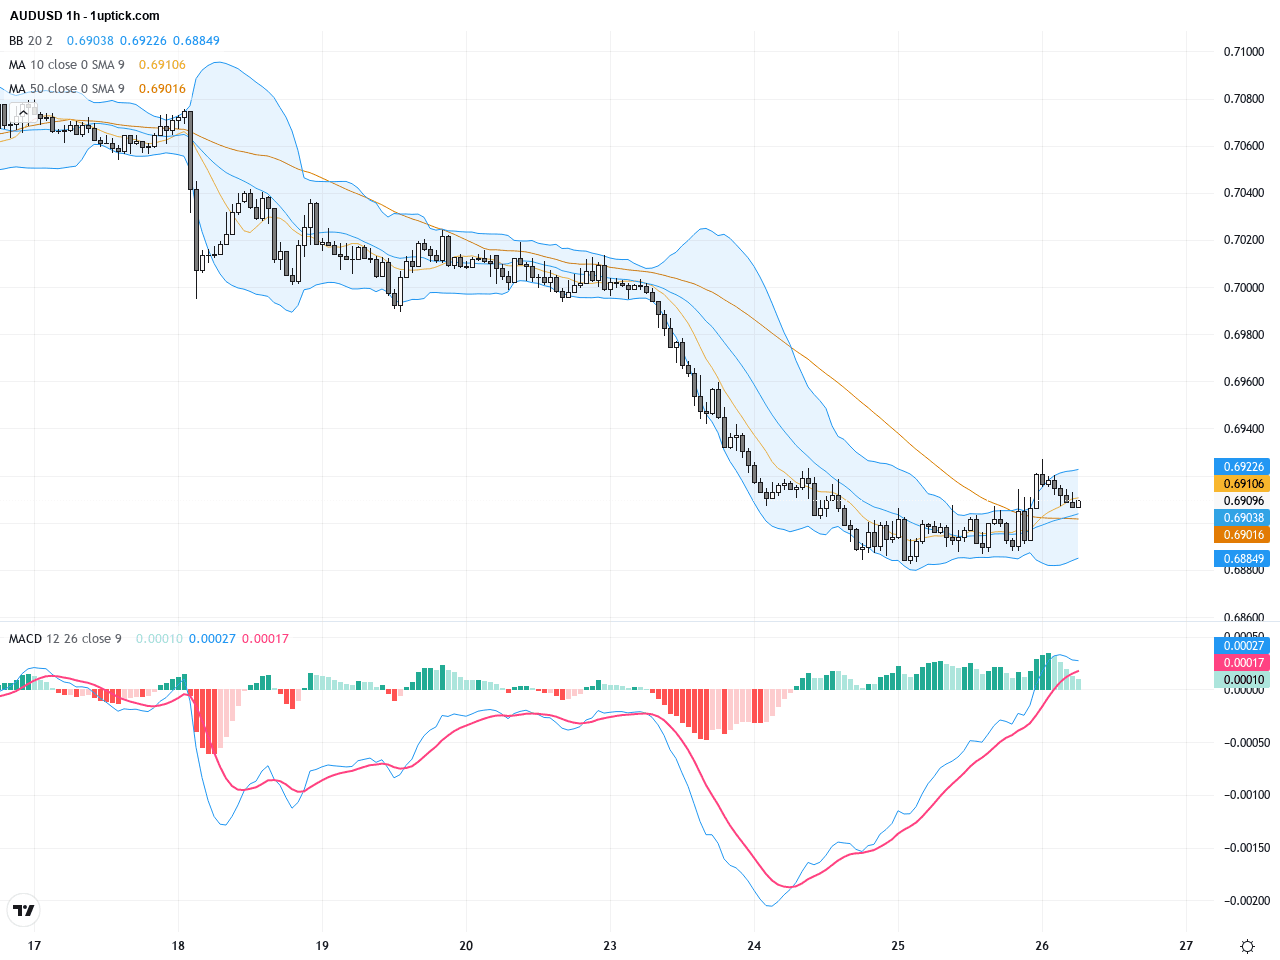
On the hourly chart covering the past 4-5 days, the pair experienced sharp declines down to a low of 0.6899. The MACD has formed a bearish crossover and RSI is trending lower, while price action hovers near the lower Bollinger Band, signaling increased selling pressure in the short term. Recent candlesticks form bearish engulfing shapes, hinting at continuation potential, though traders should watch for signs of reversal closely.
Technical Trend: The current trend is cautiously bearish with short-term downside pressure evident. Momentum favors the sellers, though overall direction requires confirmation from key supports and upcoming data releases.
Key technical insights include the 200-day EMA acting as critical support—its breach may accelerate downside momentum. The hourly MACD bearish crossover with RSI decline signals weakening short-term momentum. The dominant chart pattern is a corrective descending flag, hinting at further downside once confirmed. Close monitoring of the 200-day EMA and upcoming US inflation data will be vital for anticipating AUDUSD’s direction. Traders should prepare for potential volatility around these levels.Today’s economic calendar features Australian unemployment rate and employment change data released at 03:30 GMT+1, both exceeding forecasts and likely providing some support to AUD. Meanwhile, key US PCE inflation data at 14:30 GMT+1 remain elevated, reinforcing USD strength and potentially pressuring AUDUSD lower. Overall, Australian labor market strength could mitigate some losses but USD inflation resilience remains the dominant influence on price action today.
Resistance & Support

The above financial market data, quotes, charts, statistics, exchange rates, news, research, analysis, buy or sell ratings, financial education, and other information are for reference only. Before making any trades based on this information, you should consult independent professional advice to verify pricing data or obtain more detailed market information. 1uptick.com should not be regarded as soliciting any subscriber or visitor to execute any trade. You are solely responsible for all of your own trading decisions.