








 |
| Gold V.1.3.1 signal Telegram Channel (English) |
USDJPY Breaks 40-Year High Amid BoJ Watch and Key Technical Resistance, July 29, 2026
2026-07-29 @ 11:01
Over the past 24 to 48 hours, the USD/JPY remained just below 164.00, close to the highest level seen since 1986, showing slight fluctuations around yesterday’s close of 163.814. Despite a sharp drop of nearly 11% in Korean equities and a nearly 4% decline in Japan’s Nikkei 225, the Japanese yen remained surprisingly weak, unaffected by regional equity crashes.
The US Dollar Index is squeezed between converging trend lines, indicating short-term pressure on the dollar, yet the yen stays at multi-decade lows driven largely by the approaching Bank of Japan monetary policy meeting. The BoJ is widely expected to keep rates unchanged on July 31, reinforcing its gradual rate hike stance and supporting continued USD strength against JPY.
Additionally, rising oil prices, heightened geopolitical tensions in the Middle East, and inflation concerns have further pressured the yen. Market watchers are also eyeing the potential repatriation of funds by Japan’s $1.8 trillion pension fund, which could impact U.S. yields and demand for the dollar, adding complexity to the currency dynamics.
In a nutshell for average investors, despite a sharp equity selloff in Asia and rising global uncertainties, the yen’s failure to recover highlights Japan’s limited policy flexibility and dovish central bank stance. This dynamic has been the key driver behind the sharp upward move in USD/JPY in recent sessions.
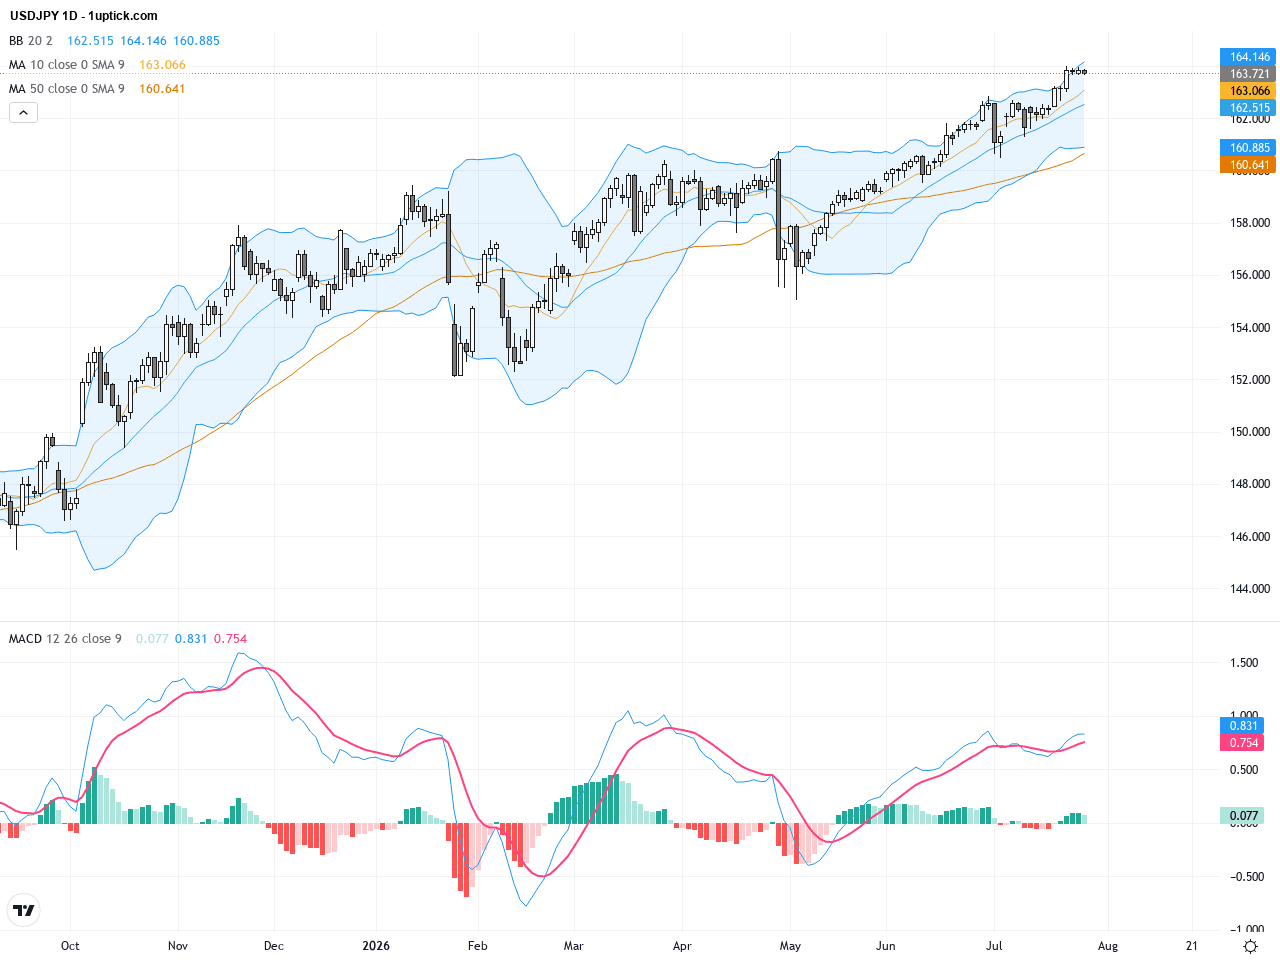
The daily chart shows USDJPY exhibiting a strong uptrend since the beginning of the year, continuously setting new historical highs. Current prices have broken through major resistance levels around the 50-day and 200-day moving averages, positioned near 161 and 158 respectively, confirming a bullish alignment. Bollinger Bands are expanding upwards, indicating increasing volatility. The MACD remains positive and showing growing histogram bars, supporting upward momentum. The long-term trend is decisively bullish with no clear signs of reversal so far.
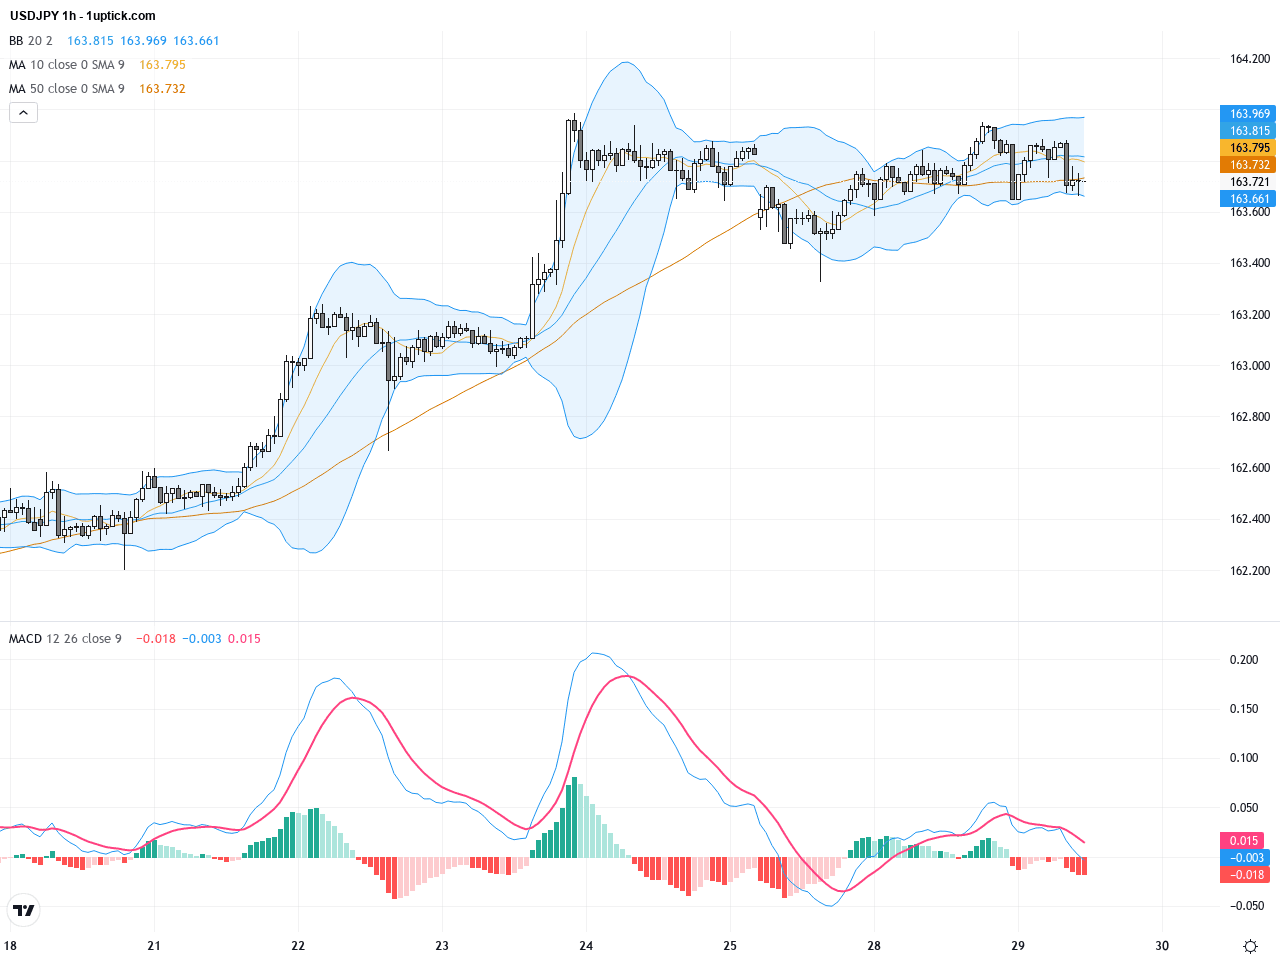
On the hourly chart over the past 3 to 5 days, USDJPY has maintained an obvious short-term rally but with increased volume and volatility recently. The 50-period moving average near 163.3 has provided solid support as prices briefly dipped before bouncing back. Bollinger Bands tightened then expanded upward, suggesting a breakout is likely. The MACD lines have crossed upwards and remain strong, indicating sustained short-term momentum. Additionally, an early inverted head and shoulders pattern is forming, potentially signaling an extension of the bullish move upon neckline breakout.
Technical Trend: Decisively Bullish
From a technical perspective, USDJPY is in a clear bullish trend. The MACD’s bullish crossover and moving average support indicate momentum is intact. The emerging inverted head and shoulders pattern is a strong reversal signal that could attract further buying pressure once the neckline resistance breaks. The recent Doji candlestick at the lower bounds shows temporary indecision, but overall, the technical bias remains firmly bullish. Potential market interventions or shifts in global risk sentiment are the main risks to watch in the near term.Today’s economic calendar in GMT+1 time zone presents no directly significant events that will immediately impact USDJPY. Attention remains on the US Federal Reserve’s FOMC interest rate decision at 20:00 followed by the press conference at 20:30, which could sway USDJPY volatility. The Bank of Japan is scheduled to announce its policy decisions on July 31, which will be closely watched by market participants. Traders should remain alert to any surprises from the Fed announcements as they can influence Dollar strength against the Yen.
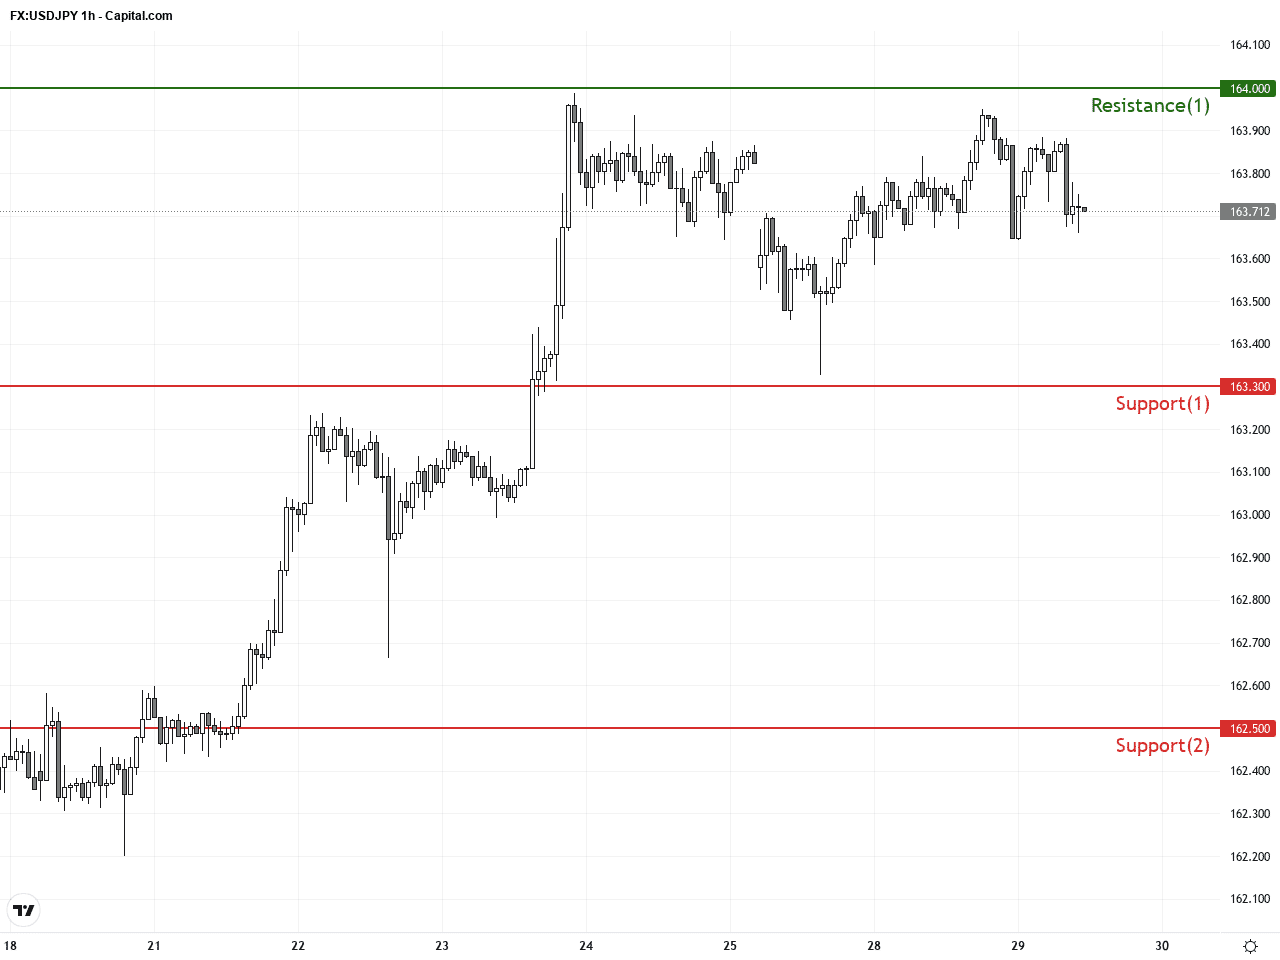
Resistance & Support
The above financial market data, quotes, charts, statistics, exchange rates, news, research, analysis, buy or sell ratings, financial education, and other information are for reference only. Before making any trades based on this information, you should consult independent professional advice to verify pricing data or obtain more detailed market information. 1uptick.com should not be regarded as soliciting any subscriber or visitor to execute any trade. You are solely responsible for all of your own trading decisions.