








 |
| Gold V.1.3.1 signal Telegram Channel (English) |
EURUSD: Breakout in Key Technical Pattern Sparks Bullish Trading Outlook, August 3, 2026
2026-08-03 @ 09:01
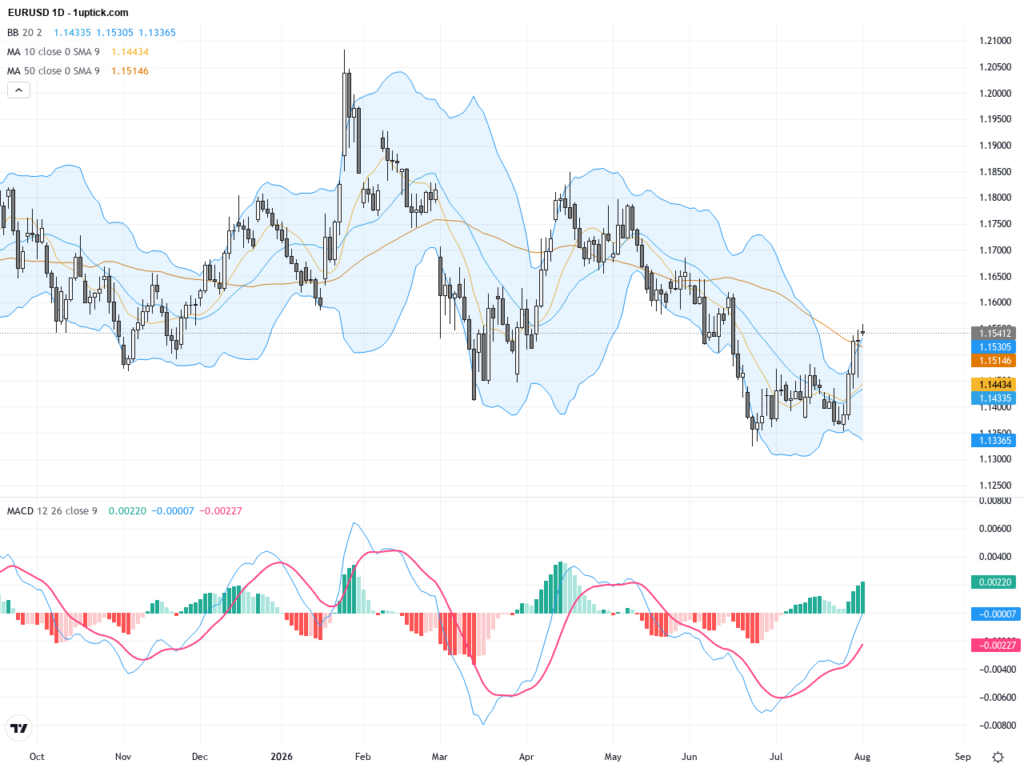
Over the past 24 to 48 hours, the EUR/USD (Euro to US Dollar) market has shown notable volatility. The pair closed yesterday at 1.1542, marking an increase from the previous day. The recent surge came after the Federal Reserve’s policy meeting led to a rapid dollar selloff, pushing the euro decisively above the 1.1500 level, closing near 1.1530 at the end of July.
This upward momentum was mainly driven by a softer Fed stance and growing market caution over the pace of future US interest rate hikes. Meanwhile, escalating geopolitical tensions in the Middle East raised concerns over energy supply security, driving crude oil prices higher and benefiting risk-sensitive currencies like the euro. Investors felt that the dollar was pressured by policy uncertainty and geopolitical risks, allowing the euro to outperform expectations.
For the average investor, this EUR/USD movement illustrates how global macroeconomic and geopolitical factors directly impact forex markets. Simply put, when the dollar weakens due to policy shifts and risk factors, holding the euro can offer relative gains. Recent market behavior underscores the importance of monitoring Fed signals and global political developments to understand and seize currency price fluctuations.
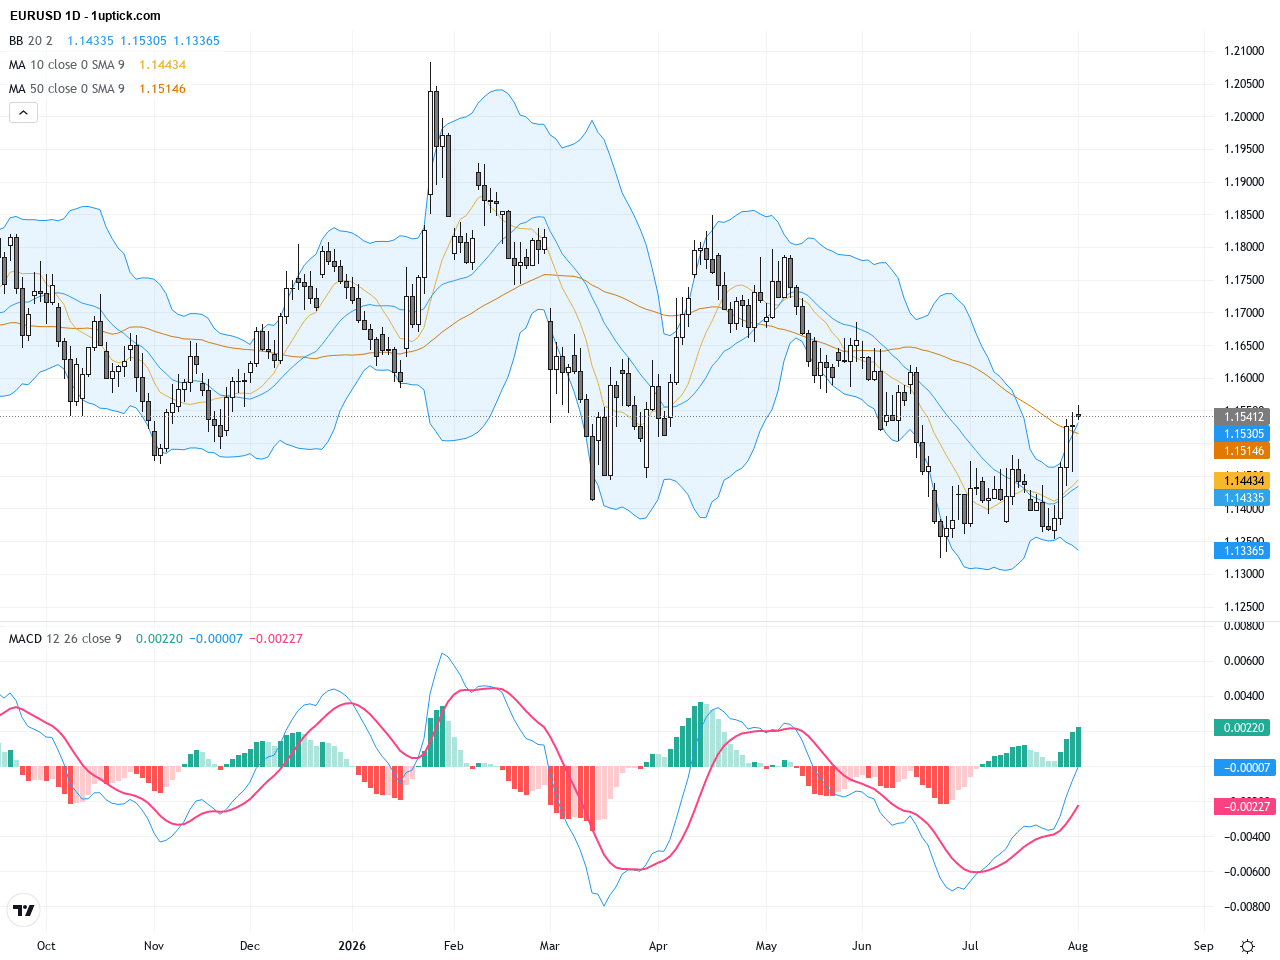
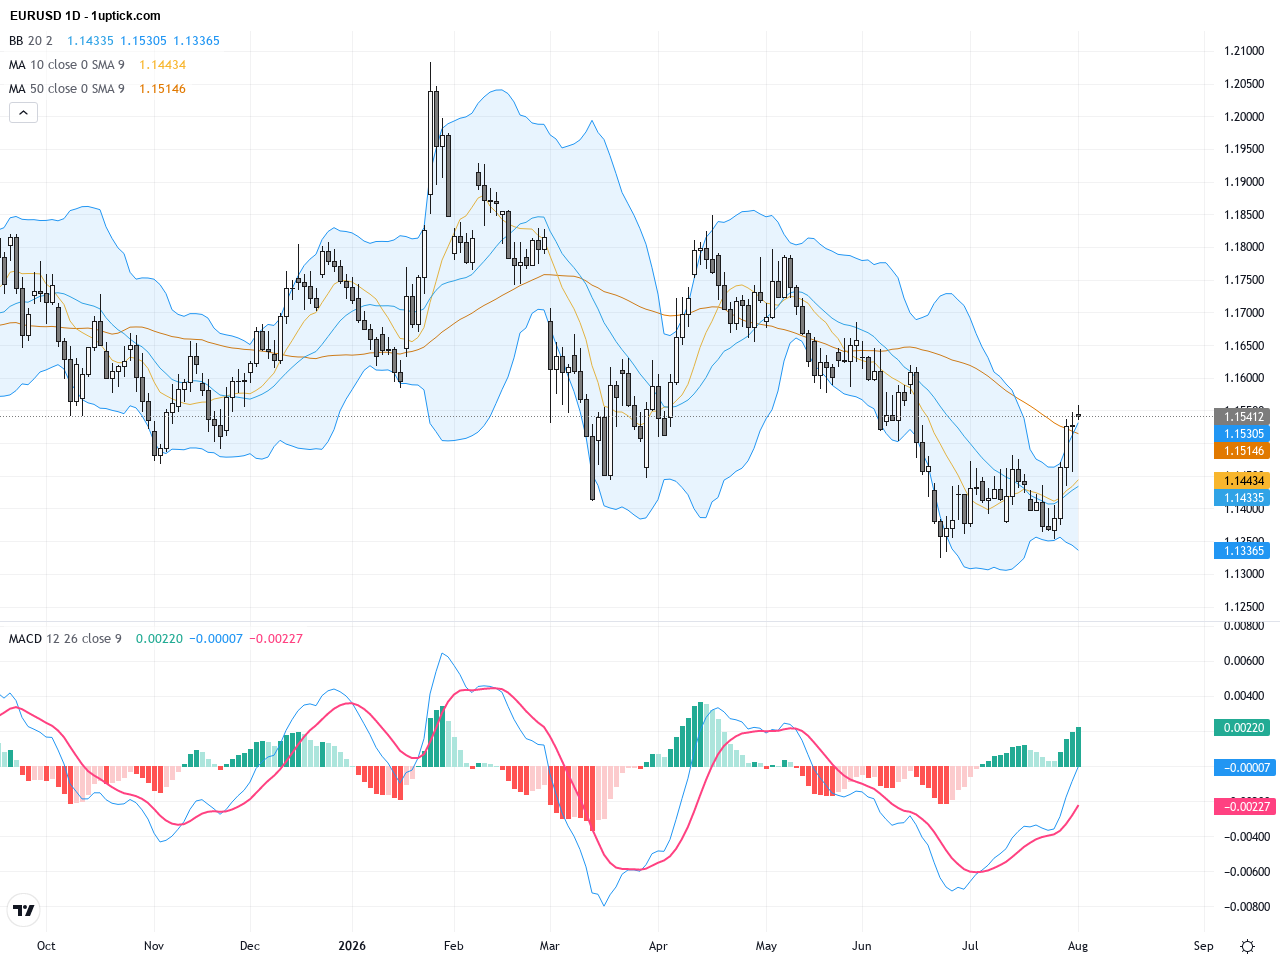
The daily chart shows a strong rebound trend for EURUSD starting near 1.145, with prices currently above the 50-day moving average (~1.15) but still below the 200-day moving average (~1.16), indicating medium-term resistance. The Bollinger Bands are widening with price near the upper band, while MACD shows a bullish crossover signaling momentum strength. Overall, the daily chart supports a medium-term uptrend, with a key resistance test around 1.160 likely to define the next directional move.
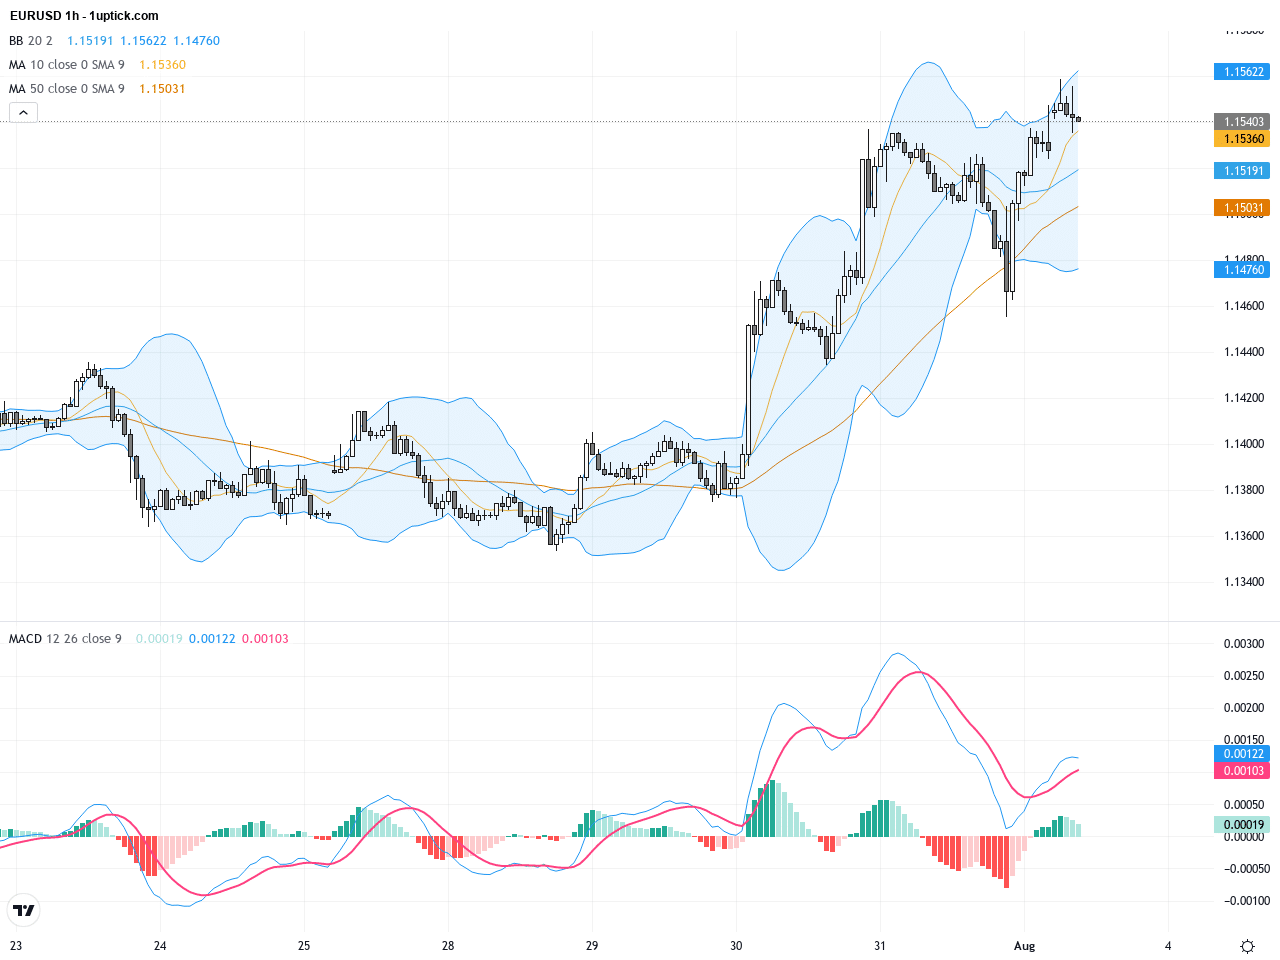
On the hourly chart, EURUSD has experienced notable oscillations within the 1.1535 to 1.1559 range over the past 3-5 days. Bollinger Bands are tightening with price bouncing off the middle band repeatedly. MACD has a bullish crossover with expanding histogram bars and RSI hovers near 60, indicating short-term momentum favoring buyers. A potential ascending triangle pattern is forming, which began developing recently; a breakout above this pattern’s upper boundary would signal the start of a new upward wave.
Technical Trend: The current trend is cautiously bullish, characterized by increased short-term volatility within an overall upward trajectory, as the market tests major resistance and support levels.
Technically, the current ascending triangle formation combined with a daily MACD bullish crossover suggests solid bullish momentum for EURUSD, although the 200-day moving average near 1.16 remains a significant resistance. Recent candle patterns, including a hammer with a long lower wick on a pullback, indicate buyer presence and support. Trading volume remains elevated, with MACD histogram expanding, confirming strong momentum. Traders should monitor the interaction between upside breakouts and pullback supports for high-probability entry points.Today’s economic calendar shows several key European manufacturing PMI releases between 09:50 and 10:30 CET, including Germany, France, the Eurozone, and the UK, directly impacting EURUSD. Better-than-expected PMI data would likely strengthen the euro against the dollar, while weaker data could trigger short-term pullbacks. Japanese, Australian, and US data released today carry less relevance for EURUSD until tomorrow’s US ISM manufacturing and construction spending reports, where market reaction may hinge on these figures.
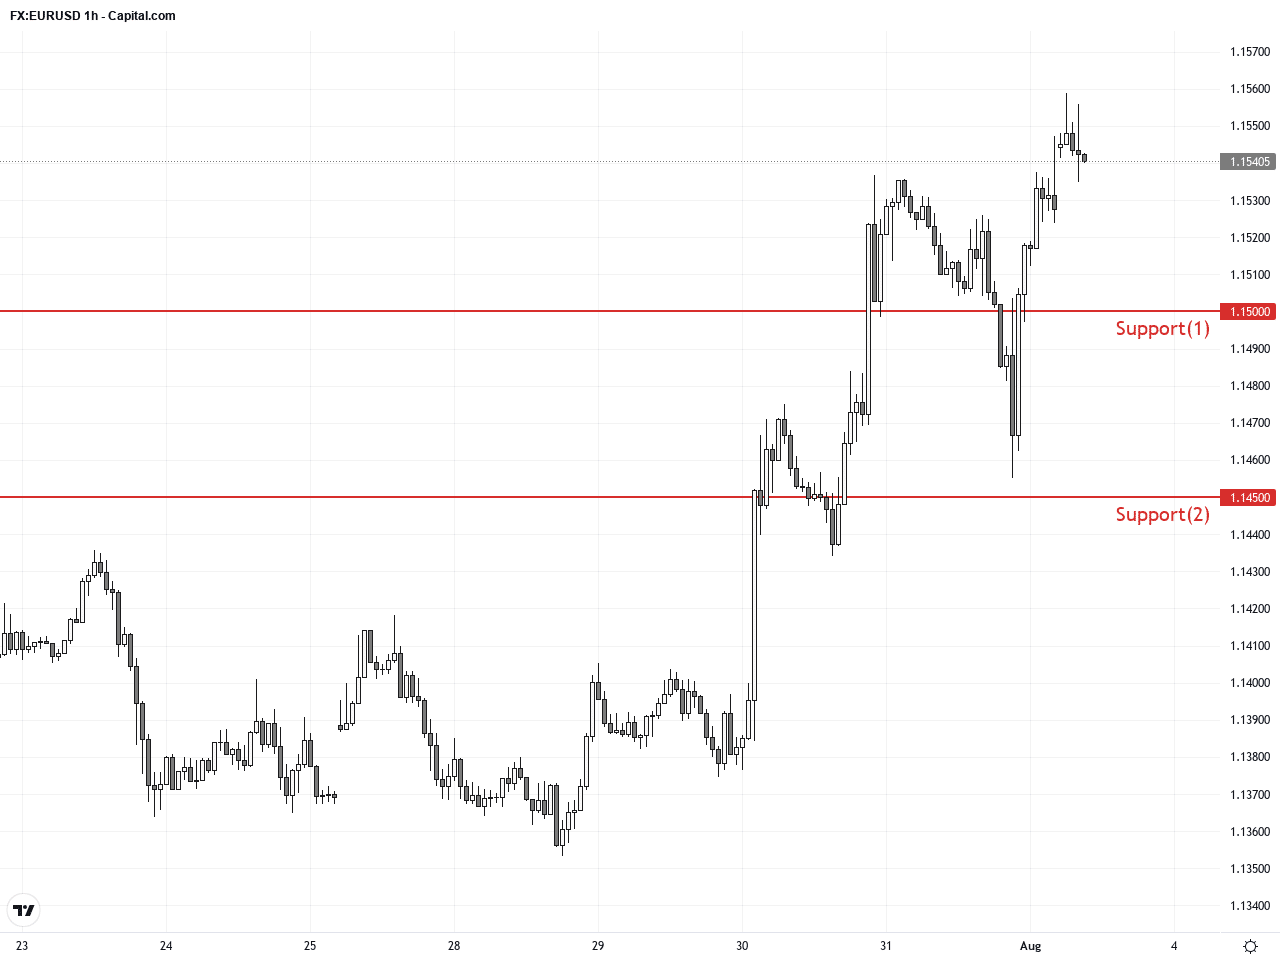
Resistance & Support
The above financial market data, quotes, charts, statistics, exchange rates, news, research, analysis, buy or sell ratings, financial education, and other information are for reference only. Before making any trades based on this information, you should consult independent professional advice to verify pricing data or obtain more detailed market information. 1uptick.com should not be regarded as soliciting any subscriber or visitor to execute any trade. You are solely responsible for all of your own trading decisions.