









 |
| Gold V.1.3.1 signal Telegram Channel (English) |
AUDUSD: Inflation Sticky and Hawkish RBA Comments Shape Trading Outlook Amid Key Technical Levels, September 2, 2026
2026-09-02 @ 06:01
Over the past 24 to 48 hours, the Australian dollar against the US dollar (AUD/USD) demonstrated robust volatility, closing at 0.7144, nearing recent highs. The market dynamics during this period were primarily driven by Australia’s persistently sticky inflation data and hawkish remarks from former Federal Reserve official Kevin Warsh at the Jackson Hole symposium. These factors collectively boosted the Australian dollar’s appeal as market expectations for future RBA rate hikes quickly adjusted.
Recent reports highlighted that the unexpected resilience in Australian inflation forced major banks like Goldman Sachs to revise upwards their forecast for the RBA interest rate path, now expecting a hike to 4.60% in November. This development strengthened the impetus behind AUD/USD’s rally, signaling a more optimistic market sentiment. For the average investor, this means the Australian dollar is increasingly supported by both solid economic data and tighter monetary policy expectations, making it an asset to watch in the short term.
Simultaneously, a surprise move by the US Treasury somewhat weakened the US dollar, pushing AUD/USD to three-month highs. Overall, the last two days saw the Aussie rise steadily on the back of international capital flows and policy anticipation, though traders should remain cautious about possible corrective pressures ahead.
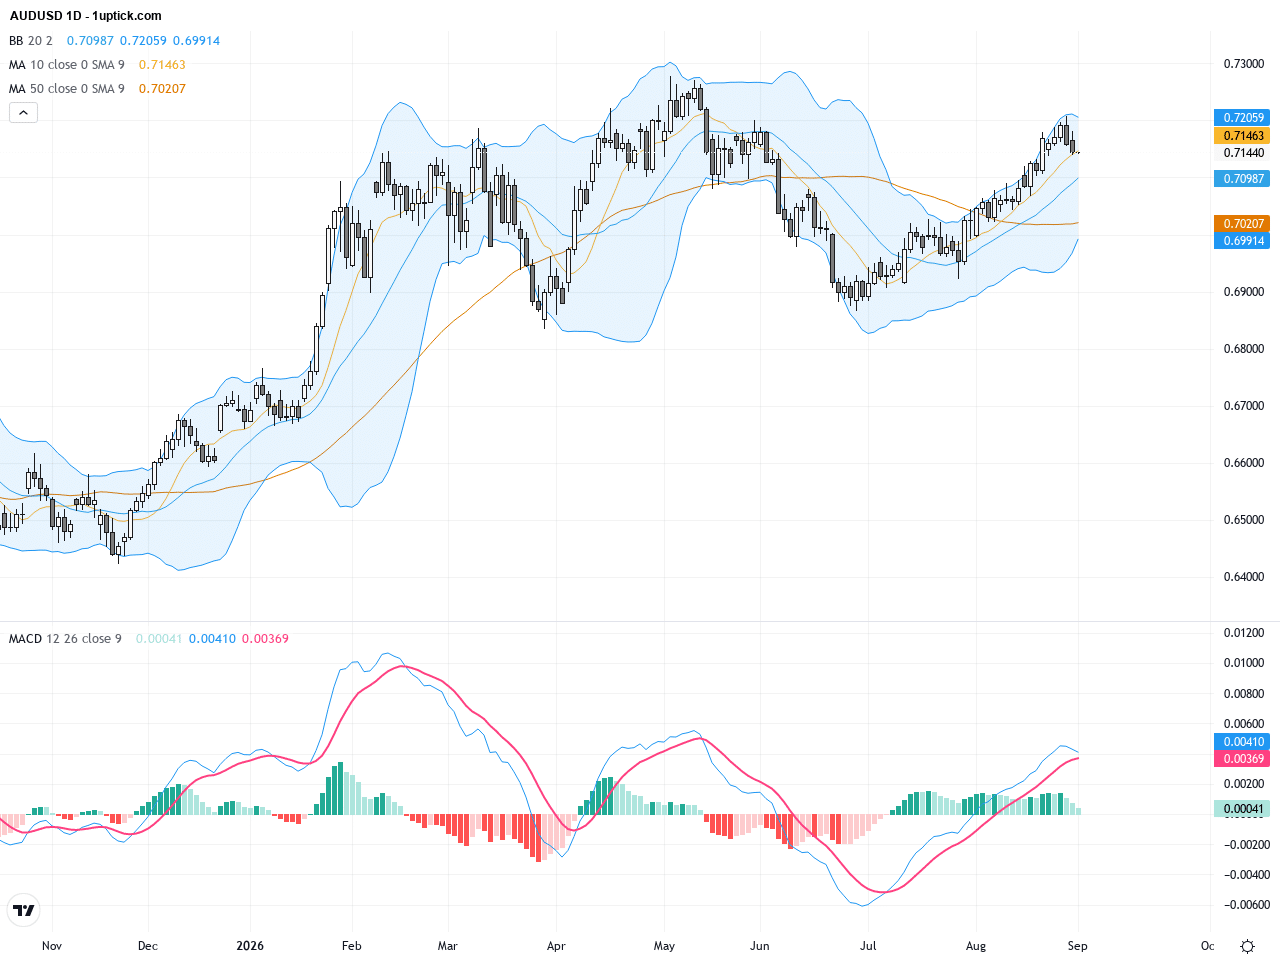
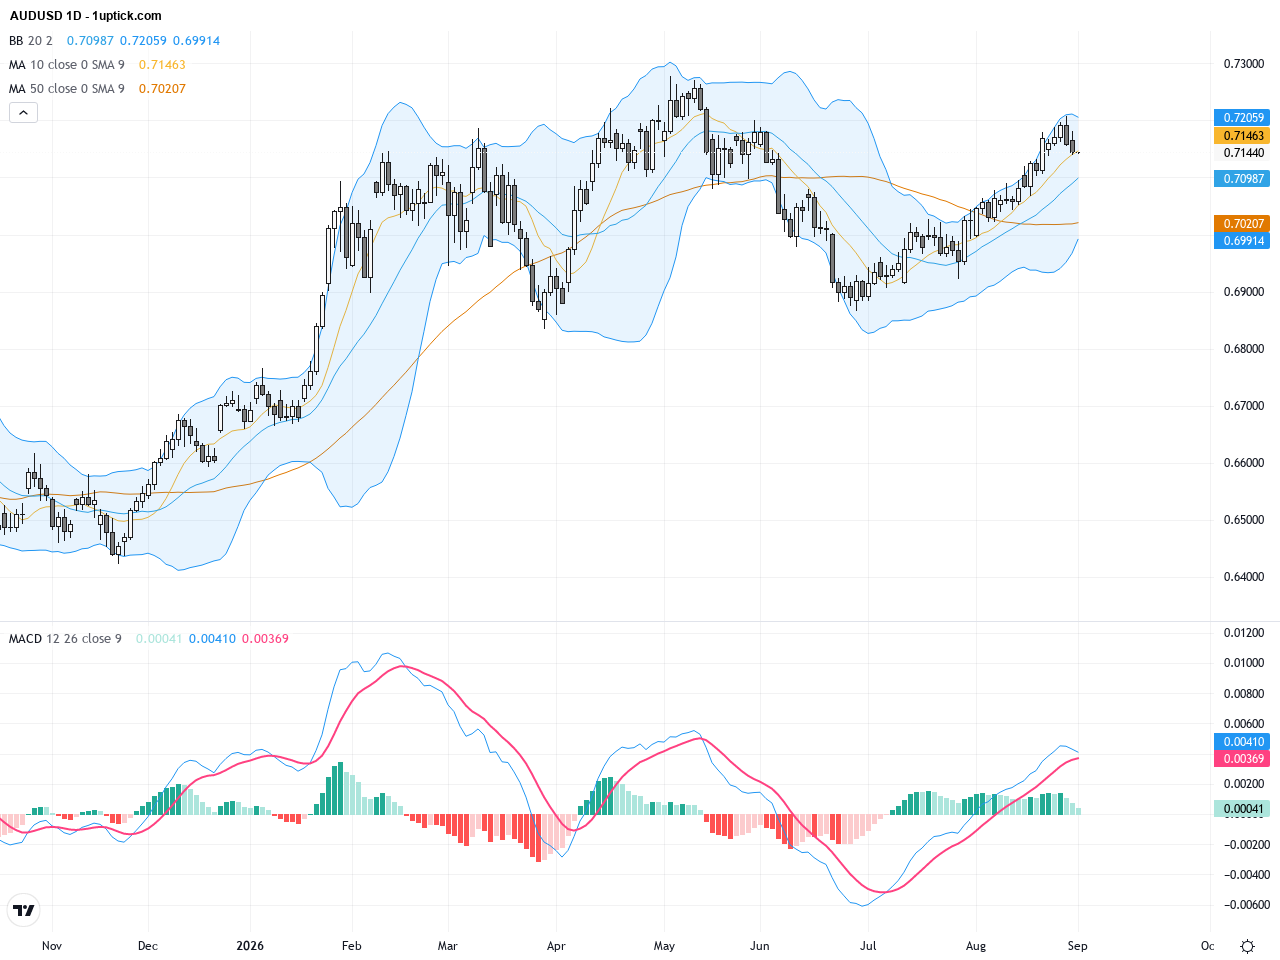
The daily chart shows AUDUSD in a steady uptrend over the past two months, with recent consolidation near 0.7185. Bollinger Bands are narrowing, indicating lower volatility; the MACD remains in positive territory but slowing, suggesting waning momentum. Price sits above both the 50-day and 200-day moving averages, confirming the long-term bullish trend. Overall, the daily chart reflects an ascending channel with potential short-term pullbacks testing support levels.
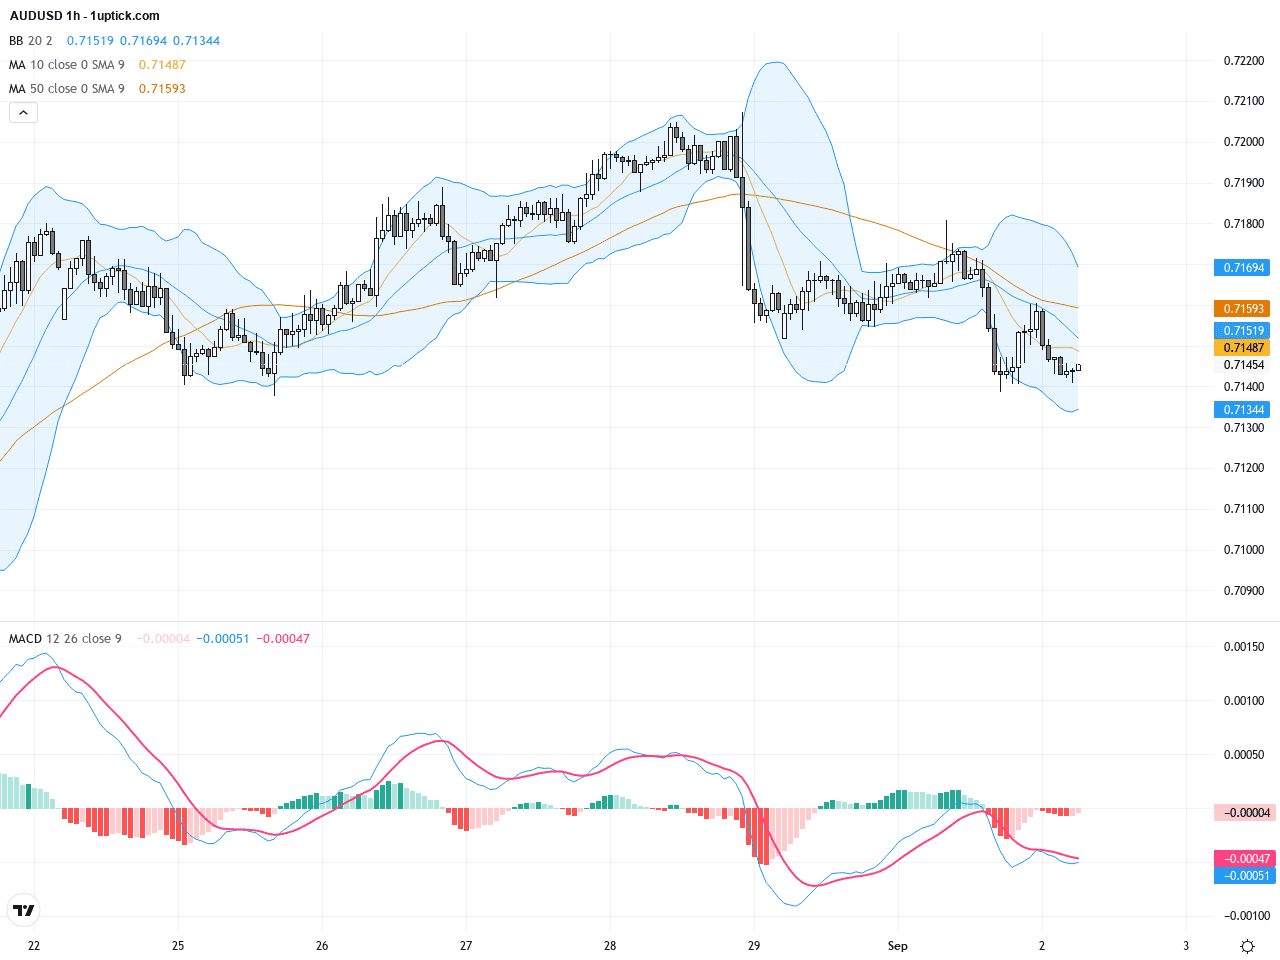
The hourly chart over the last five days reveals a consolidating triangle pattern, with MACD recently crossing bearish and RSI hovering near midpoint, signaling a short-term weakening of bullish momentum. Bollinger Bands compressing suggest an impending breakout. Price briefly broke above the short-term moving average but failed to sustain gains. Declining volume highlights caution, and traders should watch for breakout direction in coming sessions.
Technical Trend: Cautiously bullish: long-term uptrend intact on daily but short-term momentum is consolidating; watch for breakout confirmation.
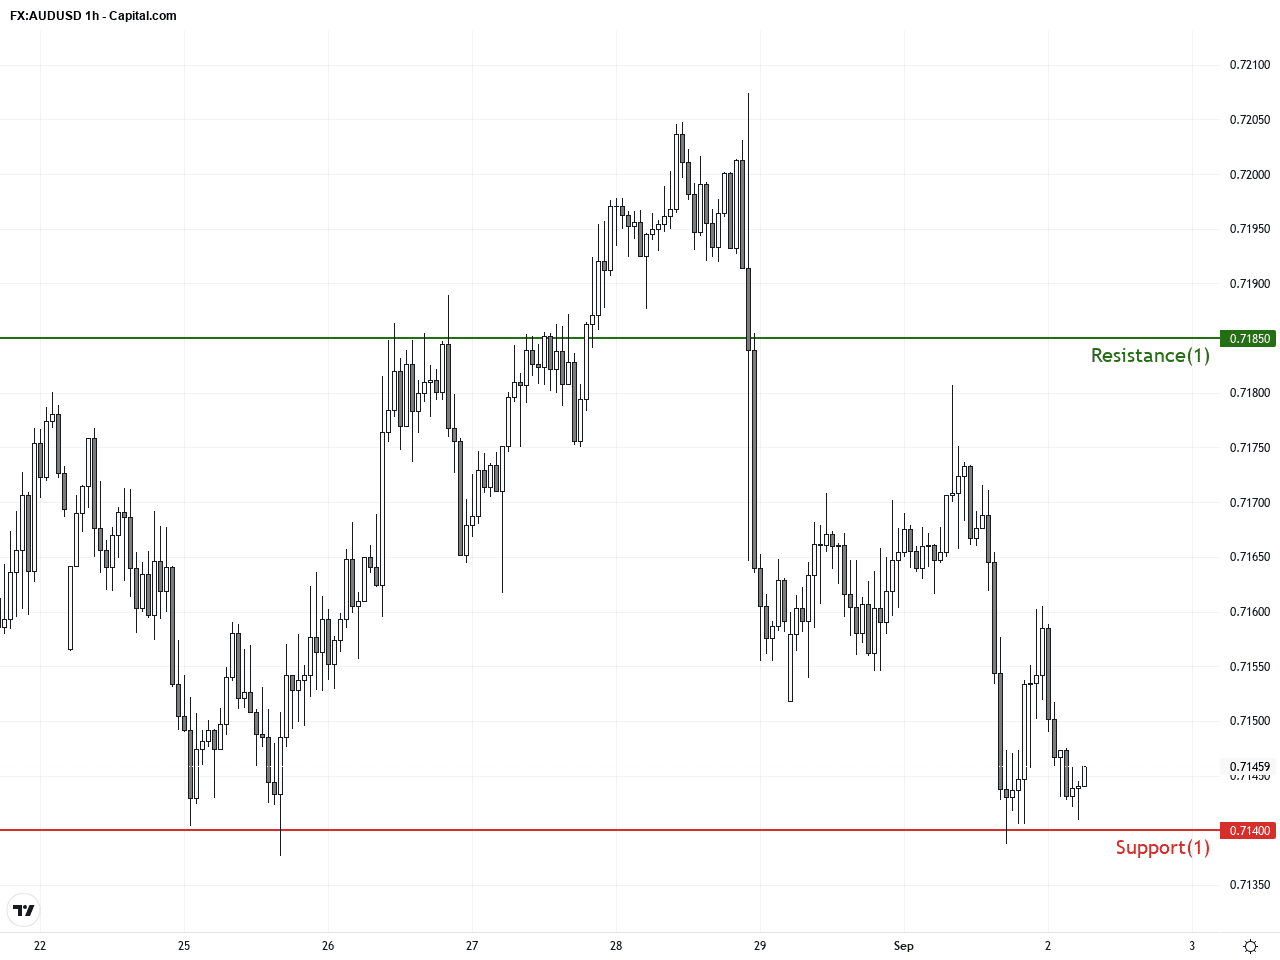
Technically, the daily MACD retains bullish bias but momentum is slowing, while the hourly MACD bearish crossover and RSI dip point to short-term correction potential. A consolidating triangle and tightening Bollinger Bands suggest an eventual significant breakout. If AUDUSD holds above daily moving averages and 0.7140 support, the next resistance at 0.7185 becomes critical. Conversely, a breach below support may test the 0.6920 zone. The underlying bullish fundamentals from inflation and rate hike expectations remain, but market volatility could increase amid global risk shifts.Today’s key economic data includes Australia’s Q2 GDP at 03:30 GMT+1, forecasted at 0.3% QoQ and 1.8% YoY; if met or bettered, this should support AUDUSD. New Zealand’s official cash rate decision and monetary policy statement at 04:00 GMT+1, with an anticipated hike to 2.75%, may also impact the pair. Other global events, such as the Bundesbank Chair speech and US durable goods data later, could create dollar price swings influencing AUDUSD indirectly. Traders should focus on these releases in context of HKT trading hours for timely risk management.
Resistance & Support
The above financial market data, quotes, charts, statistics, exchange rates, news, research, analysis, buy or sell ratings, financial education, and other information are for reference only. Before making any trades based on this information, you should consult independent professional advice to verify pricing data or obtain more detailed market information. 1uptick.com should not be regarded as soliciting any subscriber or visitor to execute any trade. You are solely responsible for all of your own trading decisions.