






 |
| Gold V.1.3.1 signal Telegram Channel (English) |
WTI Crude Oil: Geopolitical Tensions Propel Price Breakout Above Key Resistance Levels, September 1, 2026
2026-09-01 @ 06:03
Over the past 24 to 48 hours, WTI crude oil experienced significant volatility, rising from a close of $85.76 on August 31 to above $87 on September 1, marking a gain of over 2%. This upward movement was primarily triggered by the escalation of military clashes between the U.S. and Iran near the Strait of Hormuz, intensifying concerns over potential supply disruptions.
According to recent reports, the U.S. launched attacks on Iran’s Larak Island, which were met with missile and drone counterstrikes by Tehran. This military exchange rapidly pushed WTI crude prices past the $86 level, with some analysts eyeing a move beyond $90. The surge in crude futures prices directly reflects investors’ heightened vigilance about energy supply security in the Middle East.
For the average investor, the renewed U.S.-Iran conflict ignited the market like a spark, causing a sharp oil price spike within a short period. While diesel prices in Morocco saw only a slight increase, the overall oil price trend has been heavily affected by this military turmoil, signaling that the oil market remains highly uncertain. Investors should closely monitor the evolving Middle East situation, as it will continue to drive short-term price swings.
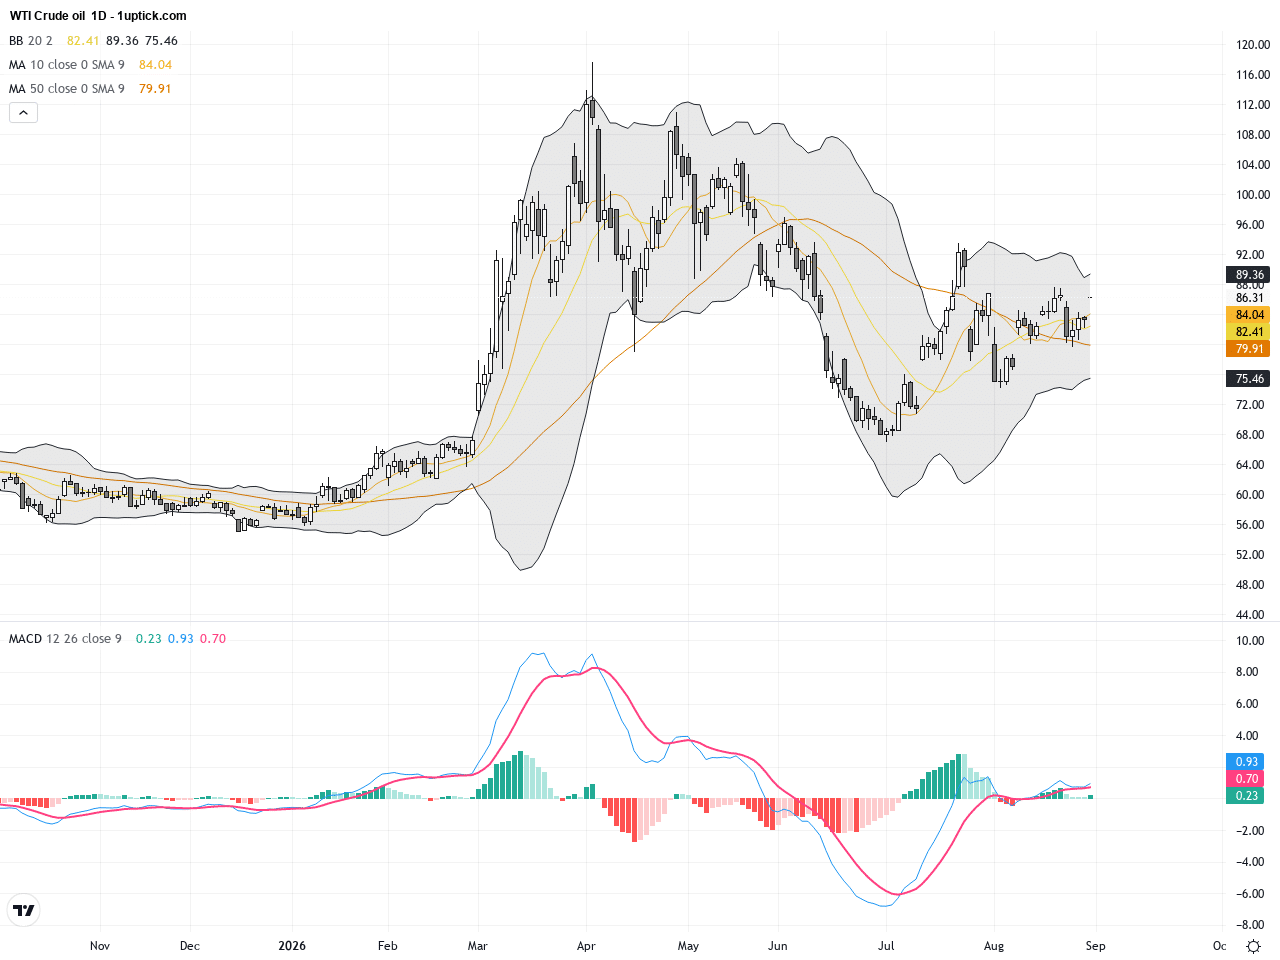
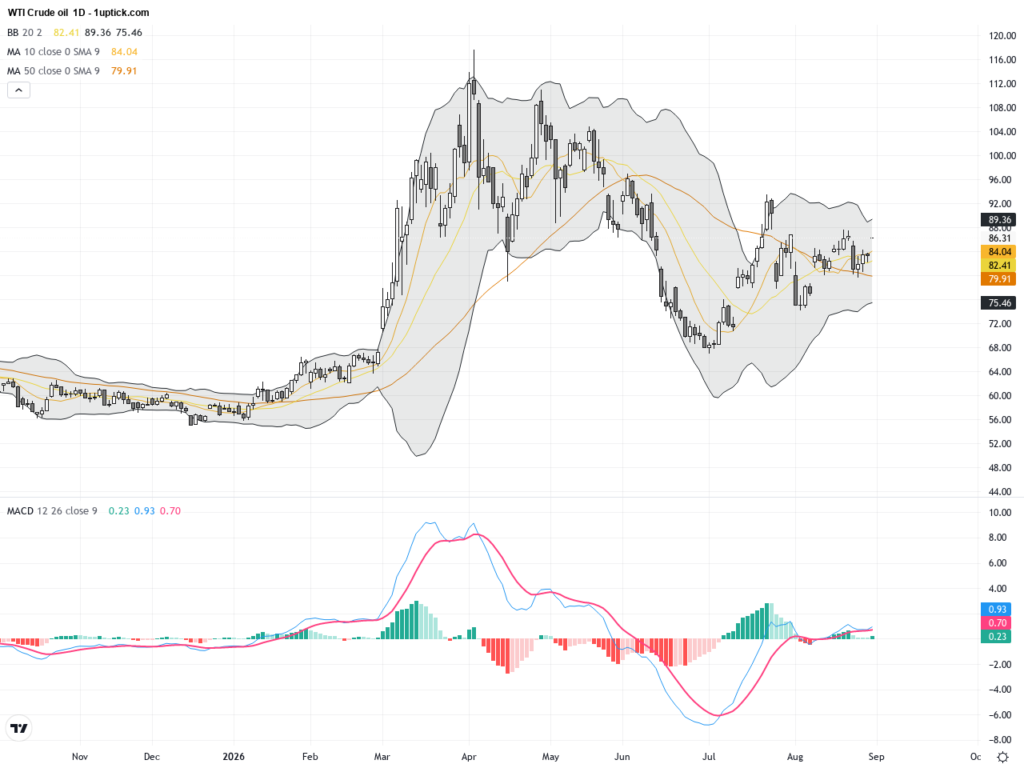
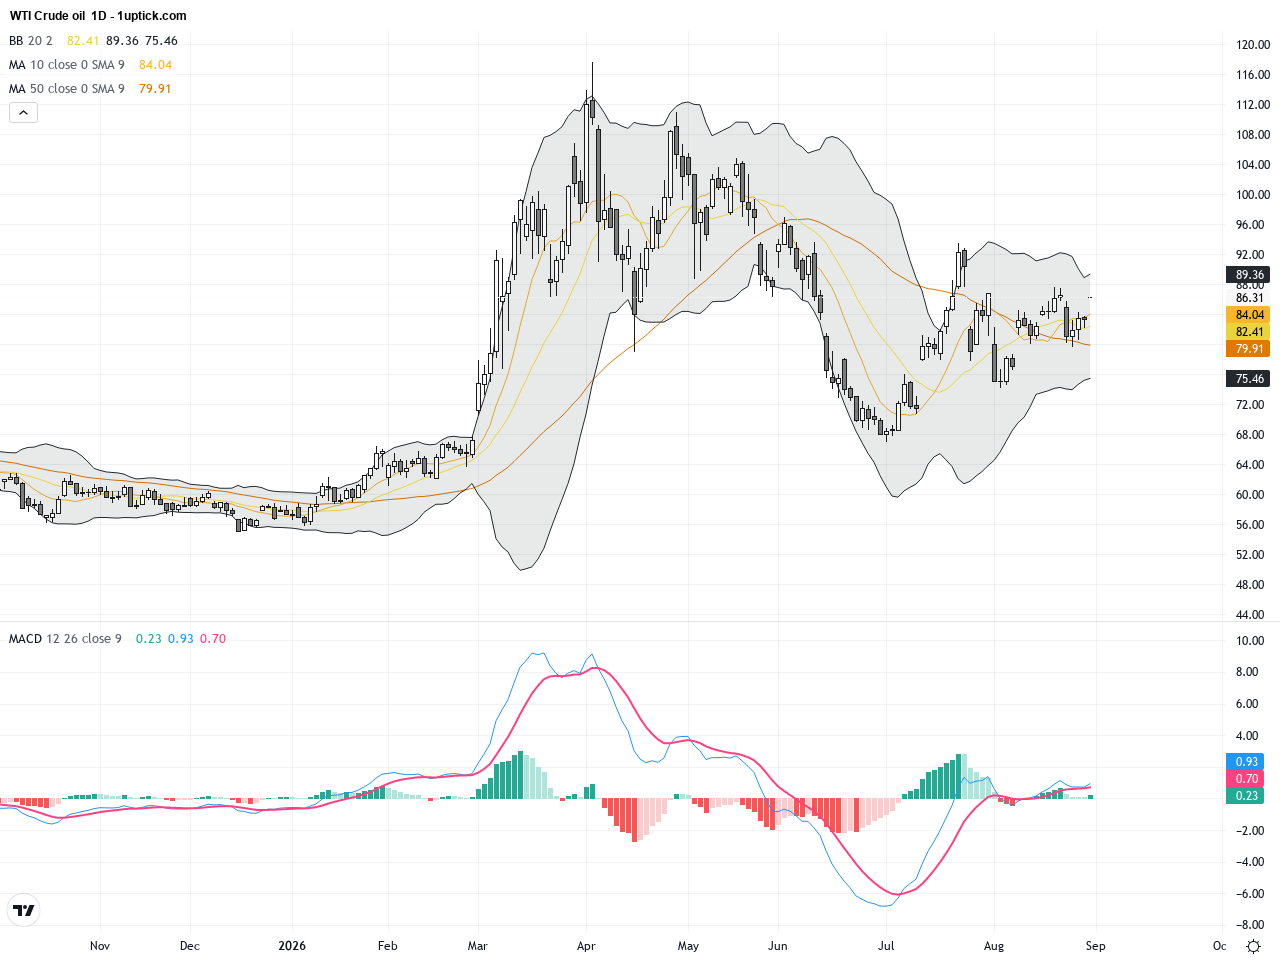
The WTI Crude Oil daily chart reveals a steady uptrend since mid-August, with prices climbing from near $82 to around $86 in the past five days, supported by rising volume. The 20-day and 50-day moving averages show a bullish alignment, underpinning the upward momentum. Bollinger Bands are expanding, indicating increased volatility with prices nearing the upper band, suggesting sustained upside pressure. The MACD indicator has recently produced a golden cross, confirming strengthening bullish momentum. Additionally, a prominent ascending flag pattern has been forming since mid-last week, signaling a potential breakout and continuation of the uptrend.
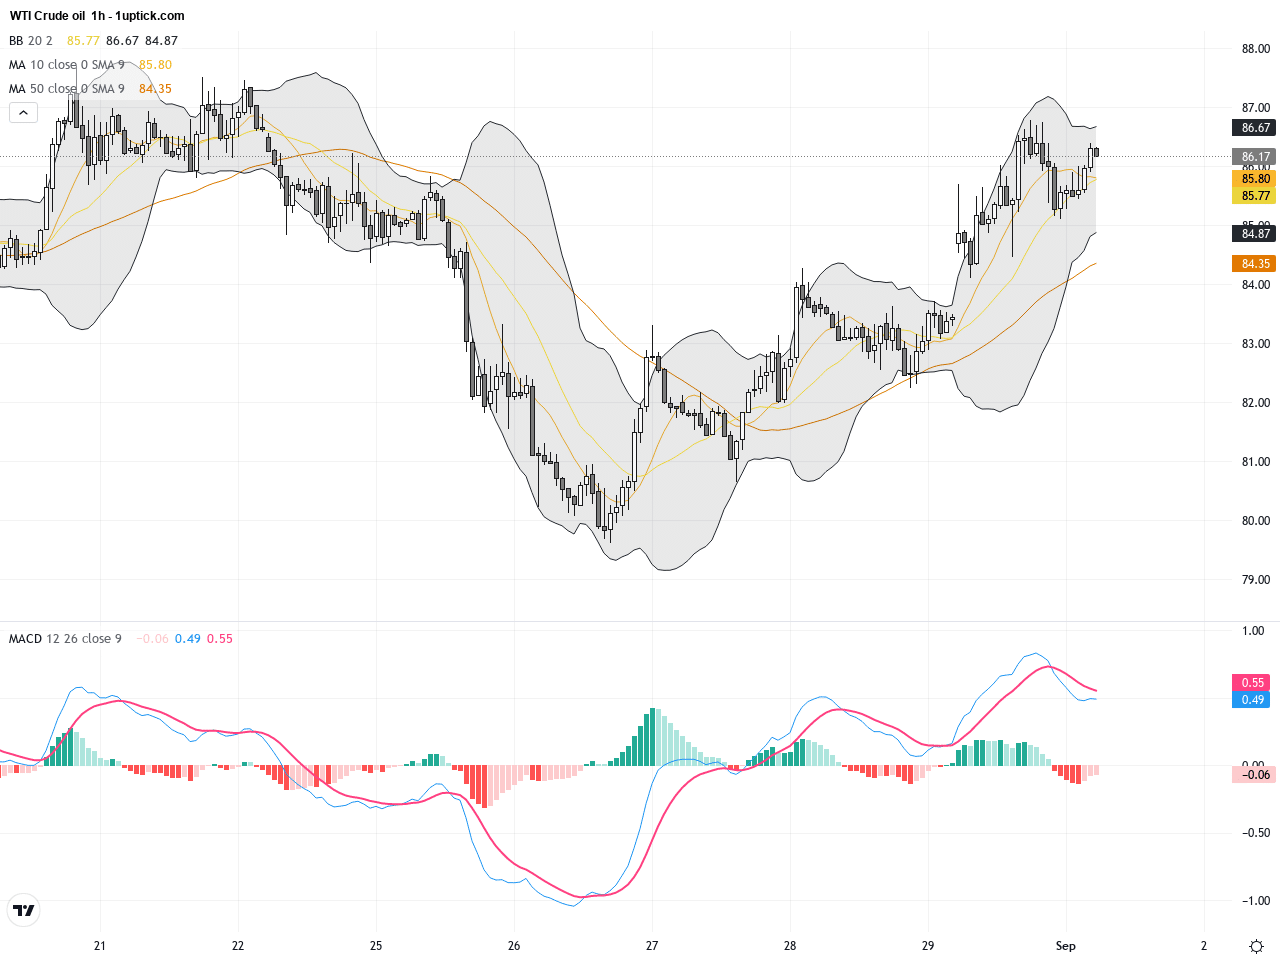
The hourly chart over the last 3 to 5 days displays an oscillating but upward trend with heightened volatility. Short-term moving averages (5 and 20-hour) cross frequently, reflecting short-term battle between buyers and sellers. The Bollinger Bands contracted before expanding again, with recent prices repeatedly testing the upper band and pulling back to the middle band — a classic consolidation before a probable breakout. The MACD lines recently confirmed bullish momentum with growing histogram bars. Notably, a bullish engulfing candlestick has emerged, signaling strong buying interest and suggesting continued price gains in the next 24 hours.
Technical Trend: Clear Bullish Trend (strong and momentum-driven upward move)
Technically, WTI Crude Oil is in a strong bullish phase characterized by MACD golden crosses on both daily and hourly timeframes indicating sustained upward momentum. The ascending flag pattern and bullish engulfing candlestick pattern are powerful buy signals. Increased volatility presents both opportunities and risks, highlighting the importance of monitoring key support and resistance levels combined with volume for potential breakout or reversal signals.There are no significant or directly relevant economic events scheduled today in the GMT+1 time zone that would impact WTI Crude Oil. Given that geopolitical factors currently dominate price action, traders should remain focused on related news flow and market sentiment instead of economic releases.
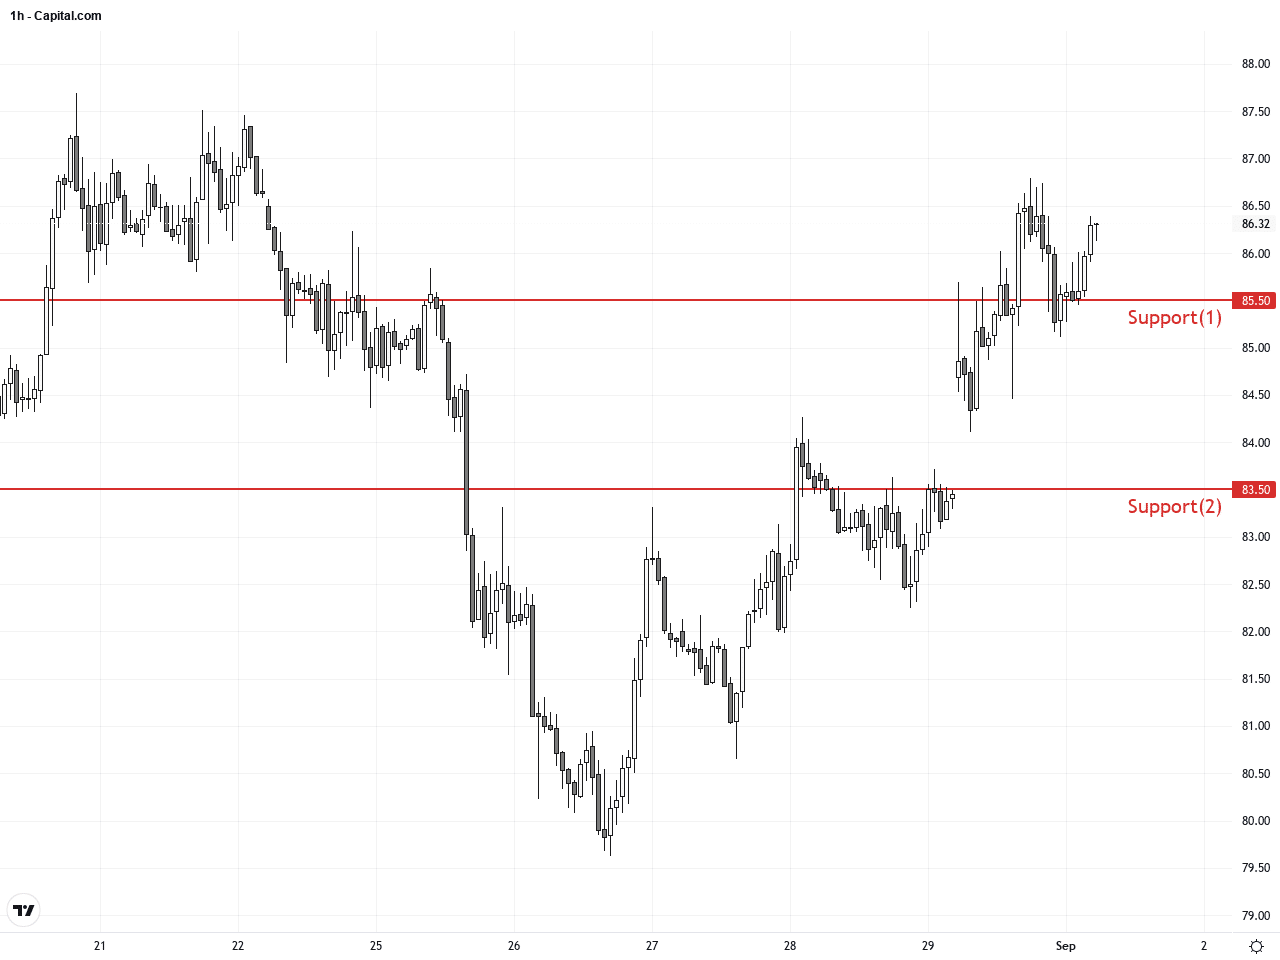
Resistance & Support
Run Live WTI Crude Oil Analysis
The above financial market data, quotes, charts, statistics, exchange rates, news, research, analysis, buy or sell ratings, financial education, and other information are for reference only. Before making any trades based on this information, you should consult independent professional advice to verify pricing data or obtain more detailed market information. 1uptick.com should not be regarded as soliciting any subscriber or visitor to execute any trade. You are solely responsible for all of your own trading decisions.