Technical Analysis
Evaluate price trends and patterns, identify potential investments and trading opportunities!
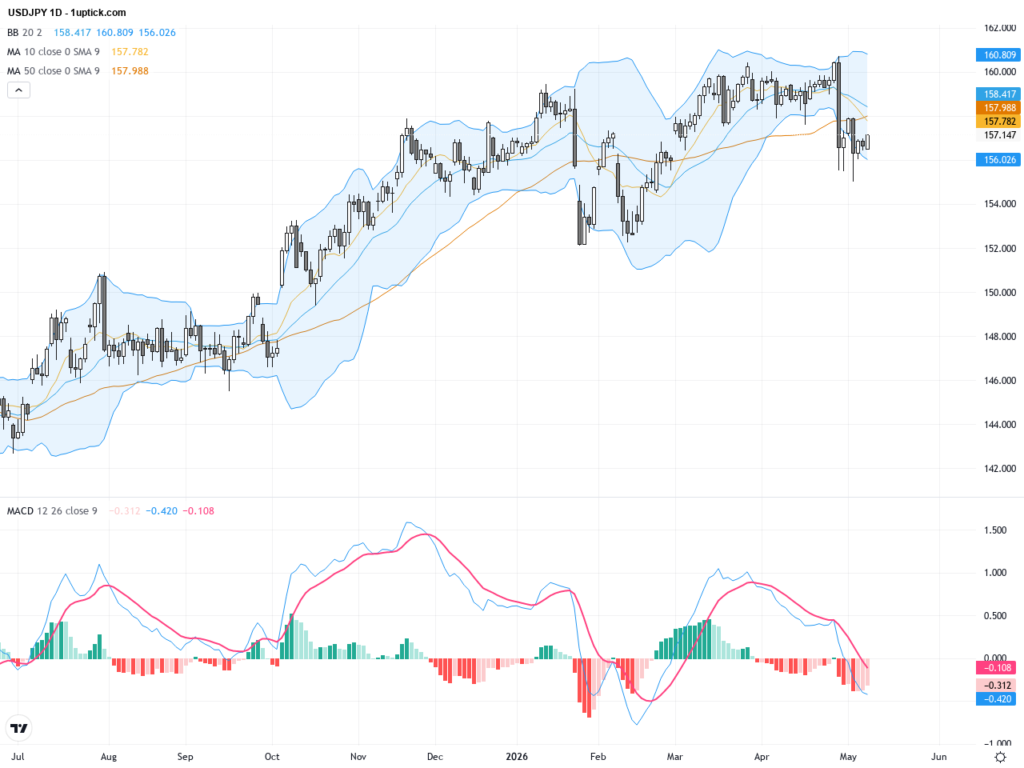
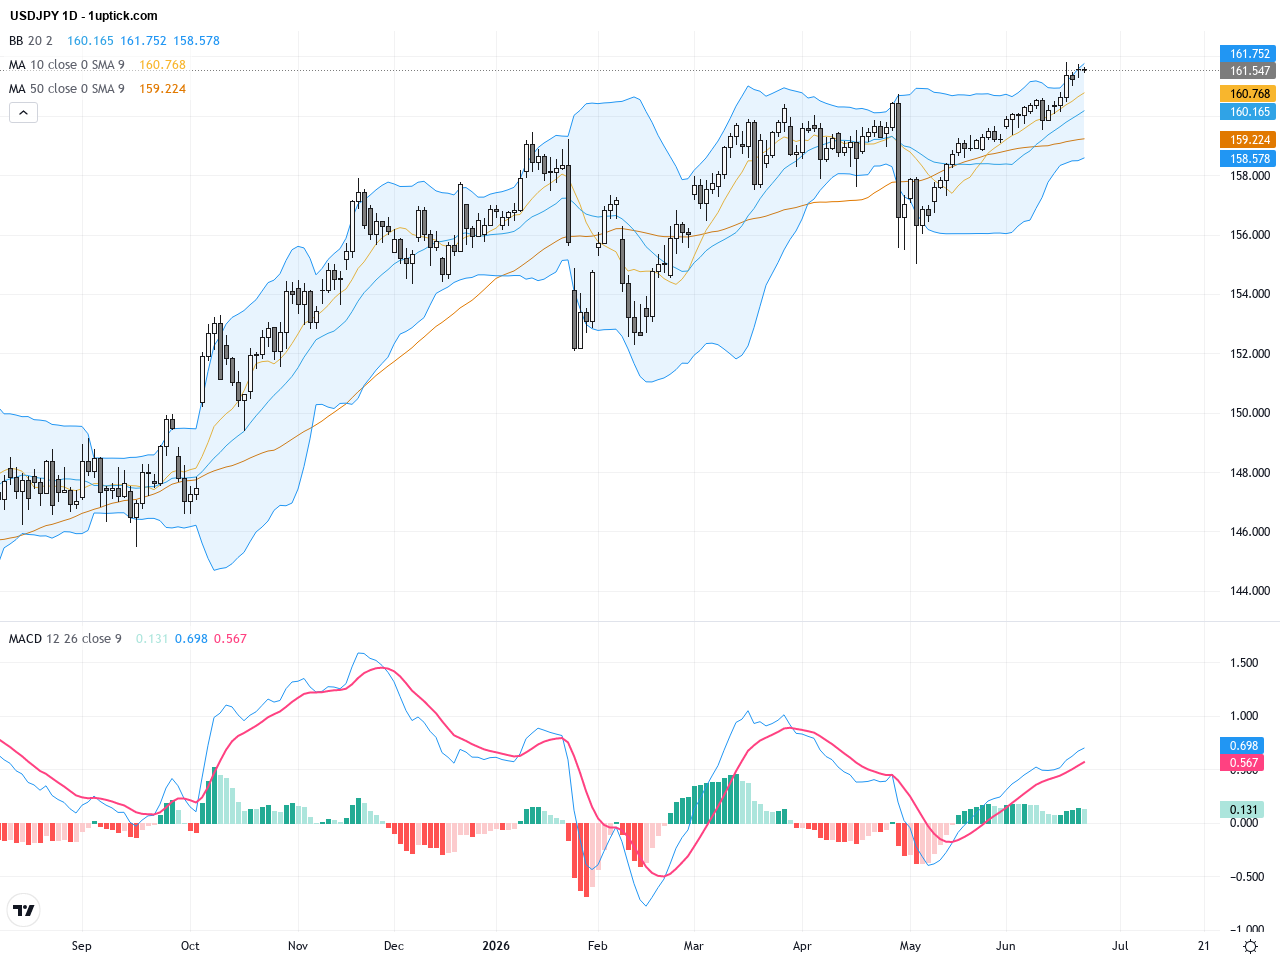
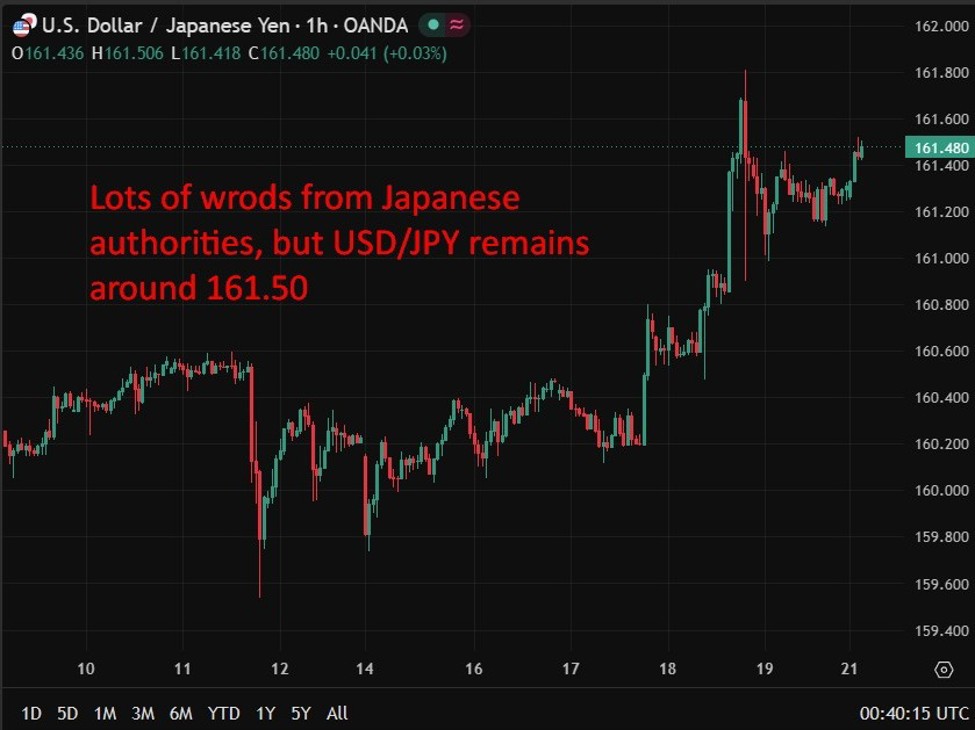
USDJPY: Intervention Risk Caps Rally as Key Resistance Nears 158, May 11, 2026
USDJPY has experienced significant volatility over the past three trading days, with prices oscillating between 156 and 158, closing yesterday at around 157.136. Recent large-scale interventions by Japan have slowed the yen's depreciation, yet traders…
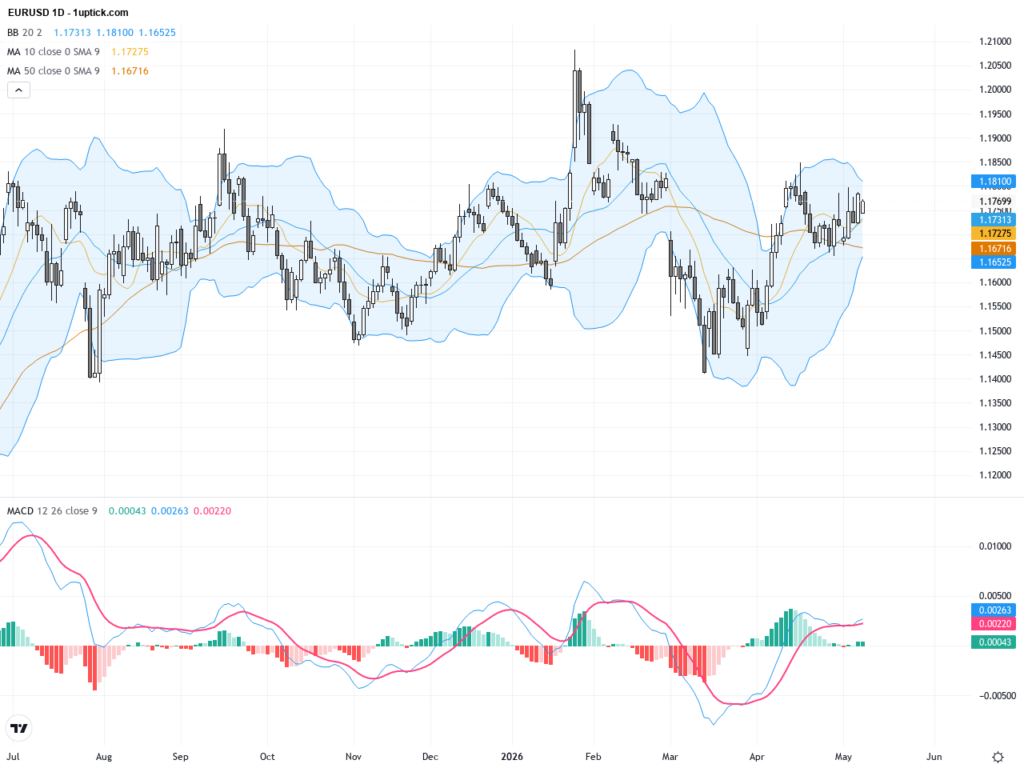
EURUSD: US Dollar Weakness Creates Key Technical Resistance Challenge for Euro-Dollar, May 11, 2026
Over the past three trading days, EURUSD has experienced notable volatility driven by stabilizing US-Iran ceasefire news and weakening US consumer sentiment. Yesterday’s closing price was 1.17708, down roughly 0.12% from the previous day. Optimism…
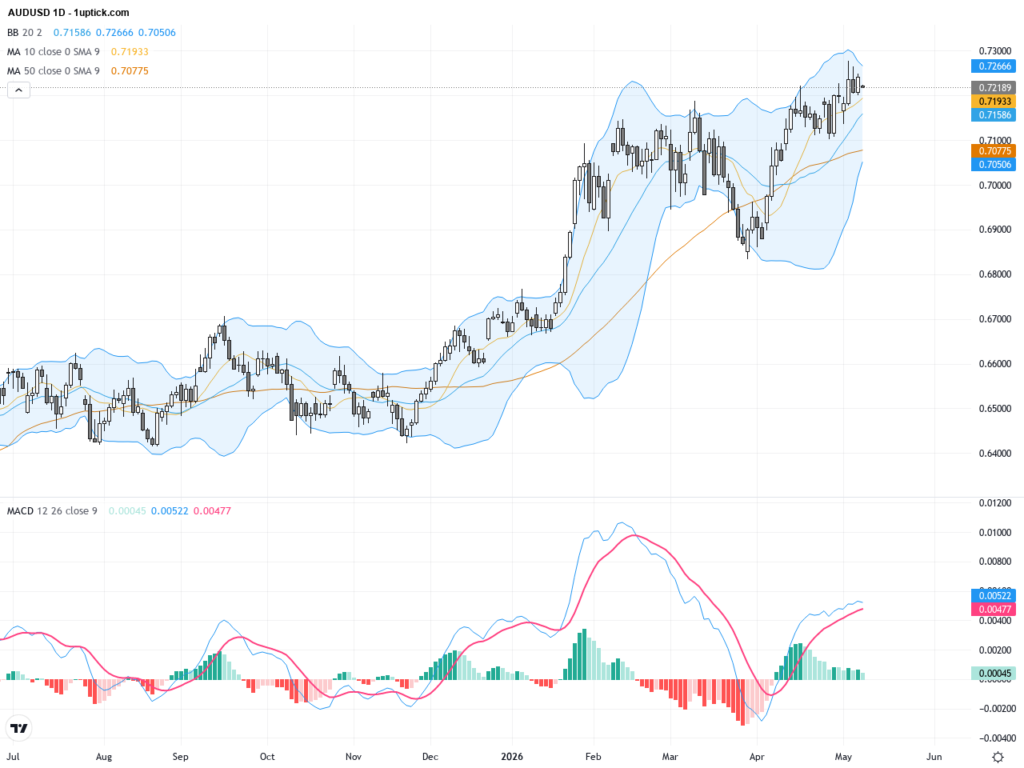
AUDUSD Technical & Fundamental Analysis: Four-Year Highs Signal Strong Bullish Momentum, May 11, 2026
Over the past three trading days, AUDUSD has demonstrated robust performance, closing near a four-year high of 0.72178. This rally is driven by improved risk appetite, optimism ahead of the Trump-Xi summit, and firm expectations…
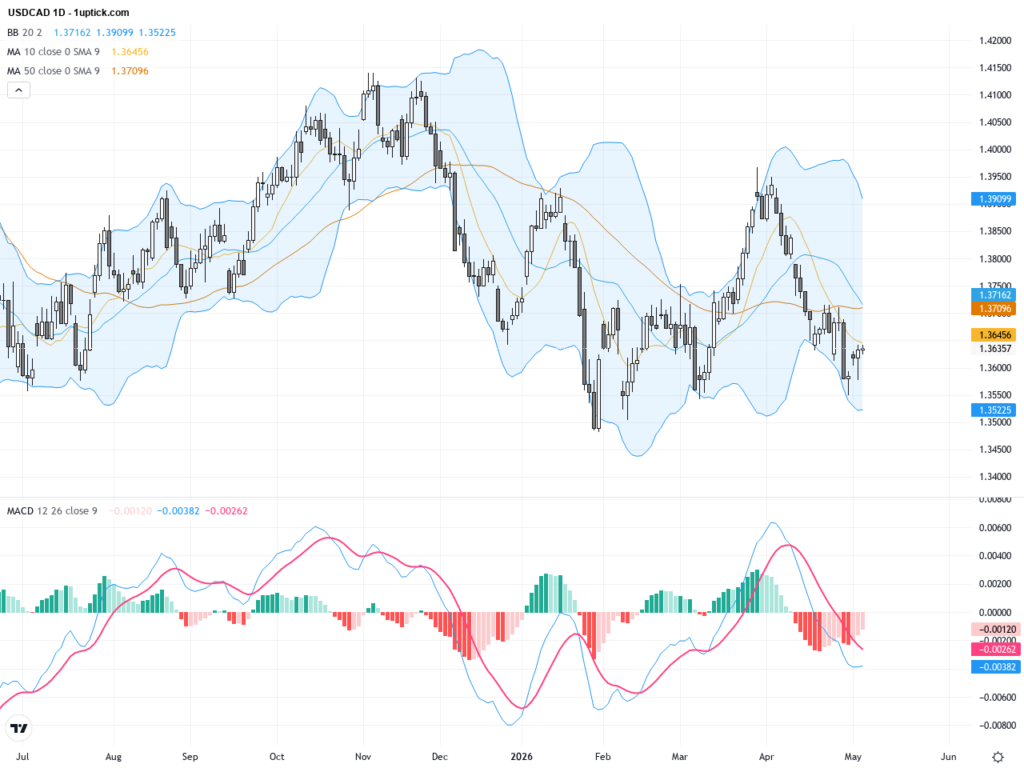
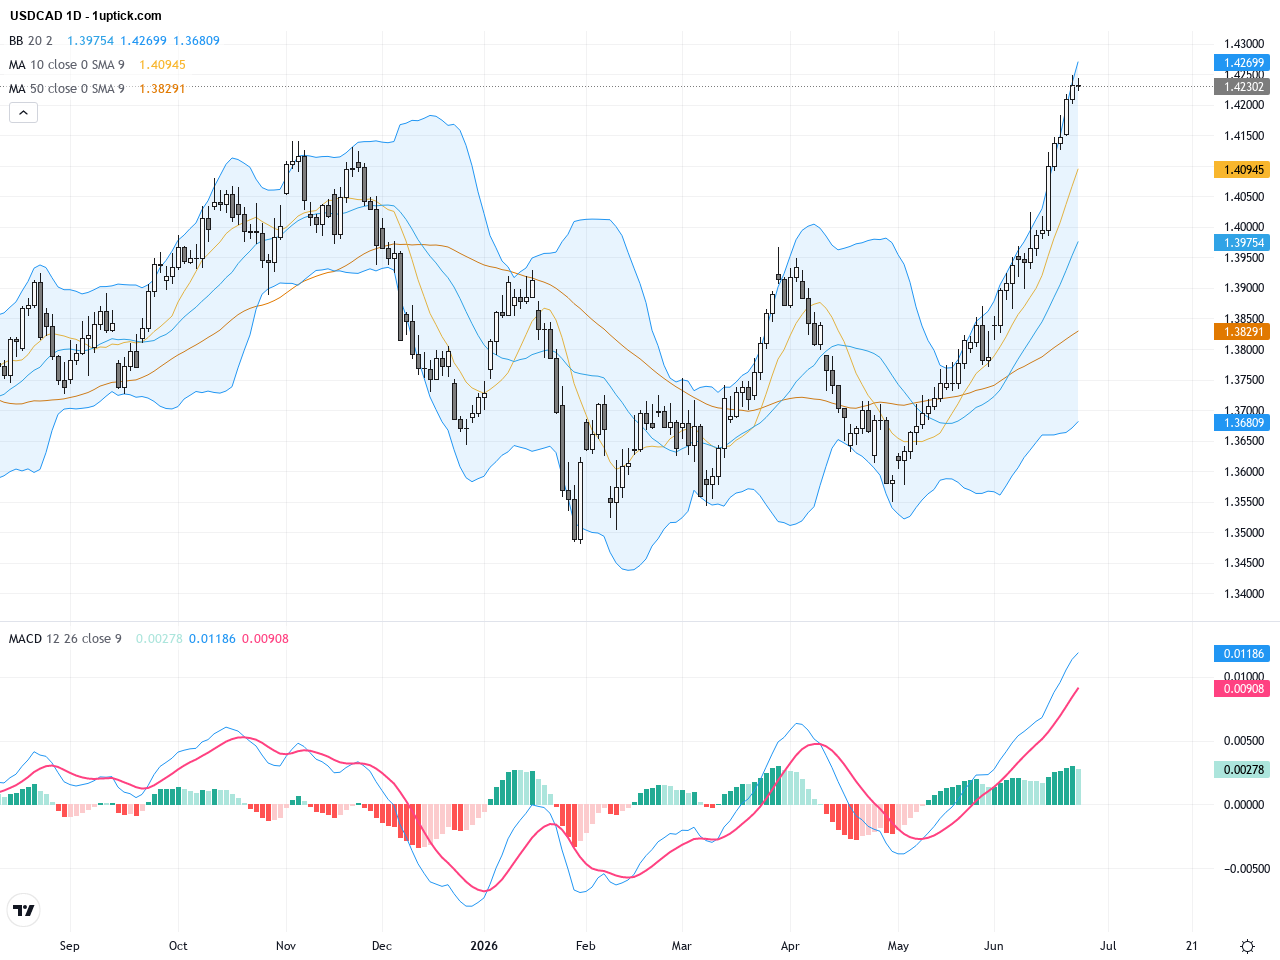
USDCAD: Key Technical Breakout Amid Weak Canadian Jobs Data – Trading Outlook, May 9, 2026
Over the past three trading days, USDCAD has shown an upward momentum, closing yesterday at 1.36357, slightly above previous close. Weak Canadian employment data recently pressured the loonie, giving the USD some strength against CAD.…
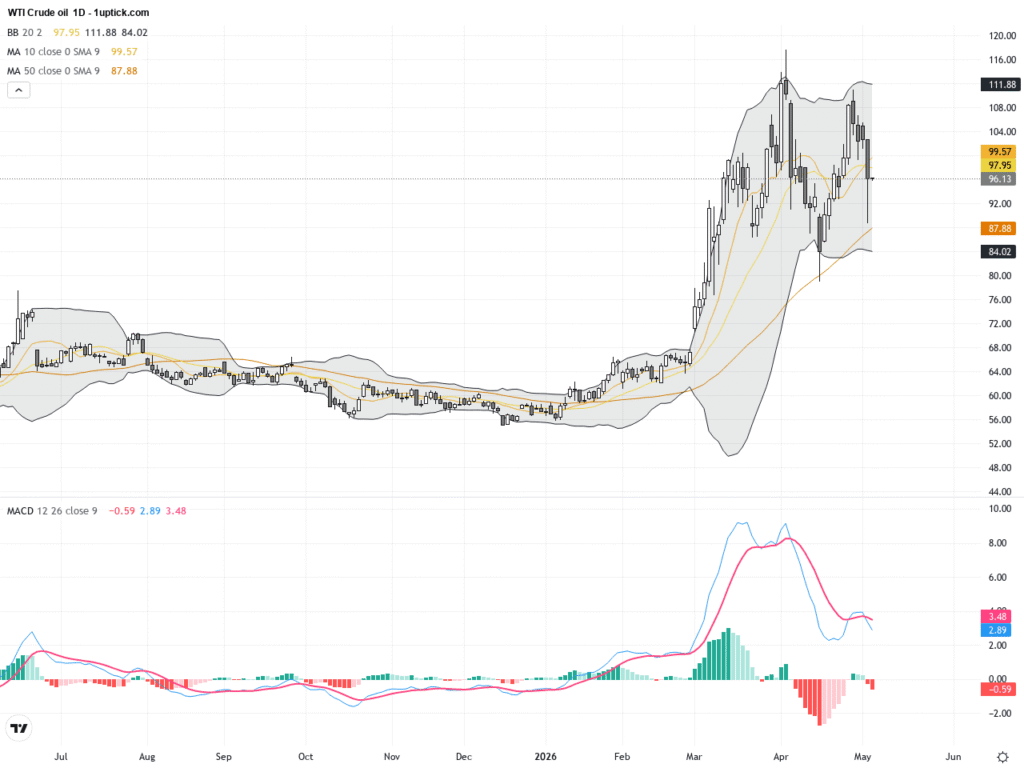
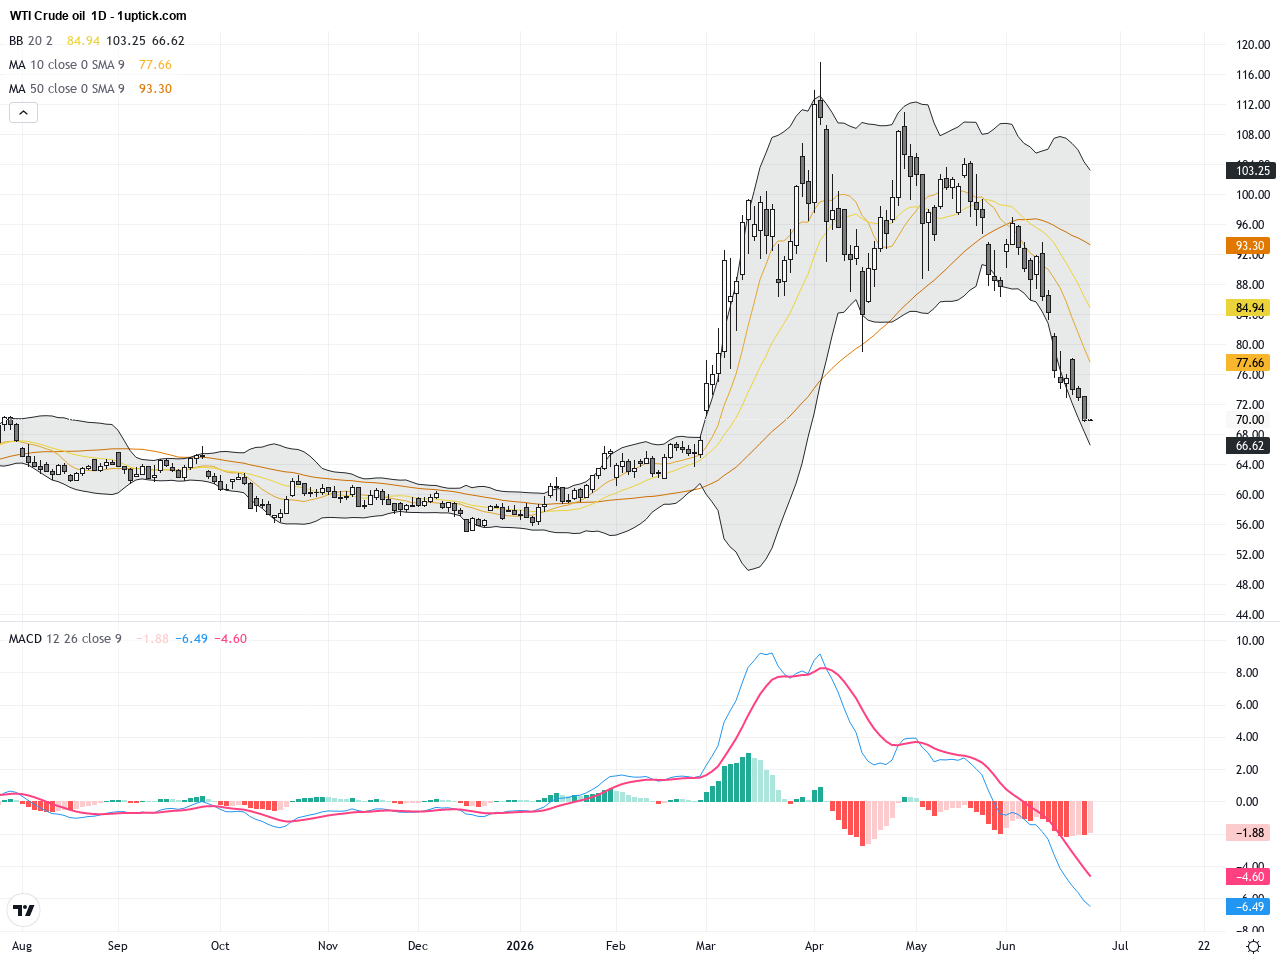
WTI Crude Oil: Key Support and Resistance Levels Amid Volatile Trading Outlook, May 9, 2026
WTI Crude Oil has shown significant volatility in the past three trading days, dropping from above $106 to close at $95.08 yesterday. This price movement was driven by US efforts to fill the global oil…
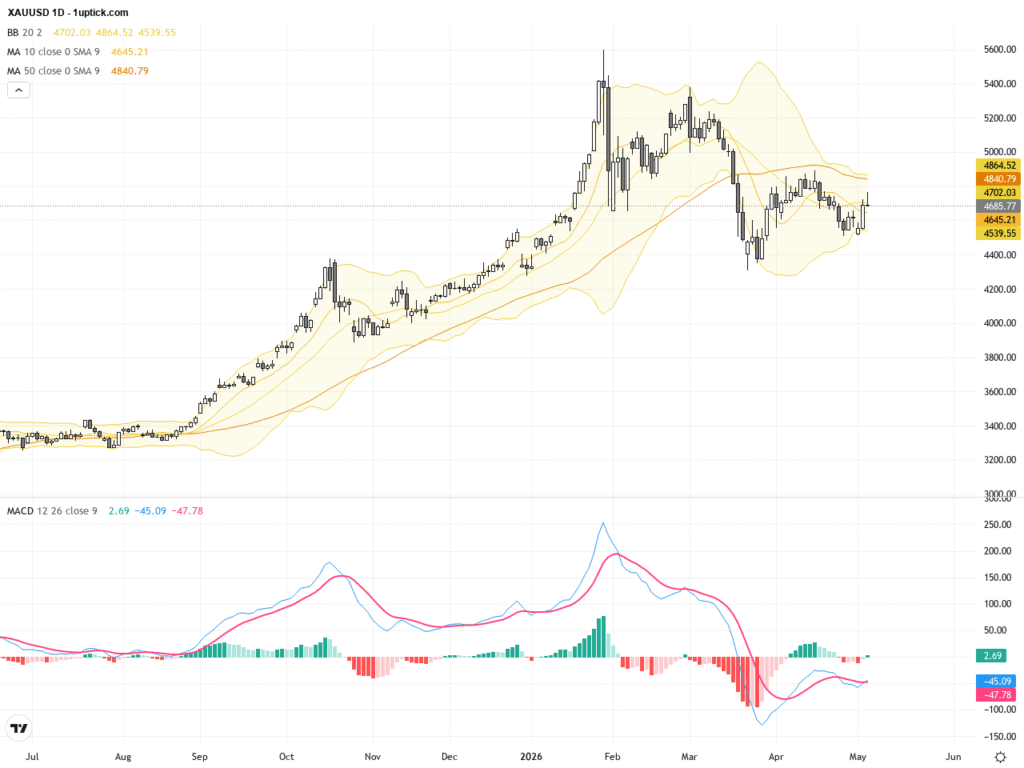
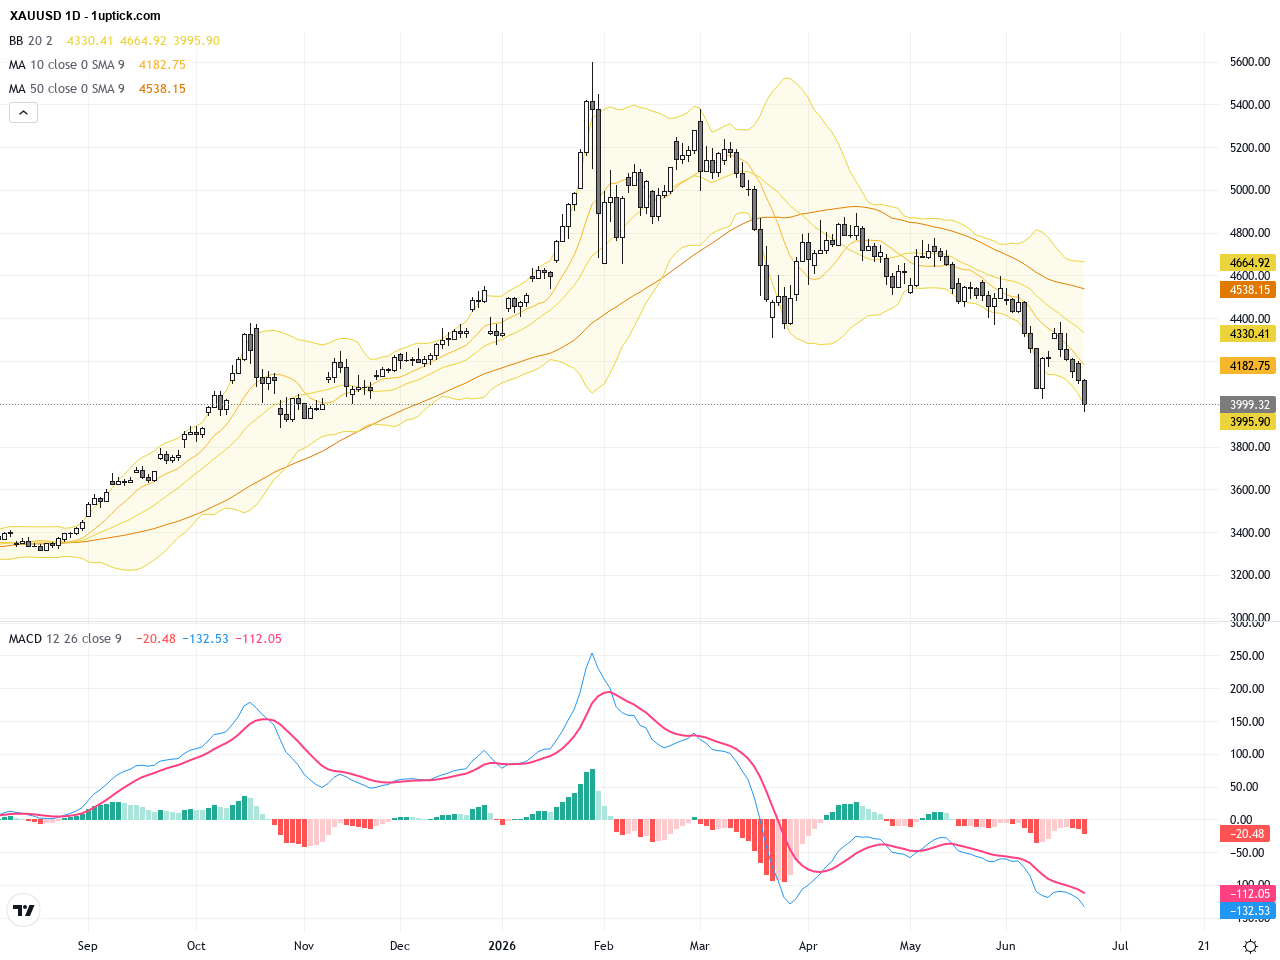
XAUUSD: Gold Breaks Above 20 & 50-Day Moving Averages, Signaling Strong Technical Rally, May 9, 2026
XAUUSD has experienced significant volatility over the past three trading days. After hovering around 4690 on May 6, gold prices surged to close above 4700 on May 7, reaching highs near 4764. This rally is…

WTI Crude Oil: Bollinger Bands and MACD Signal Volatile Consolidation Amid Middle East Tensions, May 6, 2026
Over the past three trading days, WTI Crude Oil prices have experienced significant volatility, fluctuating from a close of $106.42 on May 4th amid geopolitical and supply concerns. Heightened tensions in the Middle East and…