Technical Analysis
Evaluate price trends and patterns, identify potential investments and trading opportunities!
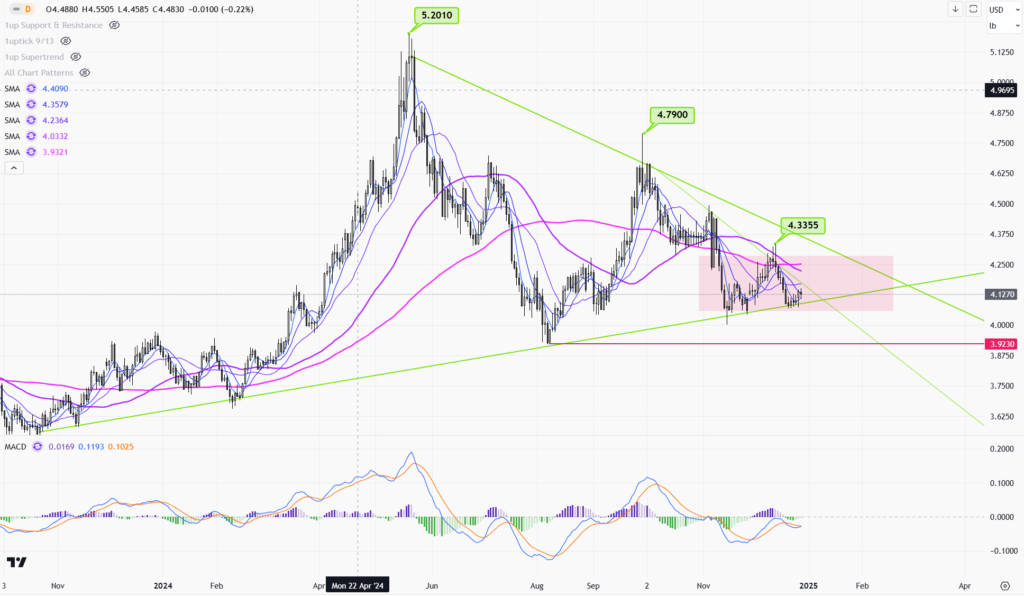
Copper trend remains bearish!
Price Movement The daily chart of copper reveals a significant long-term downtrend following a peak at $5.2010. The price has been making lower highs and lower lows, indicating persistent bearish momentum. Recent sessions show copper…
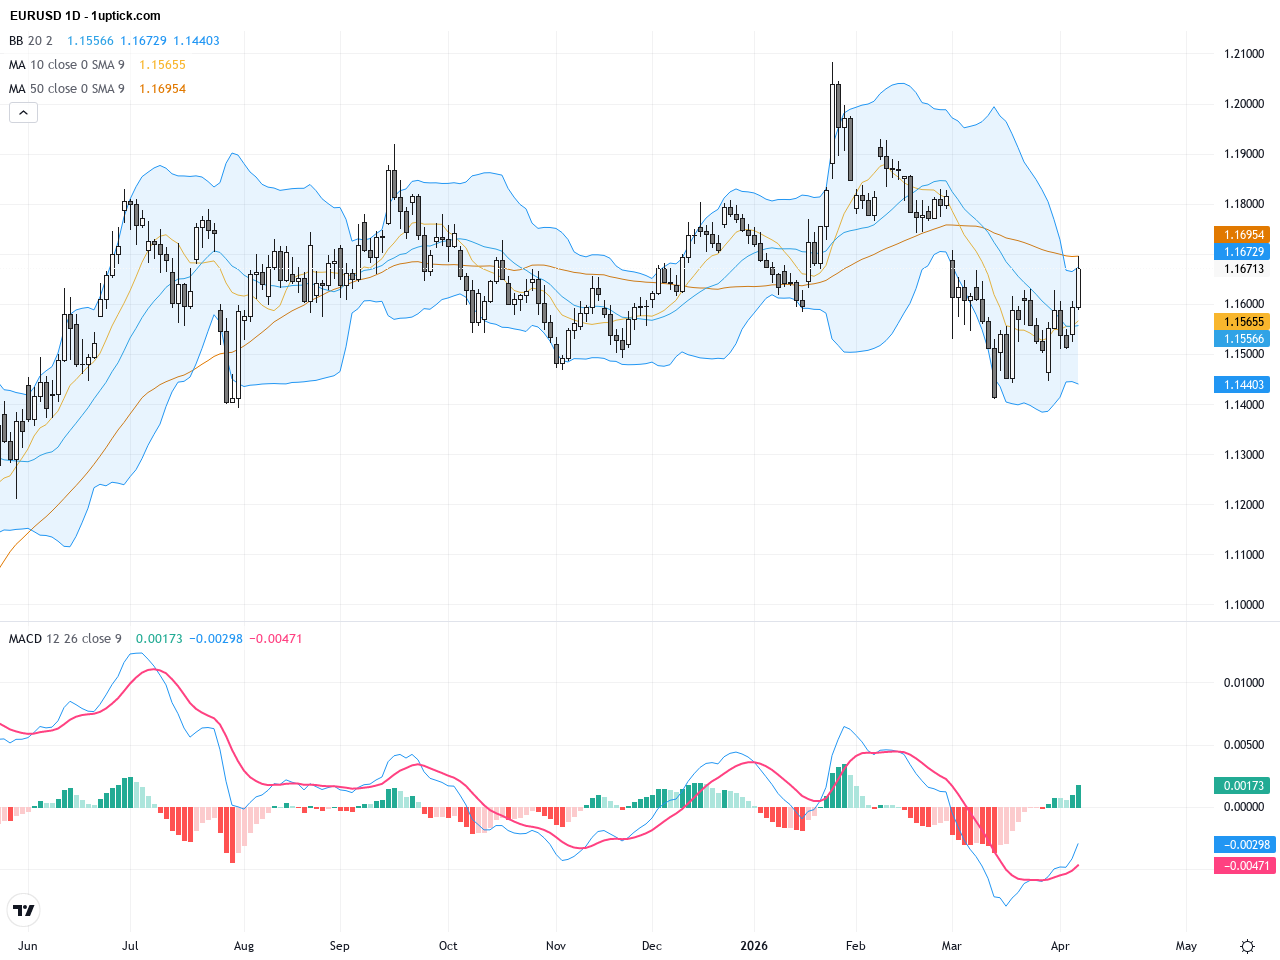
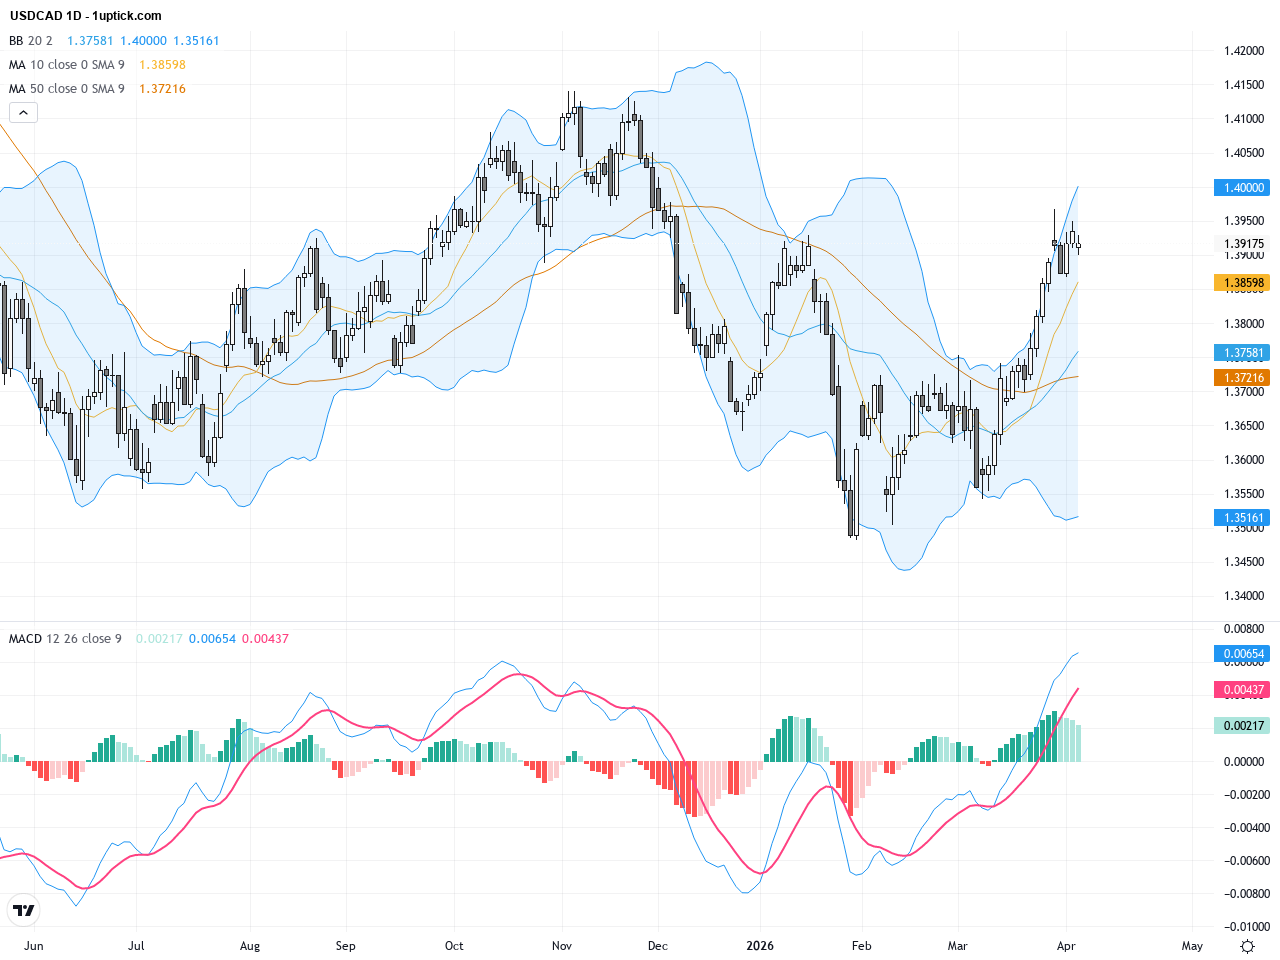
EUR find the botton yet?
Price Movement The EUR/USD daily chart showcases a significant downtrend over recent months, with the pair forming lower highs and lows. After a sharp decline in late October, the price began to stabilize, finding support…
EUR find the botton yet?
Price Movement The EUR/USD currency pair has experienced significant volatility recently. The pair was initially in a downward trend but appears to establish a base support around the 1.03330 level. The price action shows several…
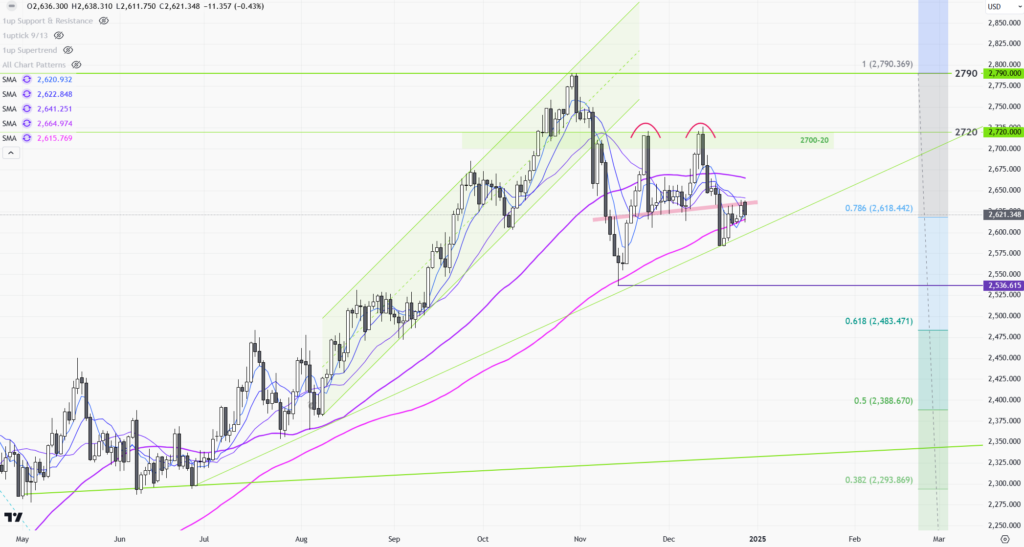
Gold double top pattern in progress ! Ready to do deep ?
Price Movement The gold daily chart reveals a significant bullish trend that persisted from May to early November, characterized by a steady rise with minor corrections. The price reached a peak around the 2,790 level,…
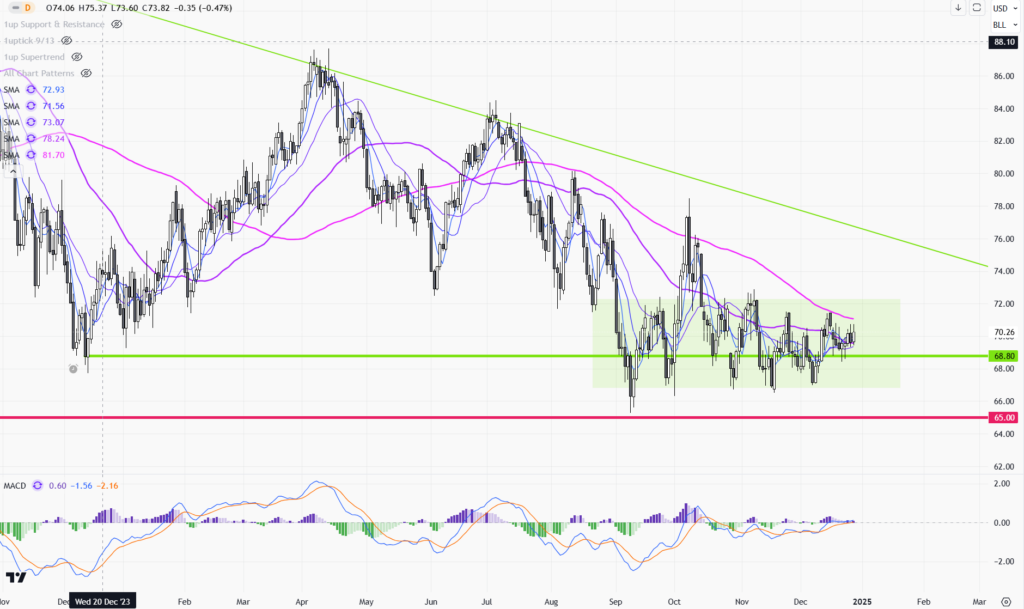
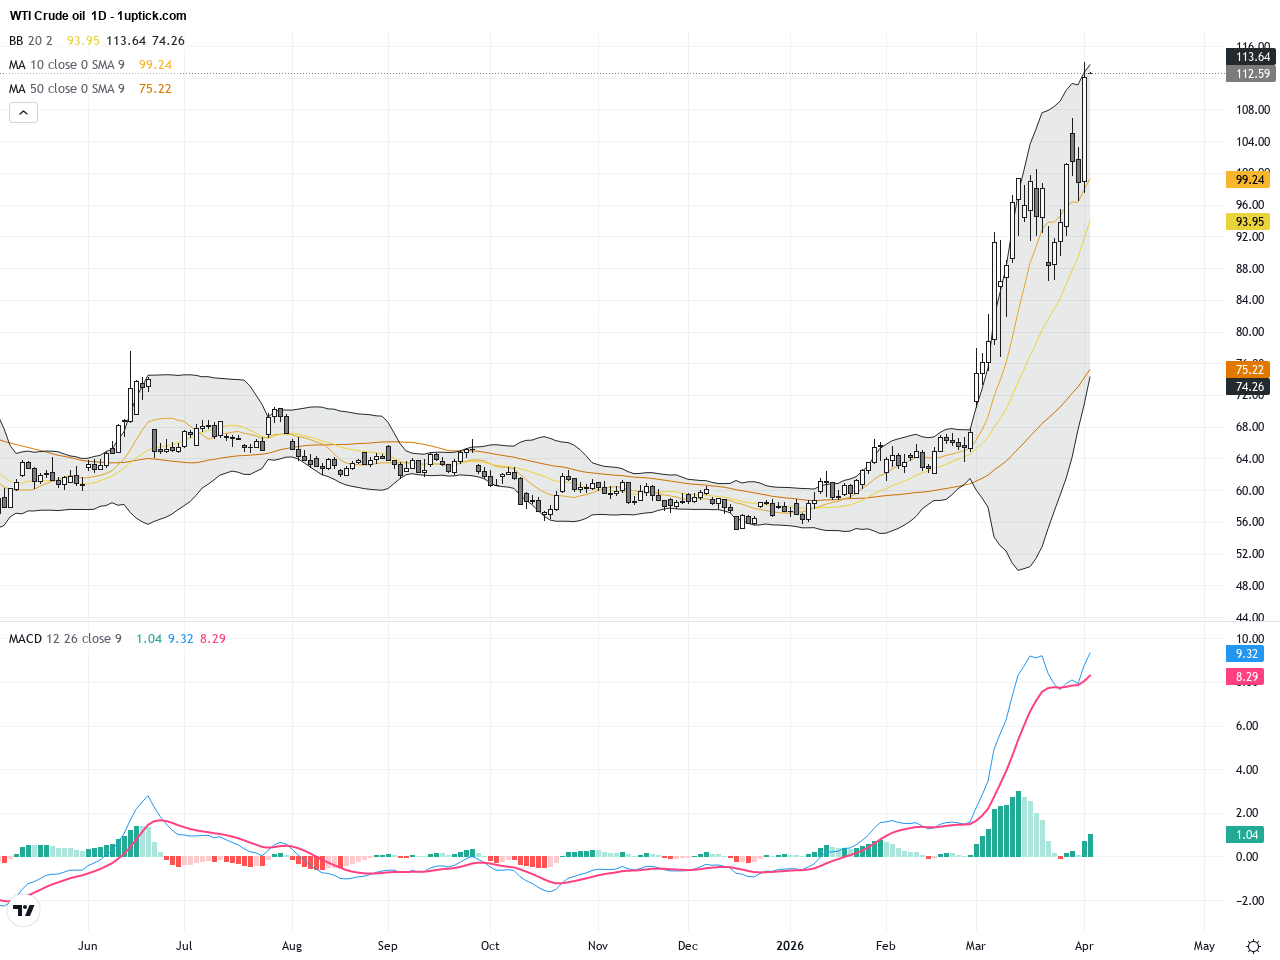
WTI oil consolidation period continues!
Price Movement The WTI crude oil daily chart indicates a series of volatile price movements within a descending channel. The price has oscillated between the $65 support level and the $88 resistance level, reflecting a…
Gold Trend – M-T downtrend is yet to complete ?
The downtrend in gold prices continued last week after turning back from the previous week's high of 2726.The decline accelerated after the Fed's interest rate meeting on Wednesday, failing to support at 2630(1) and falling…
Gold Trend – Profit taking will dominate before the year’s end
Despite the initial drop on Monday, the gold price was relatively quiet last week. The price shot up to around 2710 due to all the geopolitical tensions the week before. But then, it quickly retreated…