Technical Analysis
Evaluate price trends and patterns, identify potential investments and trading opportunities!
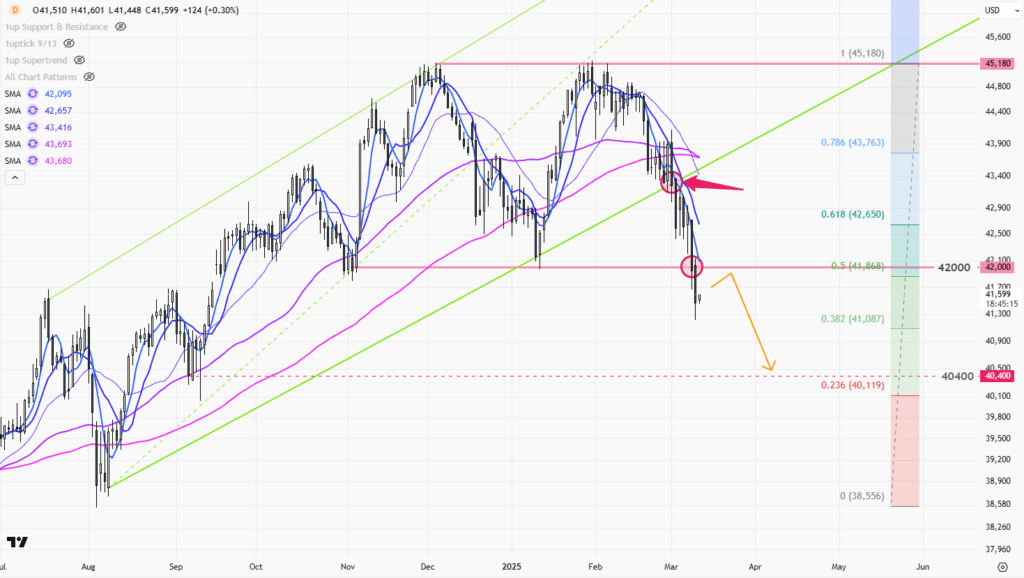
DOW on its way down !
Price Movement The Dow’s daily candlestick chart demonstrates a significant downward trajectory, breaking below previously established support levels. The price movement in recent months has transitioned from a period of consolidation to a notable bearish…
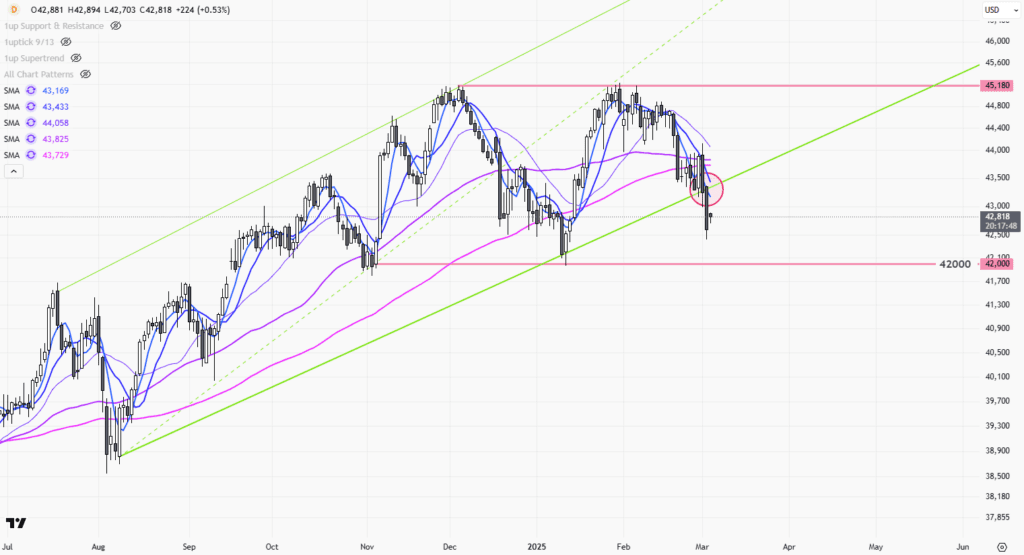
DOW 30 on its way to 42000!
Price Movement The daily chart of the S&P depicts a fluctuating trend with periods of both bullish and bearish sentiment. Initially, there is a significant uptrend, indicated by a series of higher highs and higher…
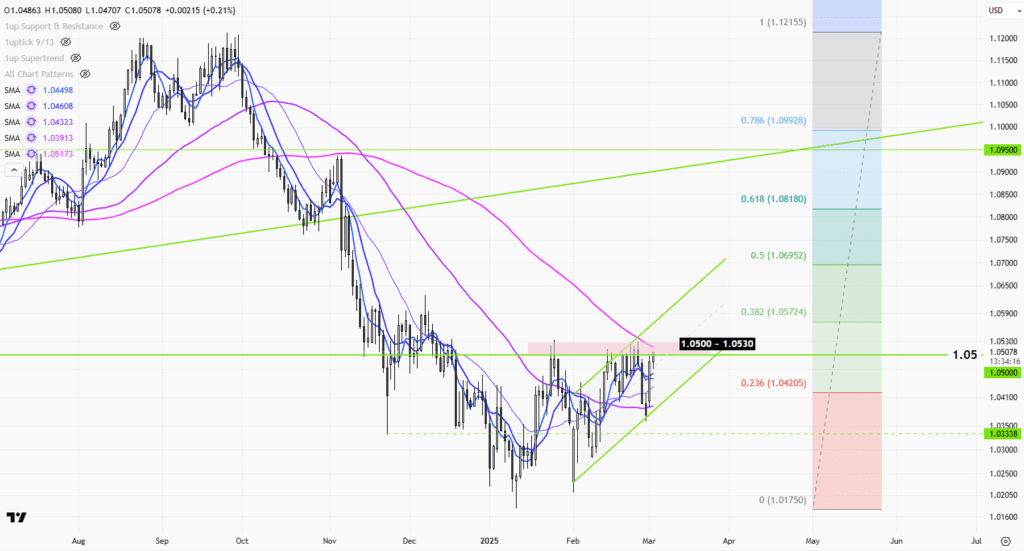
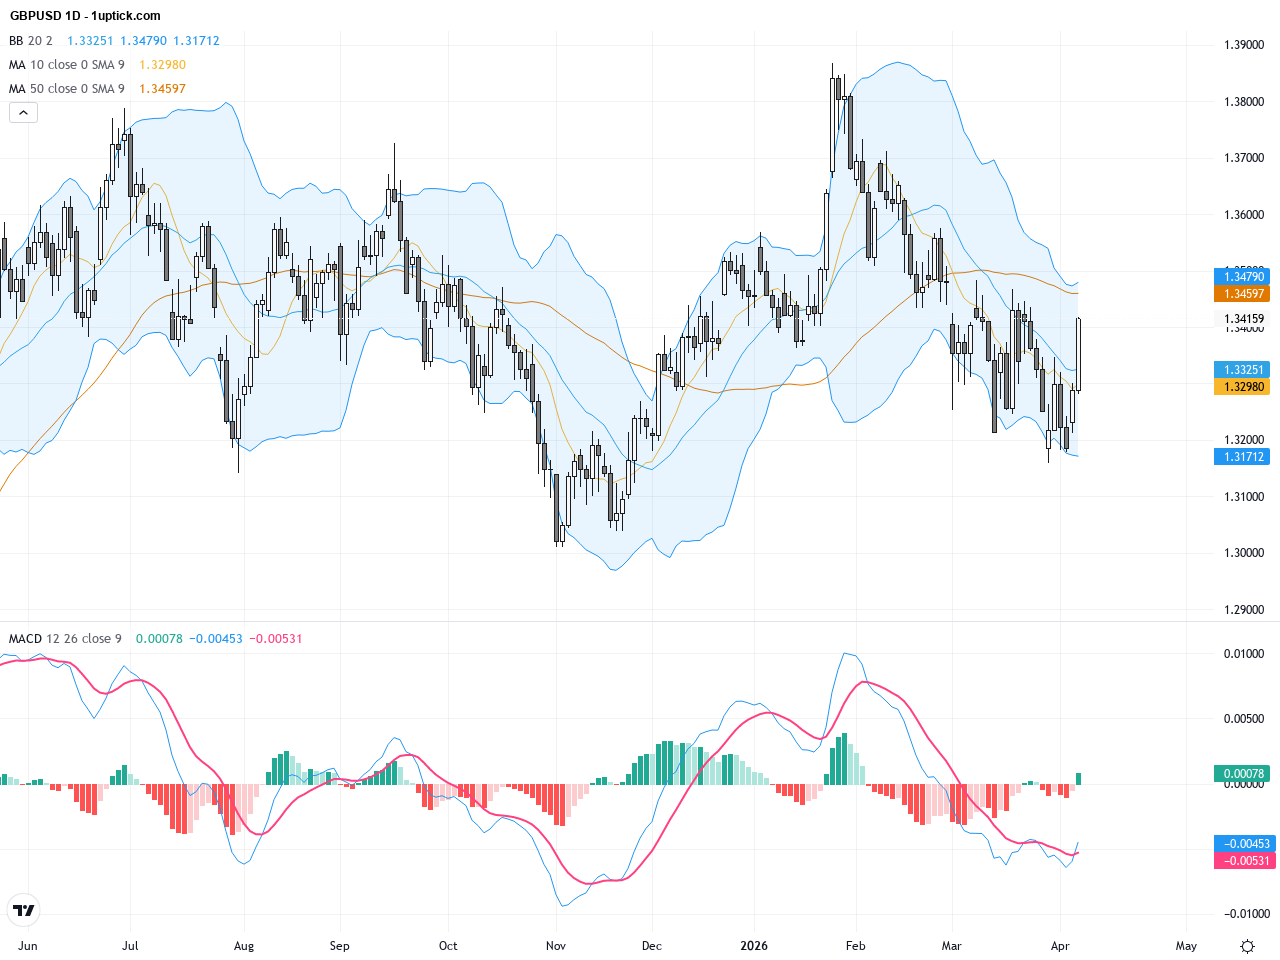
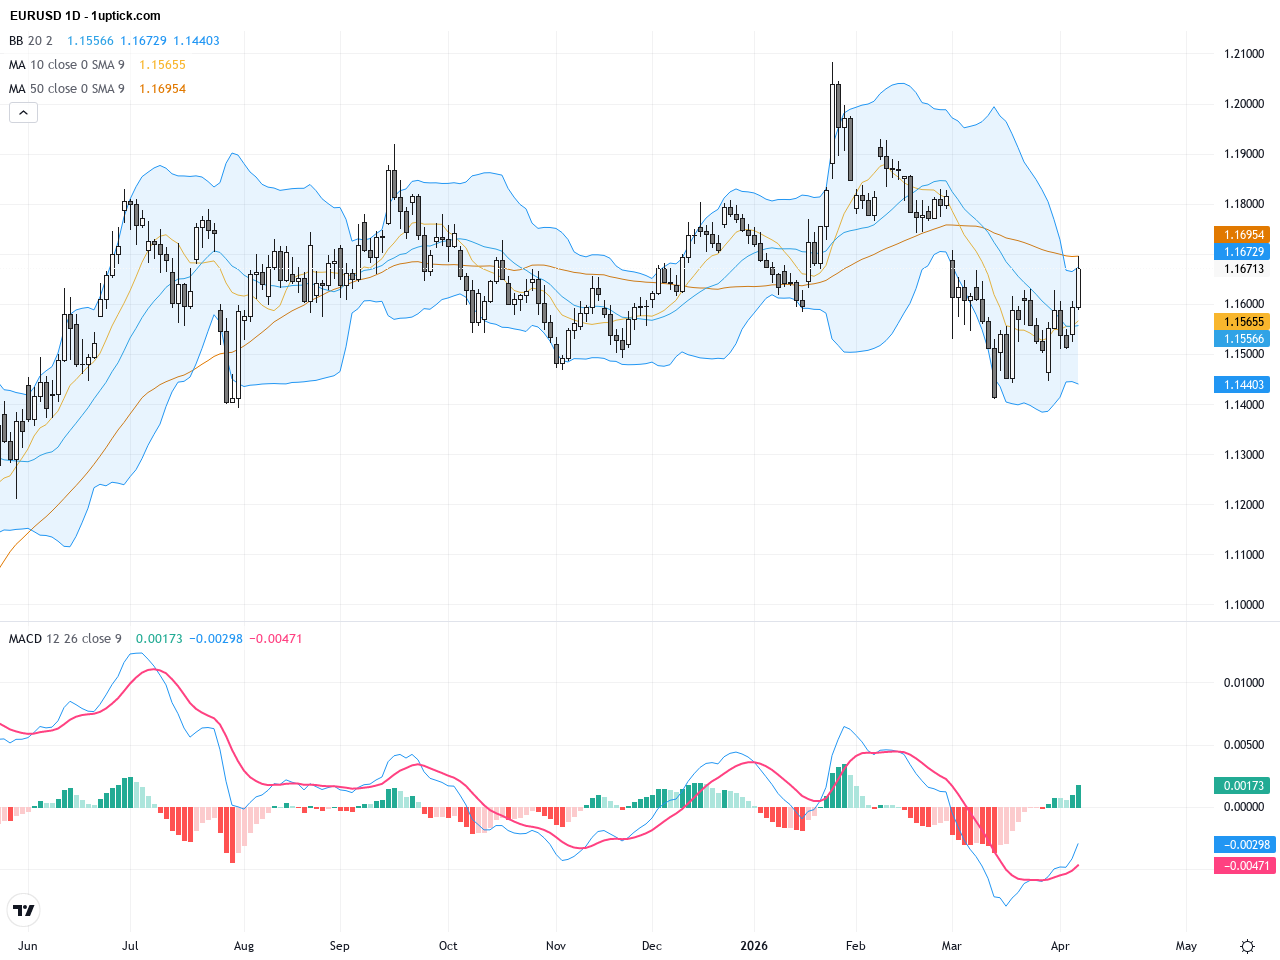
EUR ready to breakout 1.05?
Price Movement The EUR/USD daily chart shows prolonged bearish movement followed by a consolidation period. Initially, the pair experienced a significant downward trend as indicated by consecutive lower lows and lower highs. A reversal was…
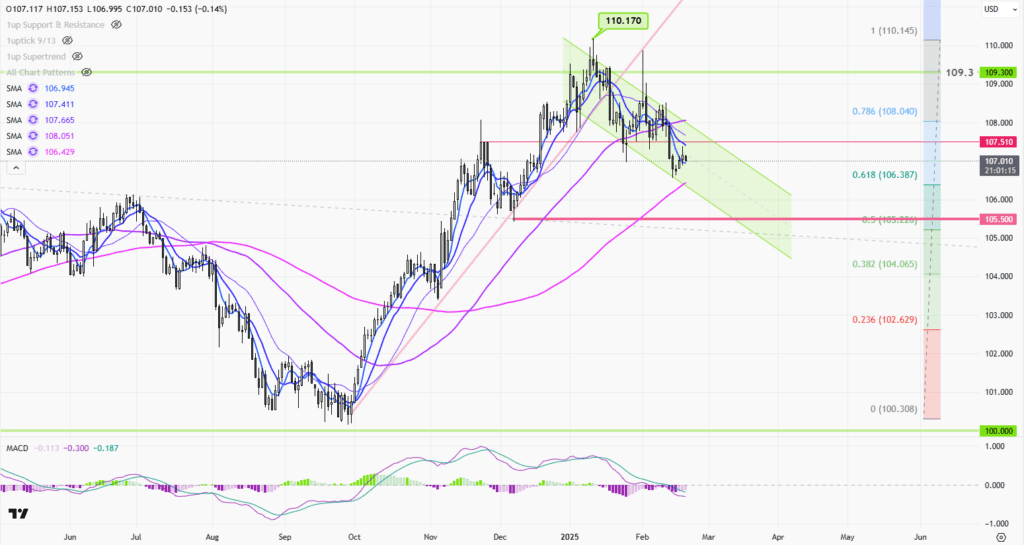
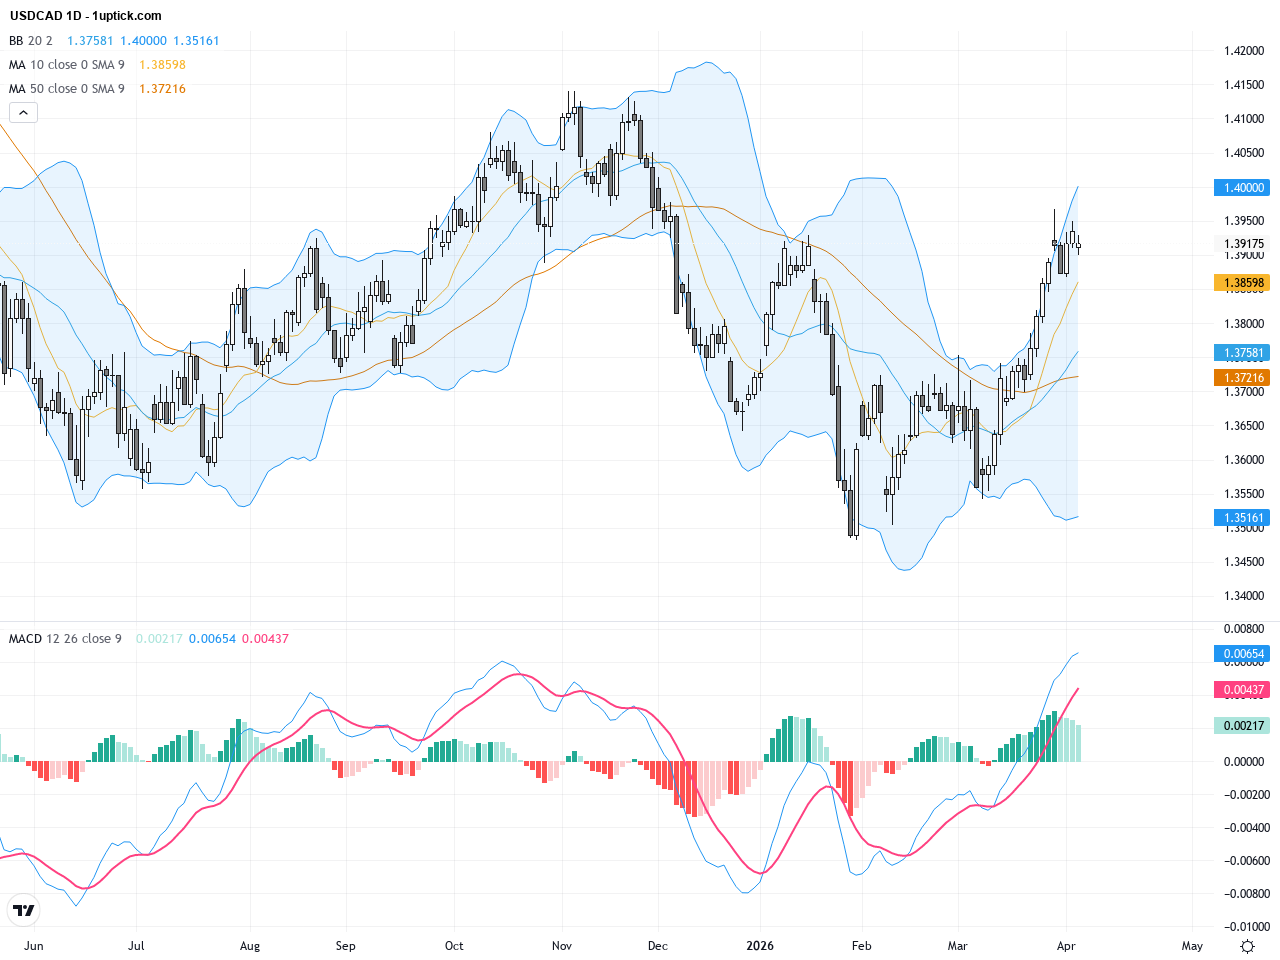
USD maintain in a downtrend channel!
Price Movement The USD Index daily chart shows a recent period of volatility with notable price shifts. Initially, the index experienced an upward trend, reaching a peak near 110.170. This rise was followed by a…

Trump Says He Plans Reciprocal Tariffs, Will Affect ‘Everyone’
Testing testing

Bitcoin on a downtrend?
Price Movement The daily candlestick chart for the Bitcoin shows a significant upward movement that peaked at around 108,364, followed by a correction phase. Initially, the price rallied from a consolidation phase into a substantial…

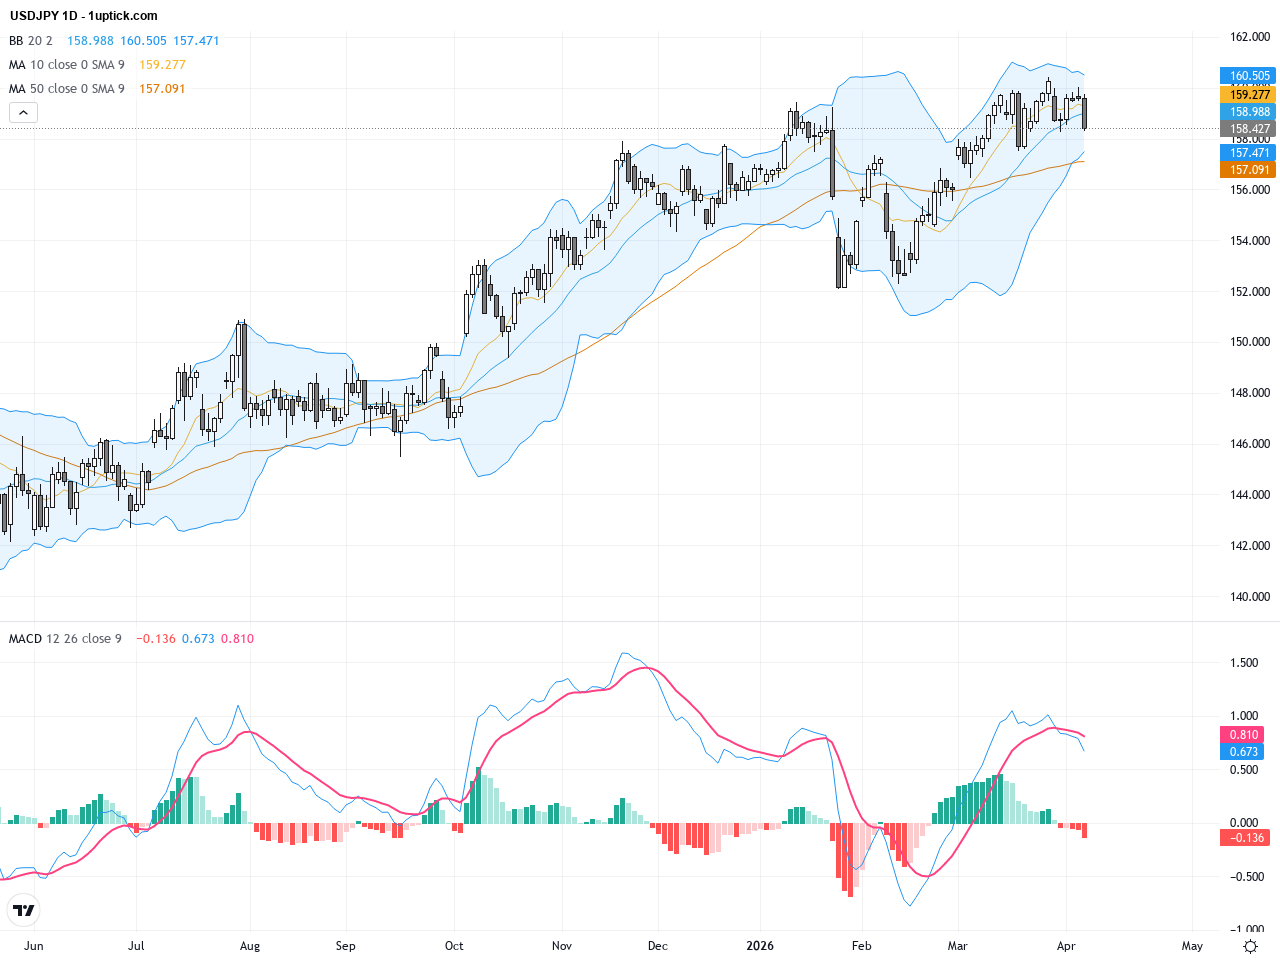
USDJPY uptrend remains?
Price Movement The USD/JPY daily chart displays a strong upward trend, with the price moving consistently higher since early October. After hitting a low around 140 in late August, the pair embarked on a bullish…