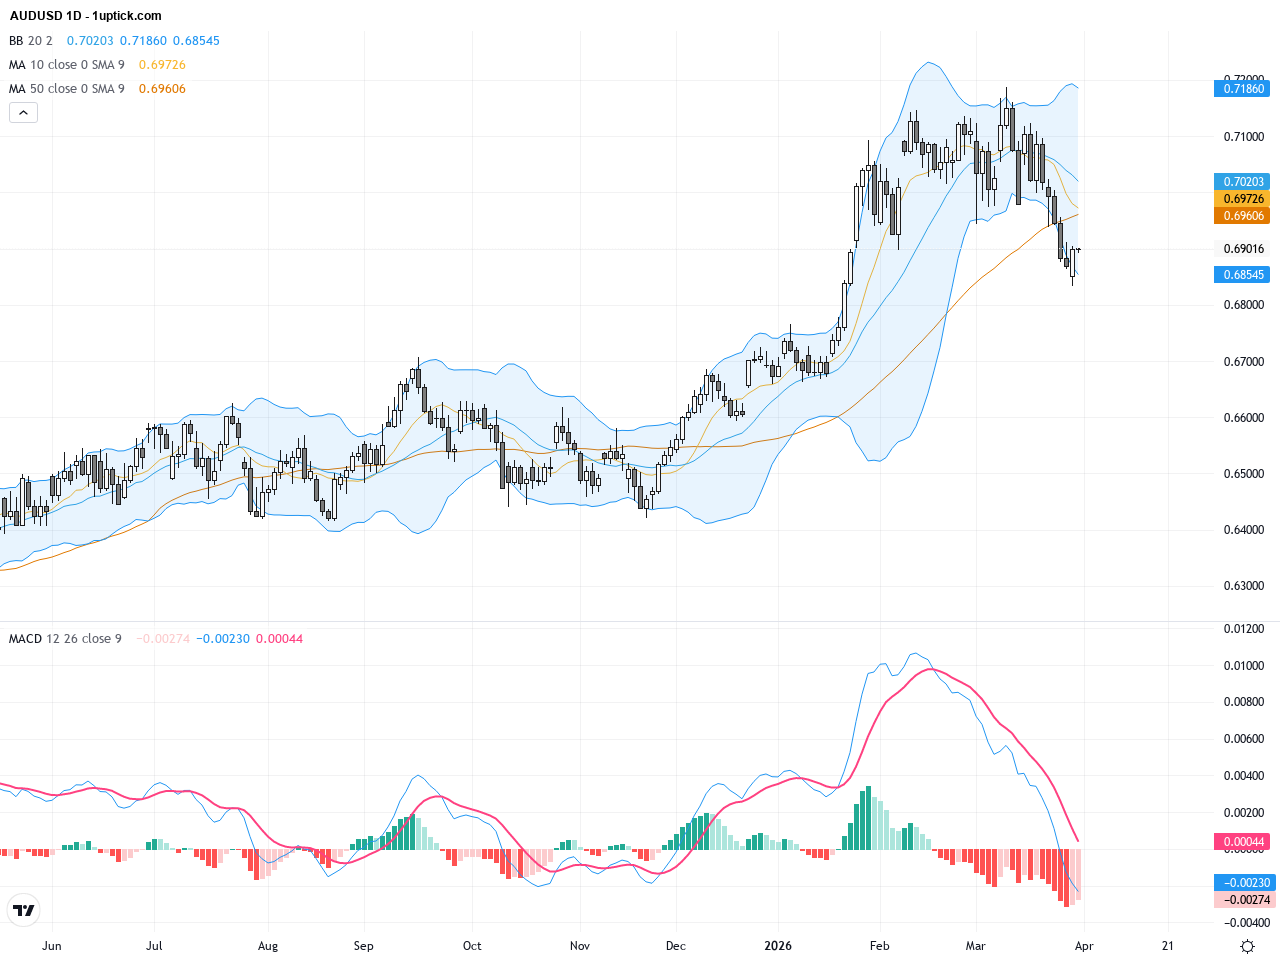
AUDUSD: Technical Patterns Signal Potential Rebound, Key Support and Resistance Levels to Watch
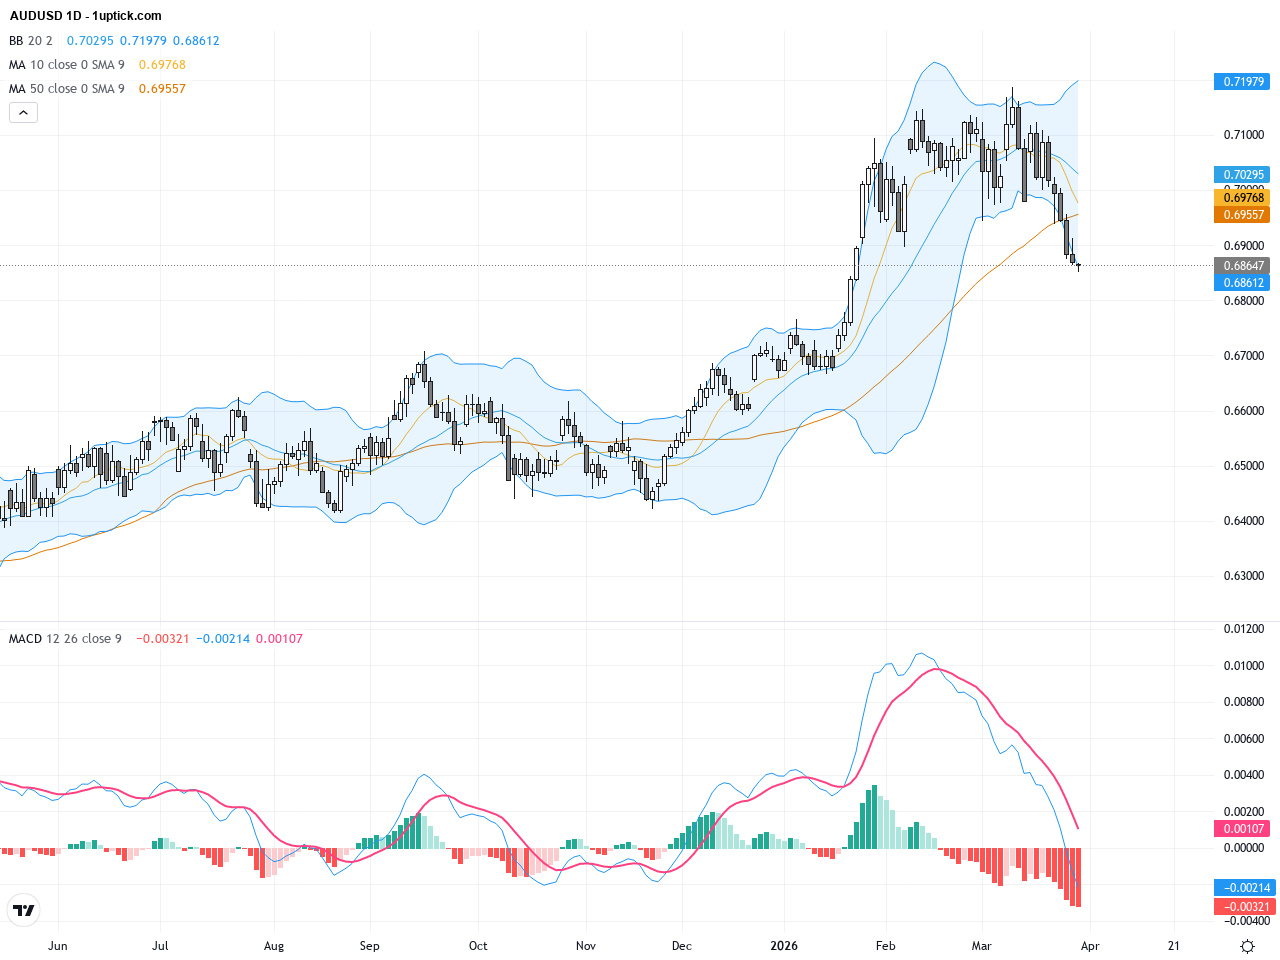
Over the past three trading days, AUDUSD experienced notable volatility with a significant rebound of 0.69% on Tuesday, closing near 0.6900, roughly unchanged from yesterday’s close at 0.69015. Renewed hopes for peace in the Middle East boosted risk appetite, driving this recovery after a five-session slide. For everyday investors, imagine receiving positive news after a tough streak, prompting a currency or stock to bounce back sharply. This shift reflects improved market sentiment for the Australian dollar. Going forward, monitoring key support and resistance levels will be crucial in navigating trading opportunities effectively.